Free Statistics

of Irreproducible Research!

Author's title

Author*Unverified author*
R Software Modulerwasp_centraltendency.wasp
Title produced by softwareCentral Tendency
Date of computationFri, 26 Dec 2014 16:55:09 +0000
Cite this page as followsStatistical Computations at FreeStatistics.org, Office for Research Development and Education, URL https://freestatistics.org/blog/index.php?v=date/2014/Dec/26/t1419612934ellojao8qyeebxt.htm/, Retrieved Sat, 18 May 2024 16:31:40 +0000
Statistical Computations at FreeStatistics.org, Office for Research Development and Education, URL https://freestatistics.org/blog/index.php?pk=271571, Retrieved Sat, 18 May 2024 16:31:40 +0000
QR Codes:

Original text written by user:
IsPrivate?No (this computation is public)
User-defined keywords
Estimated Impact65
Family? (F = Feedback message, R = changed R code, M = changed R Module, P = changed Parameters, D = changed Data)
-       [Central Tendency] [] [2014-12-26 16:55:09] [3b96c46cffecdf3c11148678d326f85c] [Current]
Feedback Forum

Post a new message
Dataseries X:
111,4
117
141,7
120
132,1
146,7
122,5
99,6
122,7
139
117,8
125,5
134,5
121,3
126,7
117,7
123
132,1
113,1
89,2
121,7
105,3
85,3
105,3
72,2
92,1
97,2
78,6
78,1
93
81
65,9
88,6
85,7
76,3
96,8
76,8
85,6
119,2
91,4
95,7
112,3
95,2
82,8
111,3
108,2
97
124,4
99,3
117,6
131,5
114,2
116,8
116,5
105,4
89,2
115,8
111,4
106,4
128,4
107,7
111
129,8
130,5
142,9
159,9
84,1
75
100,7
106,8
97,4
113
76,9
87,3
103,7
92,1
92,9
112,2
88,7
74,6
101,5
119,7
120,7
153,5


Summary of computational transaction
Raw Inputview raw input (R code)
Raw Outputview raw output of R engine
Computing time3 seconds
R Server'Herman Ole Andreas Wold' @ wold.wessa.net

\begin{tabular}{lllllllll}
\hline
Summary of computational transaction \tabularnewline
Raw Input & view raw input (R code)  \tabularnewline
Raw Output & view raw output of R engine  \tabularnewline
Computing time & 3 seconds \tabularnewline
R Server & 'Herman Ole Andreas Wold' @ wold.wessa.net \tabularnewline
\hline
\end{tabular}
%Source: https://freestatistics.org/blog/index.php?pk=271571&T=0

[TABLE]
[ROW][C]Summary of computational transaction[/C][/ROW]
[ROW][C]Raw Input[/C][C]view raw input (R code) [/C][/ROW]
[ROW][C]Raw Output[/C][C]view raw output of R engine [/C][/ROW]
[ROW][C]Computing time[/C][C]3 seconds[/C][/ROW]
[ROW][C]R Server[/C][C]'Herman Ole Andreas Wold' @ wold.wessa.net[/C][/ROW]
[/TABLE]
Source: https://freestatistics.org/blog/index.php?pk=271571&T=0

Globally Unique Identifier (entire table): ba.freestatistics.org/blog/index.php?pk=271571&T=0

As an alternative you can also use a QR Code:  

The GUIDs for individual cells are displayed in the table below:

Summary of computational transaction
Raw Inputview raw input (R code)
Raw Outputview raw output of R engine
Computing time3 seconds
R Server'Herman Ole Andreas Wold' @ wold.wessa.net


Central Tendency - Ungrouped Data
MeasureValueS.E.Value/S.E.
Arithmetic Mean107.2821428571432.2149424492939148.4356344749917
Geometric Mean105.360251521607
Harmonic Mean103.418069963299
Quadratic Mean109.163426524071
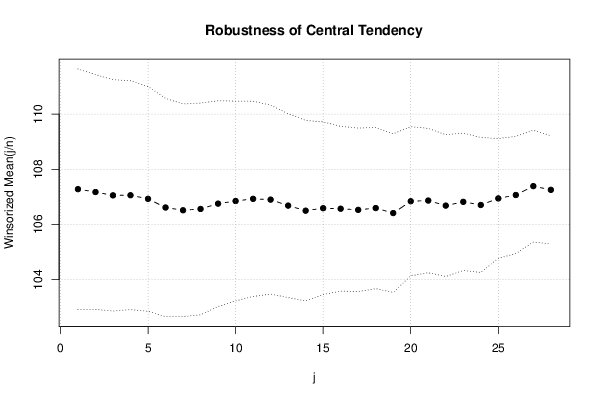
Winsorized Mean ( 1 / 28 )107.2809523809522.1785657697069549.2438437584482
Winsorized Mean ( 2 / 28 )107.176190476192.128923174136650.3429112793874
Winsorized Mean ( 3 / 28 )107.0547619047622.0971296975475651.0482313182416
Winsorized Mean ( 4 / 28 )107.0595238095242.0742652578349851.6132270957802
Winsorized Mean ( 5 / 28 )106.9285714285712.0375396693733752.4792587039331
Winsorized Mean ( 6 / 28 )106.6142857142861.9784402652403653.8880488773985
Winsorized Mean ( 7 / 28 )106.5142857142861.927522929534655.2596724439504
Winsorized Mean ( 8 / 28 )106.5619047619051.9191144573791955.5266020492751
Winsorized Mean ( 9 / 28 )106.7547619047621.8648416961803257.2460183207097
Winsorized Mean ( 10 / 28 )106.851.810976841350659.0013066761874
Winsorized Mean ( 11 / 28 )106.9285714285711.7697760322502760.4192674553354
Winsorized Mean ( 12 / 28 )106.91.7127244755324162.4151762453031
Winsorized Mean ( 13 / 28 )106.6833333333331.6667178706993964.0080335183344
Winsorized Mean ( 14 / 28 )106.51.6357023226594265.1096464953637
Winsorized Mean ( 15 / 28 )106.5892857142861.5653768000926668.0917755443777
Winsorized Mean ( 16 / 28 )106.5702380952381.4930627300995671.3769327616475
Winsorized Mean ( 17 / 28 )106.5297619047621.4821134564037971.876927805005
Winsorized Mean ( 18 / 28 )106.5940476190481.461036648129972.9578192001455
Winsorized Mean ( 19 / 28 )106.4130952380951.4375753912849174.0226188366949
Winsorized Mean ( 20 / 28 )106.8416666666671.3514470351204779.0572356075671
Winsorized Mean ( 21 / 28 )106.8666666666671.3082764622155881.6850793796956
Winsorized Mean ( 22 / 28 )106.6833333333331.2851526843411483.0121857373134
Winsorized Mean ( 23 / 28 )106.8202380952381.2451774784525385.7871588136909
Winsorized Mean ( 24 / 28 )106.7059523809521.223635741069687.2040173390811
Winsorized Mean ( 25 / 28 )106.9440476190481.0859549696861898.4792653510787
Winsorized Mean ( 26 / 28 )107.0678571428571.06216305880726100.801714251941
Winsorized Mean ( 27 / 28 )107.3892857142861.01320458348228105.989735404867
Winsorized Mean ( 28 / 28 )107.2559523809520.980691899239956109.367633671775
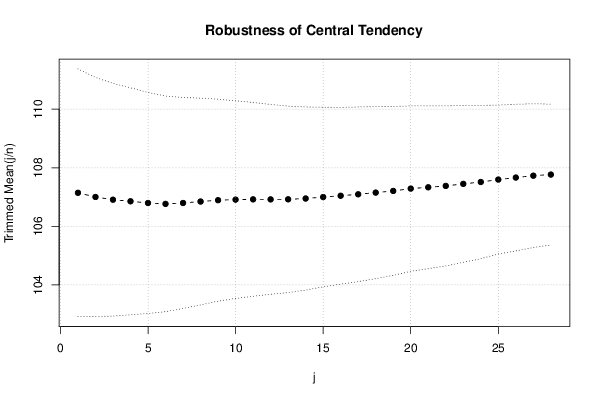
Trimmed Mean ( 1 / 28 )107.145121951222.1153773413064450.6505954559614
Trimmed Mean ( 2 / 28 )107.00252.0418950423378952.4035260291765
Trimmed Mean ( 3 / 28 )106.9089743589741.9874608471713553.7917385950682
Trimmed Mean ( 4 / 28 )106.8552631578951.9380740980682255.1347666554147
Trimmed Mean ( 5 / 28 )106.7972972972971.8883065142979156.5571831101825
Trimmed Mean ( 6 / 28 )106.7666666666671.840946633404257.9955250898492
Trimmed Mean ( 7 / 28 )106.7971428571431.8008382812546459.304127399345
Trimmed Mean ( 8 / 28 )106.8470588235291.7654280056033360.5219009126429
Trimmed Mean ( 9 / 28 )106.8924242424241.7249104711148361.9698390336389
Trimmed Mean ( 10 / 28 )106.91251.6879687767461363.3379606737117
Trimmed Mean ( 11 / 28 )106.9209677419351.6543088892626664.6318039127451
Trimmed Mean ( 12 / 28 )106.921.6213700003287765.9442323333476
Trimmed Mean ( 13 / 28 )106.9224137931031.591842565455867.1689626307284
Trimmed Mean ( 14 / 28 )106.951.5637367832447868.3938634340219
Trimmed Mean ( 15 / 28 )1071.5341033523649169.7475824135665
Trimmed Mean ( 16 / 28 )107.0442307692311.5097331615775570.9027485740446
Trimmed Mean ( 17 / 28 )107.0941.4914433770474771.8056090148108
Trimmed Mean ( 18 / 28 )107.1520833333331.4689064224335272.9468410627656
Trimmed Mean ( 19 / 28 )107.2086956521741.4429164845951774.3000005868341
Trimmed Mean ( 20 / 28 )107.2886363636361.4125614952621975.9532499813198
Trimmed Mean ( 21 / 28 )107.3333333333331.3898406340291177.2270796416252
Trimmed Mean ( 22 / 28 )107.381.3670818631350678.5468689883362
Trimmed Mean ( 23 / 28 )107.451.3394588725017980.2189617060129
Trimmed Mean ( 24 / 28 )107.5138888888891.3095082851412682.1024884751231
Trimmed Mean ( 25 / 28 )107.5970588235291.2712401155044284.6394457752267
Trimmed Mean ( 26 / 28 )107.6656251.2521240773745785.9863866093454
Trimmed Mean ( 27 / 28 )107.731.2276896346717587.7501910560675
Trimmed Mean ( 28 / 28 )107.7678571428571.203149016040789.5714958879307
Median107.95
Midrange112.9
Midmean - Weighted Average at Xnp106.962790697674
Midmean - Weighted Average at X(n+1)p107.333333333333
Midmean - Empirical Distribution Function106.962790697674
Midmean - Empirical Distribution Function - Averaging107.333333333333
Midmean - Empirical Distribution Function - Interpolation107.333333333333
Midmean - Closest Observation106.962790697674
Midmean - True Basic - Statistics Graphics Toolkit107.333333333333
Midmean - MS Excel (old versions)107.288636363636
Number of observations84

\begin{tabular}{lllllllll}
\hline
Central Tendency - Ungrouped Data \tabularnewline
Measure & Value & S.E. & Value/S.E. \tabularnewline
Arithmetic Mean & 107.282142857143 & 2.21494244929391 & 48.4356344749917 \tabularnewline
Geometric Mean & 105.360251521607 &  &  \tabularnewline
Harmonic Mean & 103.418069963299 &  &  \tabularnewline
Quadratic Mean & 109.163426524071 &  &  \tabularnewline
Winsorized Mean ( 1 / 28 ) & 107.280952380952 & 2.17856576970695 & 49.2438437584482 \tabularnewline
Winsorized Mean ( 2 / 28 ) & 107.17619047619 & 2.1289231741366 & 50.3429112793874 \tabularnewline
Winsorized Mean ( 3 / 28 ) & 107.054761904762 & 2.09712969754756 & 51.0482313182416 \tabularnewline
Winsorized Mean ( 4 / 28 ) & 107.059523809524 & 2.07426525783498 & 51.6132270957802 \tabularnewline
Winsorized Mean ( 5 / 28 ) & 106.928571428571 & 2.03753966937337 & 52.4792587039331 \tabularnewline
Winsorized Mean ( 6 / 28 ) & 106.614285714286 & 1.97844026524036 & 53.8880488773985 \tabularnewline
Winsorized Mean ( 7 / 28 ) & 106.514285714286 & 1.9275229295346 & 55.2596724439504 \tabularnewline
Winsorized Mean ( 8 / 28 ) & 106.561904761905 & 1.91911445737919 & 55.5266020492751 \tabularnewline
Winsorized Mean ( 9 / 28 ) & 106.754761904762 & 1.86484169618032 & 57.2460183207097 \tabularnewline
Winsorized Mean ( 10 / 28 ) & 106.85 & 1.8109768413506 & 59.0013066761874 \tabularnewline
Winsorized Mean ( 11 / 28 ) & 106.928571428571 & 1.76977603225027 & 60.4192674553354 \tabularnewline
Winsorized Mean ( 12 / 28 ) & 106.9 & 1.71272447553241 & 62.4151762453031 \tabularnewline
Winsorized Mean ( 13 / 28 ) & 106.683333333333 & 1.66671787069939 & 64.0080335183344 \tabularnewline
Winsorized Mean ( 14 / 28 ) & 106.5 & 1.63570232265942 & 65.1096464953637 \tabularnewline
Winsorized Mean ( 15 / 28 ) & 106.589285714286 & 1.56537680009266 & 68.0917755443777 \tabularnewline
Winsorized Mean ( 16 / 28 ) & 106.570238095238 & 1.49306273009956 & 71.3769327616475 \tabularnewline
Winsorized Mean ( 17 / 28 ) & 106.529761904762 & 1.48211345640379 & 71.876927805005 \tabularnewline
Winsorized Mean ( 18 / 28 ) & 106.594047619048 & 1.4610366481299 & 72.9578192001455 \tabularnewline
Winsorized Mean ( 19 / 28 ) & 106.413095238095 & 1.43757539128491 & 74.0226188366949 \tabularnewline
Winsorized Mean ( 20 / 28 ) & 106.841666666667 & 1.35144703512047 & 79.0572356075671 \tabularnewline
Winsorized Mean ( 21 / 28 ) & 106.866666666667 & 1.30827646221558 & 81.6850793796956 \tabularnewline
Winsorized Mean ( 22 / 28 ) & 106.683333333333 & 1.28515268434114 & 83.0121857373134 \tabularnewline
Winsorized Mean ( 23 / 28 ) & 106.820238095238 & 1.24517747845253 & 85.7871588136909 \tabularnewline
Winsorized Mean ( 24 / 28 ) & 106.705952380952 & 1.2236357410696 & 87.2040173390811 \tabularnewline
Winsorized Mean ( 25 / 28 ) & 106.944047619048 & 1.08595496968618 & 98.4792653510787 \tabularnewline
Winsorized Mean ( 26 / 28 ) & 107.067857142857 & 1.06216305880726 & 100.801714251941 \tabularnewline
Winsorized Mean ( 27 / 28 ) & 107.389285714286 & 1.01320458348228 & 105.989735404867 \tabularnewline
Winsorized Mean ( 28 / 28 ) & 107.255952380952 & 0.980691899239956 & 109.367633671775 \tabularnewline
Trimmed Mean ( 1 / 28 ) & 107.14512195122 & 2.11537734130644 & 50.6505954559614 \tabularnewline
Trimmed Mean ( 2 / 28 ) & 107.0025 & 2.04189504233789 & 52.4035260291765 \tabularnewline
Trimmed Mean ( 3 / 28 ) & 106.908974358974 & 1.98746084717135 & 53.7917385950682 \tabularnewline
Trimmed Mean ( 4 / 28 ) & 106.855263157895 & 1.93807409806822 & 55.1347666554147 \tabularnewline
Trimmed Mean ( 5 / 28 ) & 106.797297297297 & 1.88830651429791 & 56.5571831101825 \tabularnewline
Trimmed Mean ( 6 / 28 ) & 106.766666666667 & 1.8409466334042 & 57.9955250898492 \tabularnewline
Trimmed Mean ( 7 / 28 ) & 106.797142857143 & 1.80083828125464 & 59.304127399345 \tabularnewline
Trimmed Mean ( 8 / 28 ) & 106.847058823529 & 1.76542800560333 & 60.5219009126429 \tabularnewline
Trimmed Mean ( 9 / 28 ) & 106.892424242424 & 1.72491047111483 & 61.9698390336389 \tabularnewline
Trimmed Mean ( 10 / 28 ) & 106.9125 & 1.68796877674613 & 63.3379606737117 \tabularnewline
Trimmed Mean ( 11 / 28 ) & 106.920967741935 & 1.65430888926266 & 64.6318039127451 \tabularnewline
Trimmed Mean ( 12 / 28 ) & 106.92 & 1.62137000032877 & 65.9442323333476 \tabularnewline
Trimmed Mean ( 13 / 28 ) & 106.922413793103 & 1.5918425654558 & 67.1689626307284 \tabularnewline
Trimmed Mean ( 14 / 28 ) & 106.95 & 1.56373678324478 & 68.3938634340219 \tabularnewline
Trimmed Mean ( 15 / 28 ) & 107 & 1.53410335236491 & 69.7475824135665 \tabularnewline
Trimmed Mean ( 16 / 28 ) & 107.044230769231 & 1.50973316157755 & 70.9027485740446 \tabularnewline
Trimmed Mean ( 17 / 28 ) & 107.094 & 1.49144337704747 & 71.8056090148108 \tabularnewline
Trimmed Mean ( 18 / 28 ) & 107.152083333333 & 1.46890642243352 & 72.9468410627656 \tabularnewline
Trimmed Mean ( 19 / 28 ) & 107.208695652174 & 1.44291648459517 & 74.3000005868341 \tabularnewline
Trimmed Mean ( 20 / 28 ) & 107.288636363636 & 1.41256149526219 & 75.9532499813198 \tabularnewline
Trimmed Mean ( 21 / 28 ) & 107.333333333333 & 1.38984063402911 & 77.2270796416252 \tabularnewline
Trimmed Mean ( 22 / 28 ) & 107.38 & 1.36708186313506 & 78.5468689883362 \tabularnewline
Trimmed Mean ( 23 / 28 ) & 107.45 & 1.33945887250179 & 80.2189617060129 \tabularnewline
Trimmed Mean ( 24 / 28 ) & 107.513888888889 & 1.30950828514126 & 82.1024884751231 \tabularnewline
Trimmed Mean ( 25 / 28 ) & 107.597058823529 & 1.27124011550442 & 84.6394457752267 \tabularnewline
Trimmed Mean ( 26 / 28 ) & 107.665625 & 1.25212407737457 & 85.9863866093454 \tabularnewline
Trimmed Mean ( 27 / 28 ) & 107.73 & 1.22768963467175 & 87.7501910560675 \tabularnewline
Trimmed Mean ( 28 / 28 ) & 107.767857142857 & 1.2031490160407 & 89.5714958879307 \tabularnewline
Median & 107.95 &  &  \tabularnewline
Midrange & 112.9 &  &  \tabularnewline
Midmean - Weighted Average at Xnp & 106.962790697674 &  &  \tabularnewline
Midmean - Weighted Average at X(n+1)p & 107.333333333333 &  &  \tabularnewline
Midmean - Empirical Distribution Function & 106.962790697674 &  &  \tabularnewline
Midmean - Empirical Distribution Function - Averaging & 107.333333333333 &  &  \tabularnewline
Midmean - Empirical Distribution Function - Interpolation & 107.333333333333 &  &  \tabularnewline
Midmean - Closest Observation & 106.962790697674 &  &  \tabularnewline
Midmean - True Basic - Statistics Graphics Toolkit & 107.333333333333 &  &  \tabularnewline
Midmean - MS Excel (old versions) & 107.288636363636 &  &  \tabularnewline
Number of observations & 84 &  &  \tabularnewline
\hline
\end{tabular}
%Source: https://freestatistics.org/blog/index.php?pk=271571&T=1

[TABLE]
[ROW][C]Central Tendency - Ungrouped Data[/C][/ROW]
[ROW][C]Measure[/C][C]Value[/C][C]S.E.[/C][C]Value/S.E.[/C][/ROW]
[ROW][C]Arithmetic Mean[/C][C]107.282142857143[/C][C]2.21494244929391[/C][C]48.4356344749917[/C][/ROW]
[ROW][C]Geometric Mean[/C][C]105.360251521607[/C][C][/C][C][/C][/ROW]
[ROW][C]Harmonic Mean[/C][C]103.418069963299[/C][C][/C][C][/C][/ROW]
[ROW][C]Quadratic Mean[/C][C]109.163426524071[/C][C][/C][C][/C][/ROW]
[ROW][C]Winsorized Mean ( 1 / 28 )[/C][C]107.280952380952[/C][C]2.17856576970695[/C][C]49.2438437584482[/C][/ROW]
[ROW][C]Winsorized Mean ( 2 / 28 )[/C][C]107.17619047619[/C][C]2.1289231741366[/C][C]50.3429112793874[/C][/ROW]
[ROW][C]Winsorized Mean ( 3 / 28 )[/C][C]107.054761904762[/C][C]2.09712969754756[/C][C]51.0482313182416[/C][/ROW]
[ROW][C]Winsorized Mean ( 4 / 28 )[/C][C]107.059523809524[/C][C]2.07426525783498[/C][C]51.6132270957802[/C][/ROW]
[ROW][C]Winsorized Mean ( 5 / 28 )[/C][C]106.928571428571[/C][C]2.03753966937337[/C][C]52.4792587039331[/C][/ROW]
[ROW][C]Winsorized Mean ( 6 / 28 )[/C][C]106.614285714286[/C][C]1.97844026524036[/C][C]53.8880488773985[/C][/ROW]
[ROW][C]Winsorized Mean ( 7 / 28 )[/C][C]106.514285714286[/C][C]1.9275229295346[/C][C]55.2596724439504[/C][/ROW]
[ROW][C]Winsorized Mean ( 8 / 28 )[/C][C]106.561904761905[/C][C]1.91911445737919[/C][C]55.5266020492751[/C][/ROW]
[ROW][C]Winsorized Mean ( 9 / 28 )[/C][C]106.754761904762[/C][C]1.86484169618032[/C][C]57.2460183207097[/C][/ROW]
[ROW][C]Winsorized Mean ( 10 / 28 )[/C][C]106.85[/C][C]1.8109768413506[/C][C]59.0013066761874[/C][/ROW]
[ROW][C]Winsorized Mean ( 11 / 28 )[/C][C]106.928571428571[/C][C]1.76977603225027[/C][C]60.4192674553354[/C][/ROW]
[ROW][C]Winsorized Mean ( 12 / 28 )[/C][C]106.9[/C][C]1.71272447553241[/C][C]62.4151762453031[/C][/ROW]
[ROW][C]Winsorized Mean ( 13 / 28 )[/C][C]106.683333333333[/C][C]1.66671787069939[/C][C]64.0080335183344[/C][/ROW]
[ROW][C]Winsorized Mean ( 14 / 28 )[/C][C]106.5[/C][C]1.63570232265942[/C][C]65.1096464953637[/C][/ROW]
[ROW][C]Winsorized Mean ( 15 / 28 )[/C][C]106.589285714286[/C][C]1.56537680009266[/C][C]68.0917755443777[/C][/ROW]
[ROW][C]Winsorized Mean ( 16 / 28 )[/C][C]106.570238095238[/C][C]1.49306273009956[/C][C]71.3769327616475[/C][/ROW]
[ROW][C]Winsorized Mean ( 17 / 28 )[/C][C]106.529761904762[/C][C]1.48211345640379[/C][C]71.876927805005[/C][/ROW]
[ROW][C]Winsorized Mean ( 18 / 28 )[/C][C]106.594047619048[/C][C]1.4610366481299[/C][C]72.9578192001455[/C][/ROW]
[ROW][C]Winsorized Mean ( 19 / 28 )[/C][C]106.413095238095[/C][C]1.43757539128491[/C][C]74.0226188366949[/C][/ROW]
[ROW][C]Winsorized Mean ( 20 / 28 )[/C][C]106.841666666667[/C][C]1.35144703512047[/C][C]79.0572356075671[/C][/ROW]
[ROW][C]Winsorized Mean ( 21 / 28 )[/C][C]106.866666666667[/C][C]1.30827646221558[/C][C]81.6850793796956[/C][/ROW]
[ROW][C]Winsorized Mean ( 22 / 28 )[/C][C]106.683333333333[/C][C]1.28515268434114[/C][C]83.0121857373134[/C][/ROW]
[ROW][C]Winsorized Mean ( 23 / 28 )[/C][C]106.820238095238[/C][C]1.24517747845253[/C][C]85.7871588136909[/C][/ROW]
[ROW][C]Winsorized Mean ( 24 / 28 )[/C][C]106.705952380952[/C][C]1.2236357410696[/C][C]87.2040173390811[/C][/ROW]
[ROW][C]Winsorized Mean ( 25 / 28 )[/C][C]106.944047619048[/C][C]1.08595496968618[/C][C]98.4792653510787[/C][/ROW]
[ROW][C]Winsorized Mean ( 26 / 28 )[/C][C]107.067857142857[/C][C]1.06216305880726[/C][C]100.801714251941[/C][/ROW]
[ROW][C]Winsorized Mean ( 27 / 28 )[/C][C]107.389285714286[/C][C]1.01320458348228[/C][C]105.989735404867[/C][/ROW]
[ROW][C]Winsorized Mean ( 28 / 28 )[/C][C]107.255952380952[/C][C]0.980691899239956[/C][C]109.367633671775[/C][/ROW]
[ROW][C]Trimmed Mean ( 1 / 28 )[/C][C]107.14512195122[/C][C]2.11537734130644[/C][C]50.6505954559614[/C][/ROW]
[ROW][C]Trimmed Mean ( 2 / 28 )[/C][C]107.0025[/C][C]2.04189504233789[/C][C]52.4035260291765[/C][/ROW]
[ROW][C]Trimmed Mean ( 3 / 28 )[/C][C]106.908974358974[/C][C]1.98746084717135[/C][C]53.7917385950682[/C][/ROW]
[ROW][C]Trimmed Mean ( 4 / 28 )[/C][C]106.855263157895[/C][C]1.93807409806822[/C][C]55.1347666554147[/C][/ROW]
[ROW][C]Trimmed Mean ( 5 / 28 )[/C][C]106.797297297297[/C][C]1.88830651429791[/C][C]56.5571831101825[/C][/ROW]
[ROW][C]Trimmed Mean ( 6 / 28 )[/C][C]106.766666666667[/C][C]1.8409466334042[/C][C]57.9955250898492[/C][/ROW]
[ROW][C]Trimmed Mean ( 7 / 28 )[/C][C]106.797142857143[/C][C]1.80083828125464[/C][C]59.304127399345[/C][/ROW]
[ROW][C]Trimmed Mean ( 8 / 28 )[/C][C]106.847058823529[/C][C]1.76542800560333[/C][C]60.5219009126429[/C][/ROW]
[ROW][C]Trimmed Mean ( 9 / 28 )[/C][C]106.892424242424[/C][C]1.72491047111483[/C][C]61.9698390336389[/C][/ROW]
[ROW][C]Trimmed Mean ( 10 / 28 )[/C][C]106.9125[/C][C]1.68796877674613[/C][C]63.3379606737117[/C][/ROW]
[ROW][C]Trimmed Mean ( 11 / 28 )[/C][C]106.920967741935[/C][C]1.65430888926266[/C][C]64.6318039127451[/C][/ROW]
[ROW][C]Trimmed Mean ( 12 / 28 )[/C][C]106.92[/C][C]1.62137000032877[/C][C]65.9442323333476[/C][/ROW]
[ROW][C]Trimmed Mean ( 13 / 28 )[/C][C]106.922413793103[/C][C]1.5918425654558[/C][C]67.1689626307284[/C][/ROW]
[ROW][C]Trimmed Mean ( 14 / 28 )[/C][C]106.95[/C][C]1.56373678324478[/C][C]68.3938634340219[/C][/ROW]
[ROW][C]Trimmed Mean ( 15 / 28 )[/C][C]107[/C][C]1.53410335236491[/C][C]69.7475824135665[/C][/ROW]
[ROW][C]Trimmed Mean ( 16 / 28 )[/C][C]107.044230769231[/C][C]1.50973316157755[/C][C]70.9027485740446[/C][/ROW]
[ROW][C]Trimmed Mean ( 17 / 28 )[/C][C]107.094[/C][C]1.49144337704747[/C][C]71.8056090148108[/C][/ROW]
[ROW][C]Trimmed Mean ( 18 / 28 )[/C][C]107.152083333333[/C][C]1.46890642243352[/C][C]72.9468410627656[/C][/ROW]
[ROW][C]Trimmed Mean ( 19 / 28 )[/C][C]107.208695652174[/C][C]1.44291648459517[/C][C]74.3000005868341[/C][/ROW]
[ROW][C]Trimmed Mean ( 20 / 28 )[/C][C]107.288636363636[/C][C]1.41256149526219[/C][C]75.9532499813198[/C][/ROW]
[ROW][C]Trimmed Mean ( 21 / 28 )[/C][C]107.333333333333[/C][C]1.38984063402911[/C][C]77.2270796416252[/C][/ROW]
[ROW][C]Trimmed Mean ( 22 / 28 )[/C][C]107.38[/C][C]1.36708186313506[/C][C]78.5468689883362[/C][/ROW]
[ROW][C]Trimmed Mean ( 23 / 28 )[/C][C]107.45[/C][C]1.33945887250179[/C][C]80.2189617060129[/C][/ROW]
[ROW][C]Trimmed Mean ( 24 / 28 )[/C][C]107.513888888889[/C][C]1.30950828514126[/C][C]82.1024884751231[/C][/ROW]
[ROW][C]Trimmed Mean ( 25 / 28 )[/C][C]107.597058823529[/C][C]1.27124011550442[/C][C]84.6394457752267[/C][/ROW]
[ROW][C]Trimmed Mean ( 26 / 28 )[/C][C]107.665625[/C][C]1.25212407737457[/C][C]85.9863866093454[/C][/ROW]
[ROW][C]Trimmed Mean ( 27 / 28 )[/C][C]107.73[/C][C]1.22768963467175[/C][C]87.7501910560675[/C][/ROW]
[ROW][C]Trimmed Mean ( 28 / 28 )[/C][C]107.767857142857[/C][C]1.2031490160407[/C][C]89.5714958879307[/C][/ROW]
[ROW][C]Median[/C][C]107.95[/C][C][/C][C][/C][/ROW]
[ROW][C]Midrange[/C][C]112.9[/C][C][/C][C][/C][/ROW]
[ROW][C]Midmean - Weighted Average at Xnp[/C][C]106.962790697674[/C][C][/C][C][/C][/ROW]
[ROW][C]Midmean - Weighted Average at X(n+1)p[/C][C]107.333333333333[/C][C][/C][C][/C][/ROW]
[ROW][C]Midmean - Empirical Distribution Function[/C][C]106.962790697674[/C][C][/C][C][/C][/ROW]
[ROW][C]Midmean - Empirical Distribution Function - Averaging[/C][C]107.333333333333[/C][C][/C][C][/C][/ROW]
[ROW][C]Midmean - Empirical Distribution Function - Interpolation[/C][C]107.333333333333[/C][C][/C][C][/C][/ROW]
[ROW][C]Midmean - Closest Observation[/C][C]106.962790697674[/C][C][/C][C][/C][/ROW]
[ROW][C]Midmean - True Basic - Statistics Graphics Toolkit[/C][C]107.333333333333[/C][C][/C][C][/C][/ROW]
[ROW][C]Midmean - MS Excel (old versions)[/C][C]107.288636363636[/C][C][/C][C][/C][/ROW]
[ROW][C]Number of observations[/C][C]84[/C][C][/C][C][/C][/ROW]
[/TABLE]
Source: https://freestatistics.org/blog/index.php?pk=271571&T=1

Globally Unique Identifier (entire table): ba.freestatistics.org/blog/index.php?pk=271571&T=1

As an alternative you can also use a QR Code:  

The GUIDs for individual cells are displayed in the table below:

Central Tendency - Ungrouped Data
MeasureValueS.E.Value/S.E.
Arithmetic Mean107.2821428571432.2149424492939148.4356344749917
Geometric Mean105.360251521607
Harmonic Mean103.418069963299
Quadratic Mean109.163426524071
Winsorized Mean ( 1 / 28 )107.2809523809522.1785657697069549.2438437584482
Winsorized Mean ( 2 / 28 )107.176190476192.128923174136650.3429112793874
Winsorized Mean ( 3 / 28 )107.0547619047622.0971296975475651.0482313182416
Winsorized Mean ( 4 / 28 )107.0595238095242.0742652578349851.6132270957802
Winsorized Mean ( 5 / 28 )106.9285714285712.0375396693733752.4792587039331
Winsorized Mean ( 6 / 28 )106.6142857142861.9784402652403653.8880488773985
Winsorized Mean ( 7 / 28 )106.5142857142861.927522929534655.2596724439504
Winsorized Mean ( 8 / 28 )106.5619047619051.9191144573791955.5266020492751
Winsorized Mean ( 9 / 28 )106.7547619047621.8648416961803257.2460183207097
Winsorized Mean ( 10 / 28 )106.851.810976841350659.0013066761874
Winsorized Mean ( 11 / 28 )106.9285714285711.7697760322502760.4192674553354
Winsorized Mean ( 12 / 28 )106.91.7127244755324162.4151762453031
Winsorized Mean ( 13 / 28 )106.6833333333331.6667178706993964.0080335183344
Winsorized Mean ( 14 / 28 )106.51.6357023226594265.1096464953637
Winsorized Mean ( 15 / 28 )106.5892857142861.5653768000926668.0917755443777
Winsorized Mean ( 16 / 28 )106.5702380952381.4930627300995671.3769327616475
Winsorized Mean ( 17 / 28 )106.5297619047621.4821134564037971.876927805005
Winsorized Mean ( 18 / 28 )106.5940476190481.461036648129972.9578192001455
Winsorized Mean ( 19 / 28 )106.4130952380951.4375753912849174.0226188366949
Winsorized Mean ( 20 / 28 )106.8416666666671.3514470351204779.0572356075671
Winsorized Mean ( 21 / 28 )106.8666666666671.3082764622155881.6850793796956
Winsorized Mean ( 22 / 28 )106.6833333333331.2851526843411483.0121857373134
Winsorized Mean ( 23 / 28 )106.8202380952381.2451774784525385.7871588136909
Winsorized Mean ( 24 / 28 )106.7059523809521.223635741069687.2040173390811
Winsorized Mean ( 25 / 28 )106.9440476190481.0859549696861898.4792653510787
Winsorized Mean ( 26 / 28 )107.0678571428571.06216305880726100.801714251941
Winsorized Mean ( 27 / 28 )107.3892857142861.01320458348228105.989735404867
Winsorized Mean ( 28 / 28 )107.2559523809520.980691899239956109.367633671775
Trimmed Mean ( 1 / 28 )107.145121951222.1153773413064450.6505954559614
Trimmed Mean ( 2 / 28 )107.00252.0418950423378952.4035260291765
Trimmed Mean ( 3 / 28 )106.9089743589741.9874608471713553.7917385950682
Trimmed Mean ( 4 / 28 )106.8552631578951.9380740980682255.1347666554147
Trimmed Mean ( 5 / 28 )106.7972972972971.8883065142979156.5571831101825
Trimmed Mean ( 6 / 28 )106.7666666666671.840946633404257.9955250898492
Trimmed Mean ( 7 / 28 )106.7971428571431.8008382812546459.304127399345
Trimmed Mean ( 8 / 28 )106.8470588235291.7654280056033360.5219009126429
Trimmed Mean ( 9 / 28 )106.8924242424241.7249104711148361.9698390336389
Trimmed Mean ( 10 / 28 )106.91251.6879687767461363.3379606737117
Trimmed Mean ( 11 / 28 )106.9209677419351.6543088892626664.6318039127451
Trimmed Mean ( 12 / 28 )106.921.6213700003287765.9442323333476
Trimmed Mean ( 13 / 28 )106.9224137931031.591842565455867.1689626307284
Trimmed Mean ( 14 / 28 )106.951.5637367832447868.3938634340219
Trimmed Mean ( 15 / 28 )1071.5341033523649169.7475824135665
Trimmed Mean ( 16 / 28 )107.0442307692311.5097331615775570.9027485740446
Trimmed Mean ( 17 / 28 )107.0941.4914433770474771.8056090148108
Trimmed Mean ( 18 / 28 )107.1520833333331.4689064224335272.9468410627656
Trimmed Mean ( 19 / 28 )107.2086956521741.4429164845951774.3000005868341
Trimmed Mean ( 20 / 28 )107.2886363636361.4125614952621975.9532499813198
Trimmed Mean ( 21 / 28 )107.3333333333331.3898406340291177.2270796416252
Trimmed Mean ( 22 / 28 )107.381.3670818631350678.5468689883362
Trimmed Mean ( 23 / 28 )107.451.3394588725017980.2189617060129
Trimmed Mean ( 24 / 28 )107.5138888888891.3095082851412682.1024884751231
Trimmed Mean ( 25 / 28 )107.5970588235291.2712401155044284.6394457752267
Trimmed Mean ( 26 / 28 )107.6656251.2521240773745785.9863866093454
Trimmed Mean ( 27 / 28 )107.731.2276896346717587.7501910560675
Trimmed Mean ( 28 / 28 )107.7678571428571.203149016040789.5714958879307
Median107.95
Midrange112.9
Midmean - Weighted Average at Xnp106.962790697674
Midmean - Weighted Average at X(n+1)p107.333333333333
Midmean - Empirical Distribution Function106.962790697674
Midmean - Empirical Distribution Function - Averaging107.333333333333
Midmean - Empirical Distribution Function - Interpolation107.333333333333
Midmean - Closest Observation106.962790697674
Midmean - True Basic - Statistics Graphics Toolkit107.333333333333
Midmean - MS Excel (old versions)107.288636363636
Number of observations84


Parameters (Session):
Parameters (R input):
R code (references can be found in the software module):
geomean <- function(x) {
return(exp(mean(log(x))))
}
harmean <- function(x) {
return(1/mean(1/x))
}
quamean <- function(x) {
return(sqrt(mean(x*x)))
}
winmean <- function(x) {
x <-sort(x[!is.na(x)])
n<-length(x)
denom <- 3
nodenom <- n/denom
if (nodenom>40) denom <- n/40
sqrtn = sqrt(n)
roundnodenom = floor(nodenom)
win <- array(NA,dim=c(roundnodenom,2))
for (j in 1:roundnodenom) {
win[j,1] <- (j*x[j+1]+sum(x[(j+1):(n-j)])+j*x[n-j])/n
win[j,2] <- sd(c(rep(x[j+1],j),x[(j+1):(n-j)],rep(x[n-j],j)))/sqrtn
}
return(win)
}
trimean <- function(x) {
x <-sort(x[!is.na(x)])
n<-length(x)
denom <- 3
nodenom <- n/denom
if (nodenom>40) denom <- n/40
sqrtn = sqrt(n)
roundnodenom = floor(nodenom)
tri <- array(NA,dim=c(roundnodenom,2))
for (j in 1:roundnodenom) {
tri[j,1] <- mean(x,trim=j/n)
tri[j,2] <- sd(x[(j+1):(n-j)]) / sqrt(n-j*2)
}
return(tri)
}
midrange <- function(x) {
return((max(x)+min(x))/2)
}
q1 <- function(data,n,p,i,f) {
np <- n*p;
i <<- floor(np)
f <<- np - i
qvalue <- (1-f)*data[i] + f*data[i+1]
}
q2 <- function(data,n,p,i,f) {
np <- (n+1)*p
i <<- floor(np)
f <<- np - i
qvalue <- (1-f)*data[i] + f*data[i+1]
}
q3 <- function(data,n,p,i,f) {
np <- n*p
i <<- floor(np)
f <<- np - i
if (f==0) {
qvalue <- data[i]
} else {
qvalue <- data[i+1]
}
}
q4 <- function(data,n,p,i,f) {
np <- n*p
i <<- floor(np)
f <<- np - i
if (f==0) {
qvalue <- (data[i]+data[i+1])/2
} else {
qvalue <- data[i+1]
}
}
q5 <- function(data,n,p,i,f) {
np <- (n-1)*p
i <<- floor(np)
f <<- np - i
if (f==0) {
qvalue <- data[i+1]
} else {
qvalue <- data[i+1] + f*(data[i+2]-data[i+1])
}
}
q6 <- function(data,n,p,i,f) {
np <- n*p+0.5
i <<- floor(np)
f <<- np - i
qvalue <- data[i]
}
q7 <- function(data,n,p,i,f) {
np <- (n+1)*p
i <<- floor(np)
f <<- np - i
if (f==0) {
qvalue <- data[i]
} else {
qvalue <- f*data[i] + (1-f)*data[i+1]
}
}
q8 <- function(data,n,p,i,f) {
np <- (n+1)*p
i <<- floor(np)
f <<- np - i
if (f==0) {
qvalue <- data[i]
} else {
if (f == 0.5) {
qvalue <- (data[i]+data[i+1])/2
} else {
if (f < 0.5) {
qvalue <- data[i]
} else {
qvalue <- data[i+1]
}
}
}
}
midmean <- function(x,def) {
x <-sort(x[!is.na(x)])
n<-length(x)
if (def==1) {
qvalue1 <- q1(x,n,0.25,i,f)
qvalue3 <- q1(x,n,0.75,i,f)
}
if (def==2) {
qvalue1 <- q2(x,n,0.25,i,f)
qvalue3 <- q2(x,n,0.75,i,f)
}
if (def==3) {
qvalue1 <- q3(x,n,0.25,i,f)
qvalue3 <- q3(x,n,0.75,i,f)
}
if (def==4) {
qvalue1 <- q4(x,n,0.25,i,f)
qvalue3 <- q4(x,n,0.75,i,f)
}
if (def==5) {
qvalue1 <- q5(x,n,0.25,i,f)
qvalue3 <- q5(x,n,0.75,i,f)
}
if (def==6) {
qvalue1 <- q6(x,n,0.25,i,f)
qvalue3 <- q6(x,n,0.75,i,f)
}
if (def==7) {
qvalue1 <- q7(x,n,0.25,i,f)
qvalue3 <- q7(x,n,0.75,i,f)
}
if (def==8) {
qvalue1 <- q8(x,n,0.25,i,f)
qvalue3 <- q8(x,n,0.75,i,f)
}
midm <- 0
myn <- 0
roundno4 <- round(n/4)
round3no4 <- round(3*n/4)
for (i in 1:n) {
if ((x[i]>=qvalue1) & (x[i]<=qvalue3)){
midm = midm + x[i]
myn = myn + 1
}
}
midm = midm / myn
return(midm)
}
(arm <- mean(x))
sqrtn <- sqrt(length(x))
(armse <- sd(x) / sqrtn)
(armose <- arm / armse)
(geo <- geomean(x))
(har <- harmean(x))
(qua <- quamean(x))
(win <- winmean(x))
(tri <- trimean(x))
(midr <- midrange(x))
midm <- array(NA,dim=8)
for (j in 1:8) midm[j] <- midmean(x,j)
midm
bitmap(file='test1.png')
lb <- win[,1] - 2*win[,2]
ub <- win[,1] + 2*win[,2]
if ((ylimmin == '') | (ylimmax == '')) plot(win[,1],type='b',main=main, xlab='j', pch=19, ylab='Winsorized Mean(j/n)', ylim=c(min(lb),max(ub))) else plot(win[,1],type='l',main=main, xlab='j', pch=19, ylab='Winsorized Mean(j/n)', ylim=c(ylimmin,ylimmax))
lines(ub,lty=3)
lines(lb,lty=3)
grid()
dev.off()
bitmap(file='test2.png')
lb <- tri[,1] - 2*tri[,2]
ub <- tri[,1] + 2*tri[,2]
if ((ylimmin == '') | (ylimmax == '')) plot(tri[,1],type='b',main=main, xlab='j', pch=19, ylab='Trimmed Mean(j/n)', ylim=c(min(lb),max(ub))) else plot(tri[,1],type='l',main=main, xlab='j', pch=19, ylab='Trimmed Mean(j/n)', ylim=c(ylimmin,ylimmax))
lines(ub,lty=3)
lines(lb,lty=3)
grid()
dev.off()
load(file='createtable')
a<-table.start()
a<-table.row.start(a)
a<-table.element(a,'Central Tendency - Ungrouped Data',4,TRUE)
a<-table.row.end(a)
a<-table.row.start(a)
a<-table.element(a,'Measure',header=TRUE)
a<-table.element(a,'Value',header=TRUE)
a<-table.element(a,'S.E.',header=TRUE)
a<-table.element(a,'Value/S.E.',header=TRUE)
a<-table.row.end(a)
a<-table.row.start(a)
a<-table.element(a,hyperlink('arithmetic_mean.htm', 'Arithmetic Mean', 'click to view the definition of the Arithmetic Mean'),header=TRUE)
a<-table.element(a,arm)
a<-table.element(a,hyperlink('arithmetic_mean_standard_error.htm', armse, 'click to view the definition of the Standard Error of the Arithmetic Mean'))
a<-table.element(a,armose)
a<-table.row.end(a)
a<-table.row.start(a)
a<-table.element(a,hyperlink('geometric_mean.htm', 'Geometric Mean', 'click to view the definition of the Geometric Mean'),header=TRUE)
a<-table.element(a,geo)
a<-table.element(a,'')
a<-table.row.end(a)
a<-table.row.start(a)
a<-table.element(a,hyperlink('harmonic_mean.htm', 'Harmonic Mean', 'click to view the definition of the Harmonic Mean'),header=TRUE)
a<-table.element(a,har)
a<-table.element(a,'')
a<-table.row.end(a)
a<-table.row.start(a)
a<-table.element(a,hyperlink('quadratic_mean.htm', 'Quadratic Mean', 'click to view the definition of the Quadratic Mean'),header=TRUE)
a<-table.element(a,qua)
a<-table.element(a,'')
a<-table.row.end(a)
for (j in 1:length(win[,1])) {
a<-table.row.start(a)
mylabel <- paste('Winsorized Mean (',j)
mylabel <- paste(mylabel,'/')
mylabel <- paste(mylabel,length(win[,1]))
mylabel <- paste(mylabel,')')
a<-table.element(a,hyperlink('winsorized_mean.htm', mylabel, 'click to view the definition of the Winsorized Mean'),header=TRUE)
a<-table.element(a,win[j,1])
a<-table.element(a,win[j,2])
a<-table.element(a,win[j,1]/win[j,2])
a<-table.row.end(a)
}
for (j in 1:length(tri[,1])) {
a<-table.row.start(a)
mylabel <- paste('Trimmed Mean (',j)
mylabel <- paste(mylabel,'/')
mylabel <- paste(mylabel,length(tri[,1]))
mylabel <- paste(mylabel,')')
a<-table.element(a,hyperlink('arithmetic_mean.htm', mylabel, 'click to view the definition of the Trimmed Mean'),header=TRUE)
a<-table.element(a,tri[j,1])
a<-table.element(a,tri[j,2])
a<-table.element(a,tri[j,1]/tri[j,2])
a<-table.row.end(a)
}
a<-table.row.start(a)
a<-table.element(a,hyperlink('median_1.htm', 'Median', 'click to view the definition of the Median'),header=TRUE)
a<-table.element(a,median(x))
a<-table.element(a,'')
a<-table.row.end(a)
a<-table.row.start(a)
a<-table.element(a,hyperlink('midrange.htm', 'Midrange', 'click to view the definition of the Midrange'),header=TRUE)
a<-table.element(a,midr)
a<-table.element(a,'')
a<-table.row.end(a)
a<-table.row.start(a)
mymid <- hyperlink('midmean.htm', 'Midmean', 'click to view the definition of the Midmean')
mylabel <- paste(mymid,hyperlink('method_1.htm','Weighted Average at Xnp',''),sep=' - ')
a<-table.element(a,mylabel,header=TRUE)
a<-table.element(a,midm[1])
a<-table.element(a,'')
a<-table.row.end(a)
a<-table.row.start(a)
mymid <- hyperlink('midmean.htm', 'Midmean', 'click to view the definition of the Midmean')
mylabel <- paste(mymid,hyperlink('method_2.htm','Weighted Average at X(n+1)p',''),sep=' - ')
a<-table.element(a,mylabel,header=TRUE)
a<-table.element(a,midm[2])
a<-table.element(a,'')
a<-table.row.end(a)
a<-table.row.start(a)
mymid <- hyperlink('midmean.htm', 'Midmean', 'click to view the definition of the Midmean')
mylabel <- paste(mymid,hyperlink('method_3.htm','Empirical Distribution Function',''),sep=' - ')
a<-table.element(a,mylabel,header=TRUE)
a<-table.element(a,midm[3])
a<-table.element(a,'')
a<-table.row.end(a)
a<-table.row.start(a)
mymid <- hyperlink('midmean.htm', 'Midmean', 'click to view the definition of the Midmean')
mylabel <- paste(mymid,hyperlink('method_4.htm','Empirical Distribution Function - Averaging',''),sep=' - ')
a<-table.element(a,mylabel,header=TRUE)
a<-table.element(a,midm[4])
a<-table.element(a,'')
a<-table.row.end(a)
a<-table.row.start(a)
mymid <- hyperlink('midmean.htm', 'Midmean', 'click to view the definition of the Midmean')
mylabel <- paste(mymid,hyperlink('method_5.htm','Empirical Distribution Function - Interpolation',''),sep=' - ')
a<-table.element(a,mylabel,header=TRUE)
a<-table.element(a,midm[5])
a<-table.element(a,'')
a<-table.row.end(a)
a<-table.row.start(a)
mymid <- hyperlink('midmean.htm', 'Midmean', 'click to view the definition of the Midmean')
mylabel <- paste(mymid,hyperlink('method_6.htm','Closest Observation',''),sep=' - ')
a<-table.element(a,mylabel,header=TRUE)
a<-table.element(a,midm[6])
a<-table.element(a,'')
a<-table.row.end(a)
a<-table.row.start(a)
mymid <- hyperlink('midmean.htm', 'Midmean', 'click to view the definition of the Midmean')
mylabel <- paste(mymid,hyperlink('method_7.htm','True Basic - Statistics Graphics Toolkit',''),sep=' - ')
a<-table.element(a,mylabel,header=TRUE)
a<-table.element(a,midm[7])
a<-table.element(a,'')
a<-table.row.end(a)
a<-table.row.start(a)
mymid <- hyperlink('midmean.htm', 'Midmean', 'click to view the definition of the Midmean')
mylabel <- paste(mymid,hyperlink('method_8.htm','MS Excel (old versions)',''),sep=' - ')
a<-table.element(a,mylabel,header=TRUE)
a<-table.element(a,midm[8])
a<-table.element(a,'')
a<-table.row.end(a)
a<-table.row.start(a)
a<-table.element(a,'Number of observations',header=TRUE)
a<-table.element(a,length(x))
a<-table.element(a,'')
a<-table.row.end(a)
a<-table.end(a)
table.save(a,file='mytable.tab')