Free Statistics

of Irreproducible Research!

Author's title

Author*Unverified author*
R Software Modulerwasp_autocorrelation.wasp
Title produced by software(Partial) Autocorrelation Function
Date of computationMon, 07 Jul 2014 21:40:16 +0100
Cite this page as followsStatistical Computations at FreeStatistics.org, Office for Research Development and Education, URL https://freestatistics.org/blog/index.php?v=date/2014/Jul/07/t1404765678jsjixdpkwgy7jva.htm/, Retrieved Tue, 14 May 2024 02:10:38 +0000
Statistical Computations at FreeStatistics.org, Office for Research Development and Education, URL https://freestatistics.org/blog/index.php?pk=235277, Retrieved Tue, 14 May 2024 02:10:38 +0000
QR Codes:

Original text written by user:
IsPrivate?No (this computation is public)
User-defined keywordsMarashi Michelle
Estimated Impact152
Family? (F = Feedback message, R = changed R code, M = changed R Module, P = changed Parameters, D = changed Data)
-       [(Partial) Autocorrelation Function] [Tijdreeks A- stap 21] [2014-07-07 20:40:16] [039056c9fef9ec579c259569ea14399c] [Current]
Feedback Forum

Post a new message
Dataseries X:
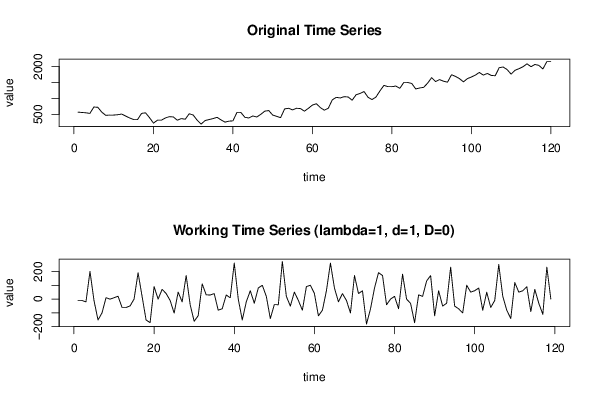
567
557
547
527
729
719
567
466
476
476
486
507
446
385
335
335
527
547
395
223
314
314
385
426
416
314
365
345
517
476
314
193
304
335
365
405
324
254
284
294
557
557
405
385
446
416
497
598
618
476
436
395
669
689
638
689
679
598
689
790
831
709
628
689
952
1033
1013
1053
1043
942
1114
1155
1215
1033
962
1043
1236
1408
1367
1367
1387
1317
1499
1499
1468
1296
1327
1347
1479
1651
1529
1590
1539
1509
1742
1691
1620
1519
1620
1671
1732
1813
1732
1782
1721
1711
1964
1985
1904
1762
1883
1934
1995
2086
1995
2066
2035
1924
2157
2157


Summary of computational transaction
Raw Inputview raw input (R code)
Raw Outputview raw output of R engine
Computing time2 seconds
R Server'George Udny Yule' @ yule.wessa.net

\begin{tabular}{lllllllll}
\hline
Summary of computational transaction \tabularnewline
Raw Input & view raw input (R code)  \tabularnewline
Raw Output & view raw output of R engine  \tabularnewline
Computing time & 2 seconds \tabularnewline
R Server & 'George Udny Yule' @ yule.wessa.net \tabularnewline
\hline
\end{tabular}
%Source: https://freestatistics.org/blog/index.php?pk=235277&T=0

[TABLE]
[ROW][C]Summary of computational transaction[/C][/ROW]
[ROW][C]Raw Input[/C][C]view raw input (R code) [/C][/ROW]
[ROW][C]Raw Output[/C][C]view raw output of R engine [/C][/ROW]
[ROW][C]Computing time[/C][C]2 seconds[/C][/ROW]
[ROW][C]R Server[/C][C]'George Udny Yule' @ yule.wessa.net[/C][/ROW]
[/TABLE]
Source: https://freestatistics.org/blog/index.php?pk=235277&T=0

Globally Unique Identifier (entire table): ba.freestatistics.org/blog/index.php?pk=235277&T=0

As an alternative you can also use a QR Code:  

The GUIDs for individual cells are displayed in the table below:

Summary of computational transaction
Raw Inputview raw input (R code)
Raw Outputview raw output of R engine
Computing time2 seconds
R Server'George Udny Yule' @ yule.wessa.net


Autocorrelation Function
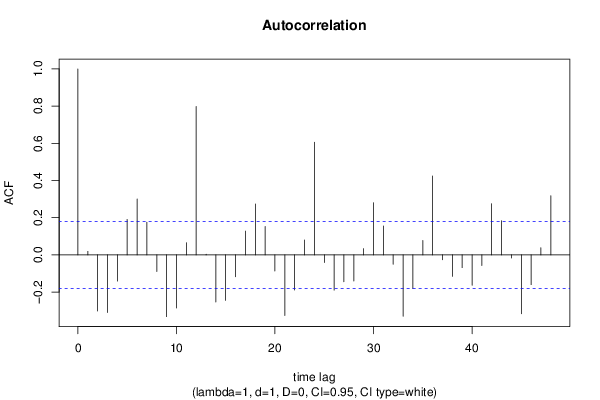
Time lag kACF(k)T-STATP-value
10.0188250.20540.418824
2-0.301986-3.29430.00065
3-0.309541-3.37670.000496
4-0.140978-1.53790.063365
50.1908532.0820.019745
60.3008833.28230.000676
70.1759221.91910.028684
8-0.089054-0.97150.166643
9-0.332194-3.62380.000214
10-0.286096-3.12090.001131
110.0651780.7110.239236
120.7980758.7060
130.0037120.04050.483884
14-0.253147-2.76150.003333
15-0.244845-2.67090.004311
16-0.117962-1.28680.100329
170.127751.39360.08302
180.2737782.98660.001713
190.1524751.66330.049442
20-0.087003-0.94910.172248
21-0.325826-3.55430.000272
22-0.188698-2.05840.020865
230.079860.87120.192708
240.6056286.60660
25-0.041276-0.45030.326667
26-0.189778-2.07020.020297
27-0.144881-1.58050.058327
28-0.140591-1.53370.063883
290.0336560.36710.357081
300.2807543.06270.001357
310.155531.69660.04619
32-0.050006-0.54550.293214
33-0.330127-3.60130.000232
34-0.180608-1.97020.025569
350.0772940.84320.20041
360.4243894.62955e-06
37-0.026067-0.28440.388316
38-0.115765-1.26290.104556
39-0.06878-0.75030.227276
40-0.163475-1.78330.038543
41-0.056742-0.6190.268556
420.2749972.99990.001645
430.1834632.00130.023815
44-0.016868-0.1840.427161
45-0.316542-3.45310.000384
46-0.159936-1.74470.04181
470.0381710.41640.338934
480.3176523.46520.000369

\begin{tabular}{lllllllll}
\hline
Autocorrelation Function \tabularnewline
Time lag k & ACF(k) & T-STAT & P-value \tabularnewline
1 & 0.018825 & 0.2054 & 0.418824 \tabularnewline
2 & -0.301986 & -3.2943 & 0.00065 \tabularnewline
3 & -0.309541 & -3.3767 & 0.000496 \tabularnewline
4 & -0.140978 & -1.5379 & 0.063365 \tabularnewline
5 & 0.190853 & 2.082 & 0.019745 \tabularnewline
6 & 0.300883 & 3.2823 & 0.000676 \tabularnewline
7 & 0.175922 & 1.9191 & 0.028684 \tabularnewline
8 & -0.089054 & -0.9715 & 0.166643 \tabularnewline
9 & -0.332194 & -3.6238 & 0.000214 \tabularnewline
10 & -0.286096 & -3.1209 & 0.001131 \tabularnewline
11 & 0.065178 & 0.711 & 0.239236 \tabularnewline
12 & 0.798075 & 8.706 & 0 \tabularnewline
13 & 0.003712 & 0.0405 & 0.483884 \tabularnewline
14 & -0.253147 & -2.7615 & 0.003333 \tabularnewline
15 & -0.244845 & -2.6709 & 0.004311 \tabularnewline
16 & -0.117962 & -1.2868 & 0.100329 \tabularnewline
17 & 0.12775 & 1.3936 & 0.08302 \tabularnewline
18 & 0.273778 & 2.9866 & 0.001713 \tabularnewline
19 & 0.152475 & 1.6633 & 0.049442 \tabularnewline
20 & -0.087003 & -0.9491 & 0.172248 \tabularnewline
21 & -0.325826 & -3.5543 & 0.000272 \tabularnewline
22 & -0.188698 & -2.0584 & 0.020865 \tabularnewline
23 & 0.07986 & 0.8712 & 0.192708 \tabularnewline
24 & 0.605628 & 6.6066 & 0 \tabularnewline
25 & -0.041276 & -0.4503 & 0.326667 \tabularnewline
26 & -0.189778 & -2.0702 & 0.020297 \tabularnewline
27 & -0.144881 & -1.5805 & 0.058327 \tabularnewline
28 & -0.140591 & -1.5337 & 0.063883 \tabularnewline
29 & 0.033656 & 0.3671 & 0.357081 \tabularnewline
30 & 0.280754 & 3.0627 & 0.001357 \tabularnewline
31 & 0.15553 & 1.6966 & 0.04619 \tabularnewline
32 & -0.050006 & -0.5455 & 0.293214 \tabularnewline
33 & -0.330127 & -3.6013 & 0.000232 \tabularnewline
34 & -0.180608 & -1.9702 & 0.025569 \tabularnewline
35 & 0.077294 & 0.8432 & 0.20041 \tabularnewline
36 & 0.424389 & 4.6295 & 5e-06 \tabularnewline
37 & -0.026067 & -0.2844 & 0.388316 \tabularnewline
38 & -0.115765 & -1.2629 & 0.104556 \tabularnewline
39 & -0.06878 & -0.7503 & 0.227276 \tabularnewline
40 & -0.163475 & -1.7833 & 0.038543 \tabularnewline
41 & -0.056742 & -0.619 & 0.268556 \tabularnewline
42 & 0.274997 & 2.9999 & 0.001645 \tabularnewline
43 & 0.183463 & 2.0013 & 0.023815 \tabularnewline
44 & -0.016868 & -0.184 & 0.427161 \tabularnewline
45 & -0.316542 & -3.4531 & 0.000384 \tabularnewline
46 & -0.159936 & -1.7447 & 0.04181 \tabularnewline
47 & 0.038171 & 0.4164 & 0.338934 \tabularnewline
48 & 0.317652 & 3.4652 & 0.000369 \tabularnewline
\hline
\end{tabular}
%Source: https://freestatistics.org/blog/index.php?pk=235277&T=1

[TABLE]
[ROW][C]Autocorrelation Function[/C][/ROW]
[ROW][C]Time lag k[/C][C]ACF(k)[/C][C]T-STAT[/C][C]P-value[/C][/ROW]
[ROW][C]1[/C][C]0.018825[/C][C]0.2054[/C][C]0.418824[/C][/ROW]
[ROW][C]2[/C][C]-0.301986[/C][C]-3.2943[/C][C]0.00065[/C][/ROW]
[ROW][C]3[/C][C]-0.309541[/C][C]-3.3767[/C][C]0.000496[/C][/ROW]
[ROW][C]4[/C][C]-0.140978[/C][C]-1.5379[/C][C]0.063365[/C][/ROW]
[ROW][C]5[/C][C]0.190853[/C][C]2.082[/C][C]0.019745[/C][/ROW]
[ROW][C]6[/C][C]0.300883[/C][C]3.2823[/C][C]0.000676[/C][/ROW]
[ROW][C]7[/C][C]0.175922[/C][C]1.9191[/C][C]0.028684[/C][/ROW]
[ROW][C]8[/C][C]-0.089054[/C][C]-0.9715[/C][C]0.166643[/C][/ROW]
[ROW][C]9[/C][C]-0.332194[/C][C]-3.6238[/C][C]0.000214[/C][/ROW]
[ROW][C]10[/C][C]-0.286096[/C][C]-3.1209[/C][C]0.001131[/C][/ROW]
[ROW][C]11[/C][C]0.065178[/C][C]0.711[/C][C]0.239236[/C][/ROW]
[ROW][C]12[/C][C]0.798075[/C][C]8.706[/C][C]0[/C][/ROW]
[ROW][C]13[/C][C]0.003712[/C][C]0.0405[/C][C]0.483884[/C][/ROW]
[ROW][C]14[/C][C]-0.253147[/C][C]-2.7615[/C][C]0.003333[/C][/ROW]
[ROW][C]15[/C][C]-0.244845[/C][C]-2.6709[/C][C]0.004311[/C][/ROW]
[ROW][C]16[/C][C]-0.117962[/C][C]-1.2868[/C][C]0.100329[/C][/ROW]
[ROW][C]17[/C][C]0.12775[/C][C]1.3936[/C][C]0.08302[/C][/ROW]
[ROW][C]18[/C][C]0.273778[/C][C]2.9866[/C][C]0.001713[/C][/ROW]
[ROW][C]19[/C][C]0.152475[/C][C]1.6633[/C][C]0.049442[/C][/ROW]
[ROW][C]20[/C][C]-0.087003[/C][C]-0.9491[/C][C]0.172248[/C][/ROW]
[ROW][C]21[/C][C]-0.325826[/C][C]-3.5543[/C][C]0.000272[/C][/ROW]
[ROW][C]22[/C][C]-0.188698[/C][C]-2.0584[/C][C]0.020865[/C][/ROW]
[ROW][C]23[/C][C]0.07986[/C][C]0.8712[/C][C]0.192708[/C][/ROW]
[ROW][C]24[/C][C]0.605628[/C][C]6.6066[/C][C]0[/C][/ROW]
[ROW][C]25[/C][C]-0.041276[/C][C]-0.4503[/C][C]0.326667[/C][/ROW]
[ROW][C]26[/C][C]-0.189778[/C][C]-2.0702[/C][C]0.020297[/C][/ROW]
[ROW][C]27[/C][C]-0.144881[/C][C]-1.5805[/C][C]0.058327[/C][/ROW]
[ROW][C]28[/C][C]-0.140591[/C][C]-1.5337[/C][C]0.063883[/C][/ROW]
[ROW][C]29[/C][C]0.033656[/C][C]0.3671[/C][C]0.357081[/C][/ROW]
[ROW][C]30[/C][C]0.280754[/C][C]3.0627[/C][C]0.001357[/C][/ROW]
[ROW][C]31[/C][C]0.15553[/C][C]1.6966[/C][C]0.04619[/C][/ROW]
[ROW][C]32[/C][C]-0.050006[/C][C]-0.5455[/C][C]0.293214[/C][/ROW]
[ROW][C]33[/C][C]-0.330127[/C][C]-3.6013[/C][C]0.000232[/C][/ROW]
[ROW][C]34[/C][C]-0.180608[/C][C]-1.9702[/C][C]0.025569[/C][/ROW]
[ROW][C]35[/C][C]0.077294[/C][C]0.8432[/C][C]0.20041[/C][/ROW]
[ROW][C]36[/C][C]0.424389[/C][C]4.6295[/C][C]5e-06[/C][/ROW]
[ROW][C]37[/C][C]-0.026067[/C][C]-0.2844[/C][C]0.388316[/C][/ROW]
[ROW][C]38[/C][C]-0.115765[/C][C]-1.2629[/C][C]0.104556[/C][/ROW]
[ROW][C]39[/C][C]-0.06878[/C][C]-0.7503[/C][C]0.227276[/C][/ROW]
[ROW][C]40[/C][C]-0.163475[/C][C]-1.7833[/C][C]0.038543[/C][/ROW]
[ROW][C]41[/C][C]-0.056742[/C][C]-0.619[/C][C]0.268556[/C][/ROW]
[ROW][C]42[/C][C]0.274997[/C][C]2.9999[/C][C]0.001645[/C][/ROW]
[ROW][C]43[/C][C]0.183463[/C][C]2.0013[/C][C]0.023815[/C][/ROW]
[ROW][C]44[/C][C]-0.016868[/C][C]-0.184[/C][C]0.427161[/C][/ROW]
[ROW][C]45[/C][C]-0.316542[/C][C]-3.4531[/C][C]0.000384[/C][/ROW]
[ROW][C]46[/C][C]-0.159936[/C][C]-1.7447[/C][C]0.04181[/C][/ROW]
[ROW][C]47[/C][C]0.038171[/C][C]0.4164[/C][C]0.338934[/C][/ROW]
[ROW][C]48[/C][C]0.317652[/C][C]3.4652[/C][C]0.000369[/C][/ROW]
[/TABLE]
Source: https://freestatistics.org/blog/index.php?pk=235277&T=1

Globally Unique Identifier (entire table): ba.freestatistics.org/blog/index.php?pk=235277&T=1

As an alternative you can also use a QR Code:  

The GUIDs for individual cells are displayed in the table below:

Autocorrelation Function
Time lag kACF(k)T-STATP-value
10.0188250.20540.418824
2-0.301986-3.29430.00065
3-0.309541-3.37670.000496
4-0.140978-1.53790.063365
50.1908532.0820.019745
60.3008833.28230.000676
70.1759221.91910.028684
8-0.089054-0.97150.166643
9-0.332194-3.62380.000214
10-0.286096-3.12090.001131
110.0651780.7110.239236
120.7980758.7060
130.0037120.04050.483884
14-0.253147-2.76150.003333
15-0.244845-2.67090.004311
16-0.117962-1.28680.100329
170.127751.39360.08302
180.2737782.98660.001713
190.1524751.66330.049442
20-0.087003-0.94910.172248
21-0.325826-3.55430.000272
22-0.188698-2.05840.020865
230.079860.87120.192708
240.6056286.60660
25-0.041276-0.45030.326667
26-0.189778-2.07020.020297
27-0.144881-1.58050.058327
28-0.140591-1.53370.063883
290.0336560.36710.357081
300.2807543.06270.001357
310.155531.69660.04619
32-0.050006-0.54550.293214
33-0.330127-3.60130.000232
34-0.180608-1.97020.025569
350.0772940.84320.20041
360.4243894.62955e-06
37-0.026067-0.28440.388316
38-0.115765-1.26290.104556
39-0.06878-0.75030.227276
40-0.163475-1.78330.038543
41-0.056742-0.6190.268556
420.2749972.99990.001645
430.1834632.00130.023815
44-0.016868-0.1840.427161
45-0.316542-3.45310.000384
46-0.159936-1.74470.04181
470.0381710.41640.338934
480.3176523.46520.000369


Partial Autocorrelation Function
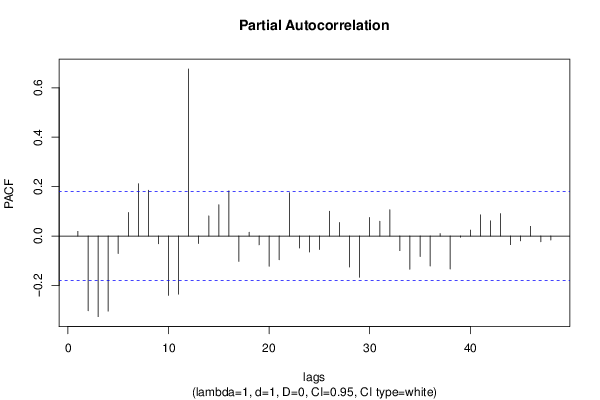
Time lag kPACF(k)T-STATP-value
10.0188250.20540.418824
2-0.302448-3.29930.000639
3-0.326407-3.56070.000266
4-0.304053-3.31680.000604
5-0.070767-0.7720.220829
60.0953331.040.150233
70.2112882.30490.011453
80.1850872.01910.022864
9-0.031077-0.3390.367602
10-0.24032-2.62160.004948
11-0.235229-2.5660.005764
120.6762537.37710
13-0.030331-0.33090.370662
140.081410.88810.188146
150.1266111.38120.084909
160.1827931.9940.024217
17-0.102701-1.12030.132415
180.0153020.16690.433858
19-0.03577-0.39020.348542
20-0.122721-1.33870.091605
21-0.096017-1.04740.148513
220.1755091.91460.028974
23-0.048413-0.52810.299199
24-0.064577-0.70450.241264
25-0.054911-0.5990.275153
260.1005011.09630.137573
270.0547470.59720.275747
28-0.125445-1.36840.086876
29-0.166637-1.81780.035805
300.0749030.81710.207752
310.0598570.6530.257521
320.1060551.15690.124811
33-0.059087-0.64460.260227
34-0.134807-1.47060.072023
35-0.082886-0.90420.183862
36-0.121528-1.32570.093737
370.0098060.1070.457494
38-0.133604-1.45740.073814
39-0.005208-0.05680.477394
400.0239610.26140.397124
410.0856990.93490.175874
420.0613540.66930.252303
430.0906210.98860.162442
44-0.034846-0.38010.352267
45-0.019588-0.21370.415582
460.0389870.42530.335695
47-0.023295-0.25410.399923
48-0.016509-0.18010.428694

\begin{tabular}{lllllllll}
\hline
Partial Autocorrelation Function \tabularnewline
Time lag k & PACF(k) & T-STAT & P-value \tabularnewline
1 & 0.018825 & 0.2054 & 0.418824 \tabularnewline
2 & -0.302448 & -3.2993 & 0.000639 \tabularnewline
3 & -0.326407 & -3.5607 & 0.000266 \tabularnewline
4 & -0.304053 & -3.3168 & 0.000604 \tabularnewline
5 & -0.070767 & -0.772 & 0.220829 \tabularnewline
6 & 0.095333 & 1.04 & 0.150233 \tabularnewline
7 & 0.211288 & 2.3049 & 0.011453 \tabularnewline
8 & 0.185087 & 2.0191 & 0.022864 \tabularnewline
9 & -0.031077 & -0.339 & 0.367602 \tabularnewline
10 & -0.24032 & -2.6216 & 0.004948 \tabularnewline
11 & -0.235229 & -2.566 & 0.005764 \tabularnewline
12 & 0.676253 & 7.3771 & 0 \tabularnewline
13 & -0.030331 & -0.3309 & 0.370662 \tabularnewline
14 & 0.08141 & 0.8881 & 0.188146 \tabularnewline
15 & 0.126611 & 1.3812 & 0.084909 \tabularnewline
16 & 0.182793 & 1.994 & 0.024217 \tabularnewline
17 & -0.102701 & -1.1203 & 0.132415 \tabularnewline
18 & 0.015302 & 0.1669 & 0.433858 \tabularnewline
19 & -0.03577 & -0.3902 & 0.348542 \tabularnewline
20 & -0.122721 & -1.3387 & 0.091605 \tabularnewline
21 & -0.096017 & -1.0474 & 0.148513 \tabularnewline
22 & 0.175509 & 1.9146 & 0.028974 \tabularnewline
23 & -0.048413 & -0.5281 & 0.299199 \tabularnewline
24 & -0.064577 & -0.7045 & 0.241264 \tabularnewline
25 & -0.054911 & -0.599 & 0.275153 \tabularnewline
26 & 0.100501 & 1.0963 & 0.137573 \tabularnewline
27 & 0.054747 & 0.5972 & 0.275747 \tabularnewline
28 & -0.125445 & -1.3684 & 0.086876 \tabularnewline
29 & -0.166637 & -1.8178 & 0.035805 \tabularnewline
30 & 0.074903 & 0.8171 & 0.207752 \tabularnewline
31 & 0.059857 & 0.653 & 0.257521 \tabularnewline
32 & 0.106055 & 1.1569 & 0.124811 \tabularnewline
33 & -0.059087 & -0.6446 & 0.260227 \tabularnewline
34 & -0.134807 & -1.4706 & 0.072023 \tabularnewline
35 & -0.082886 & -0.9042 & 0.183862 \tabularnewline
36 & -0.121528 & -1.3257 & 0.093737 \tabularnewline
37 & 0.009806 & 0.107 & 0.457494 \tabularnewline
38 & -0.133604 & -1.4574 & 0.073814 \tabularnewline
39 & -0.005208 & -0.0568 & 0.477394 \tabularnewline
40 & 0.023961 & 0.2614 & 0.397124 \tabularnewline
41 & 0.085699 & 0.9349 & 0.175874 \tabularnewline
42 & 0.061354 & 0.6693 & 0.252303 \tabularnewline
43 & 0.090621 & 0.9886 & 0.162442 \tabularnewline
44 & -0.034846 & -0.3801 & 0.352267 \tabularnewline
45 & -0.019588 & -0.2137 & 0.415582 \tabularnewline
46 & 0.038987 & 0.4253 & 0.335695 \tabularnewline
47 & -0.023295 & -0.2541 & 0.399923 \tabularnewline
48 & -0.016509 & -0.1801 & 0.428694 \tabularnewline
\hline
\end{tabular}
%Source: https://freestatistics.org/blog/index.php?pk=235277&T=2

[TABLE]
[ROW][C]Partial Autocorrelation Function[/C][/ROW]
[ROW][C]Time lag k[/C][C]PACF(k)[/C][C]T-STAT[/C][C]P-value[/C][/ROW]
[ROW][C]1[/C][C]0.018825[/C][C]0.2054[/C][C]0.418824[/C][/ROW]
[ROW][C]2[/C][C]-0.302448[/C][C]-3.2993[/C][C]0.000639[/C][/ROW]
[ROW][C]3[/C][C]-0.326407[/C][C]-3.5607[/C][C]0.000266[/C][/ROW]
[ROW][C]4[/C][C]-0.304053[/C][C]-3.3168[/C][C]0.000604[/C][/ROW]
[ROW][C]5[/C][C]-0.070767[/C][C]-0.772[/C][C]0.220829[/C][/ROW]
[ROW][C]6[/C][C]0.095333[/C][C]1.04[/C][C]0.150233[/C][/ROW]
[ROW][C]7[/C][C]0.211288[/C][C]2.3049[/C][C]0.011453[/C][/ROW]
[ROW][C]8[/C][C]0.185087[/C][C]2.0191[/C][C]0.022864[/C][/ROW]
[ROW][C]9[/C][C]-0.031077[/C][C]-0.339[/C][C]0.367602[/C][/ROW]
[ROW][C]10[/C][C]-0.24032[/C][C]-2.6216[/C][C]0.004948[/C][/ROW]
[ROW][C]11[/C][C]-0.235229[/C][C]-2.566[/C][C]0.005764[/C][/ROW]
[ROW][C]12[/C][C]0.676253[/C][C]7.3771[/C][C]0[/C][/ROW]
[ROW][C]13[/C][C]-0.030331[/C][C]-0.3309[/C][C]0.370662[/C][/ROW]
[ROW][C]14[/C][C]0.08141[/C][C]0.8881[/C][C]0.188146[/C][/ROW]
[ROW][C]15[/C][C]0.126611[/C][C]1.3812[/C][C]0.084909[/C][/ROW]
[ROW][C]16[/C][C]0.182793[/C][C]1.994[/C][C]0.024217[/C][/ROW]
[ROW][C]17[/C][C]-0.102701[/C][C]-1.1203[/C][C]0.132415[/C][/ROW]
[ROW][C]18[/C][C]0.015302[/C][C]0.1669[/C][C]0.433858[/C][/ROW]
[ROW][C]19[/C][C]-0.03577[/C][C]-0.3902[/C][C]0.348542[/C][/ROW]
[ROW][C]20[/C][C]-0.122721[/C][C]-1.3387[/C][C]0.091605[/C][/ROW]
[ROW][C]21[/C][C]-0.096017[/C][C]-1.0474[/C][C]0.148513[/C][/ROW]
[ROW][C]22[/C][C]0.175509[/C][C]1.9146[/C][C]0.028974[/C][/ROW]
[ROW][C]23[/C][C]-0.048413[/C][C]-0.5281[/C][C]0.299199[/C][/ROW]
[ROW][C]24[/C][C]-0.064577[/C][C]-0.7045[/C][C]0.241264[/C][/ROW]
[ROW][C]25[/C][C]-0.054911[/C][C]-0.599[/C][C]0.275153[/C][/ROW]
[ROW][C]26[/C][C]0.100501[/C][C]1.0963[/C][C]0.137573[/C][/ROW]
[ROW][C]27[/C][C]0.054747[/C][C]0.5972[/C][C]0.275747[/C][/ROW]
[ROW][C]28[/C][C]-0.125445[/C][C]-1.3684[/C][C]0.086876[/C][/ROW]
[ROW][C]29[/C][C]-0.166637[/C][C]-1.8178[/C][C]0.035805[/C][/ROW]
[ROW][C]30[/C][C]0.074903[/C][C]0.8171[/C][C]0.207752[/C][/ROW]
[ROW][C]31[/C][C]0.059857[/C][C]0.653[/C][C]0.257521[/C][/ROW]
[ROW][C]32[/C][C]0.106055[/C][C]1.1569[/C][C]0.124811[/C][/ROW]
[ROW][C]33[/C][C]-0.059087[/C][C]-0.6446[/C][C]0.260227[/C][/ROW]
[ROW][C]34[/C][C]-0.134807[/C][C]-1.4706[/C][C]0.072023[/C][/ROW]
[ROW][C]35[/C][C]-0.082886[/C][C]-0.9042[/C][C]0.183862[/C][/ROW]
[ROW][C]36[/C][C]-0.121528[/C][C]-1.3257[/C][C]0.093737[/C][/ROW]
[ROW][C]37[/C][C]0.009806[/C][C]0.107[/C][C]0.457494[/C][/ROW]
[ROW][C]38[/C][C]-0.133604[/C][C]-1.4574[/C][C]0.073814[/C][/ROW]
[ROW][C]39[/C][C]-0.005208[/C][C]-0.0568[/C][C]0.477394[/C][/ROW]
[ROW][C]40[/C][C]0.023961[/C][C]0.2614[/C][C]0.397124[/C][/ROW]
[ROW][C]41[/C][C]0.085699[/C][C]0.9349[/C][C]0.175874[/C][/ROW]
[ROW][C]42[/C][C]0.061354[/C][C]0.6693[/C][C]0.252303[/C][/ROW]
[ROW][C]43[/C][C]0.090621[/C][C]0.9886[/C][C]0.162442[/C][/ROW]
[ROW][C]44[/C][C]-0.034846[/C][C]-0.3801[/C][C]0.352267[/C][/ROW]
[ROW][C]45[/C][C]-0.019588[/C][C]-0.2137[/C][C]0.415582[/C][/ROW]
[ROW][C]46[/C][C]0.038987[/C][C]0.4253[/C][C]0.335695[/C][/ROW]
[ROW][C]47[/C][C]-0.023295[/C][C]-0.2541[/C][C]0.399923[/C][/ROW]
[ROW][C]48[/C][C]-0.016509[/C][C]-0.1801[/C][C]0.428694[/C][/ROW]
[/TABLE]
Source: https://freestatistics.org/blog/index.php?pk=235277&T=2

Globally Unique Identifier (entire table): ba.freestatistics.org/blog/index.php?pk=235277&T=2

As an alternative you can also use a QR Code:  

The GUIDs for individual cells are displayed in the table below:

Partial Autocorrelation Function
Time lag kPACF(k)T-STATP-value
10.0188250.20540.418824
2-0.302448-3.29930.000639
3-0.326407-3.56070.000266
4-0.304053-3.31680.000604
5-0.070767-0.7720.220829
60.0953331.040.150233
70.2112882.30490.011453
80.1850872.01910.022864
9-0.031077-0.3390.367602
10-0.24032-2.62160.004948
11-0.235229-2.5660.005764
120.6762537.37710
13-0.030331-0.33090.370662
140.081410.88810.188146
150.1266111.38120.084909
160.1827931.9940.024217
17-0.102701-1.12030.132415
180.0153020.16690.433858
19-0.03577-0.39020.348542
20-0.122721-1.33870.091605
21-0.096017-1.04740.148513
220.1755091.91460.028974
23-0.048413-0.52810.299199
24-0.064577-0.70450.241264
25-0.054911-0.5990.275153
260.1005011.09630.137573
270.0547470.59720.275747
28-0.125445-1.36840.086876
29-0.166637-1.81780.035805
300.0749030.81710.207752
310.0598570.6530.257521
320.1060551.15690.124811
33-0.059087-0.64460.260227
34-0.134807-1.47060.072023
35-0.082886-0.90420.183862
36-0.121528-1.32570.093737
370.0098060.1070.457494
38-0.133604-1.45740.073814
39-0.005208-0.05680.477394
400.0239610.26140.397124
410.0856990.93490.175874
420.0613540.66930.252303
430.0906210.98860.162442
44-0.034846-0.38010.352267
45-0.019588-0.21370.415582
460.0389870.42530.335695
47-0.023295-0.25410.399923
48-0.016509-0.18010.428694


Parameters (Session):
par1 = 48 ; par2 = 1 ; par3 = 1 ; par4 = 0 ; par5 = 12 ; par6 = White Noise ; par7 = 0.95 ;
Parameters (R input):
par1 = 48 ; par2 = 1 ; par3 = 1 ; par4 = 0 ; par5 = 12 ; par6 = White Noise ; par7 = 0.95 ; par8 = ;
R code (references can be found in the software module):
par8 <- ''
par7 <- '0.95'
par6 <- 'White Noise'
par5 <- '12'
par4 <- '0'
par3 <- '0'
par2 <- '1'
par1 <- '48'
if (par1 == 'Default') {
par1 = 10*log10(length(x))
} else {
par1 <- as.numeric(par1)
}
par2 <- as.numeric(par2)
par3 <- as.numeric(par3)
par4 <- as.numeric(par4)
par5 <- as.numeric(par5)
if (par6 == 'White Noise') par6 <- 'white' else par6 <- 'ma'
par7 <- as.numeric(par7)
if (par8 != '') par8 <- as.numeric(par8)
ox <- x
if (par8 == '') {
if (par2 == 0) {
x <- log(x)
} else {
x <- (x ^ par2 - 1) / par2
}
} else {
x <- log(x,base=par8)
}
if (par3 > 0) x <- diff(x,lag=1,difference=par3)
if (par4 > 0) x <- diff(x,lag=par5,difference=par4)
bitmap(file='picts.png')
op <- par(mfrow=c(2,1))
plot(ox,type='l',main='Original Time Series',xlab='time',ylab='value')
if (par8=='') {
mytitle <- paste('Working Time Series (lambda=',par2,', d=',par3,', D=',par4,')',sep='')
mysub <- paste('(lambda=',par2,', d=',par3,', D=',par4,', CI=', par7, ', CI type=',par6,')',sep='')
} else {
mytitle <- paste('Working Time Series (base=',par8,', d=',par3,', D=',par4,')',sep='')
mysub <- paste('(base=',par8,', d=',par3,', D=',par4,', CI=', par7, ', CI type=',par6,')',sep='')
}
plot(x,type='l', main=mytitle,xlab='time',ylab='value')
par(op)
dev.off()
bitmap(file='pic1.png')
racf <- acf(x, par1, main='Autocorrelation', xlab='time lag', ylab='ACF', ci.type=par6, ci=par7, sub=mysub)
dev.off()
bitmap(file='pic2.png')
rpacf <- pacf(x,par1,main='Partial Autocorrelation',xlab='lags',ylab='PACF',sub=mysub)
dev.off()
(myacf <- c(racf$acf))
(mypacf <- c(rpacf$acf))
lengthx <- length(x)
sqrtn <- sqrt(lengthx)
load(file='createtable')
a<-table.start()
a<-table.row.start(a)
a<-table.element(a,'Autocorrelation Function',4,TRUE)
a<-table.row.end(a)
a<-table.row.start(a)
a<-table.element(a,'Time lag k',header=TRUE)
a<-table.element(a,hyperlink('basics.htm','ACF(k)','click here for more information about the Autocorrelation Function'),header=TRUE)
a<-table.element(a,'T-STAT',header=TRUE)
a<-table.element(a,'P-value',header=TRUE)
a<-table.row.end(a)
for (i in 2:(par1+1)) {
a<-table.row.start(a)
a<-table.element(a,i-1,header=TRUE)
a<-table.element(a,round(myacf[i],6))
mytstat <- myacf[i]*sqrtn
a<-table.element(a,round(mytstat,4))
a<-table.element(a,round(1-pt(abs(mytstat),lengthx),6))
a<-table.row.end(a)
}
a<-table.end(a)
table.save(a,file='mytable.tab')
a<-table.start()
a<-table.row.start(a)
a<-table.element(a,'Partial Autocorrelation Function',4,TRUE)
a<-table.row.end(a)
a<-table.row.start(a)
a<-table.element(a,'Time lag k',header=TRUE)
a<-table.element(a,hyperlink('basics.htm','PACF(k)','click here for more information about the Partial Autocorrelation Function'),header=TRUE)
a<-table.element(a,'T-STAT',header=TRUE)
a<-table.element(a,'P-value',header=TRUE)
a<-table.row.end(a)
for (i in 1:par1) {
a<-table.row.start(a)
a<-table.element(a,i,header=TRUE)
a<-table.element(a,round(mypacf[i],6))
mytstat <- mypacf[i]*sqrtn
a<-table.element(a,round(mytstat,4))
a<-table.element(a,round(1-pt(abs(mytstat),lengthx),6))
a<-table.row.end(a)
}
a<-table.end(a)
table.save(a,file='mytable1.tab')