Free Statistics

of Irreproducible Research!

Author's title

Author*Unverified author*
R Software Modulerwasp_smp.wasp
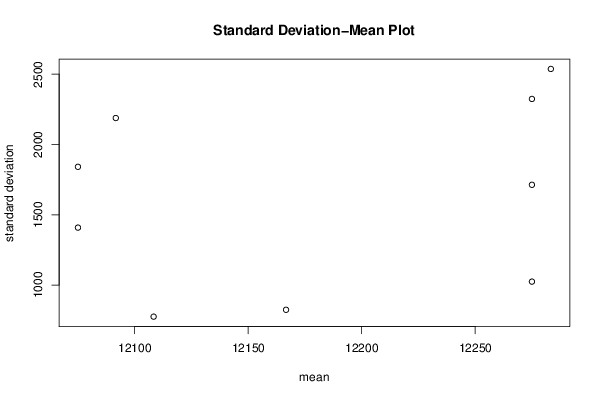
Title produced by softwareStandard Deviation-Mean Plot
Date of computationTue, 15 Jul 2014 12:13:28 +0100
Cite this page as followsStatistical Computations at FreeStatistics.org, Office for Research Development and Education, URL https://freestatistics.org/blog/index.php?v=date/2014/Jul/15/t14054228428qx5x1citc15cy6.htm/, Retrieved Wed, 15 May 2024 14:26:09 +0000
Statistical Computations at FreeStatistics.org, Office for Research Development and Education, URL https://freestatistics.org/blog/index.php?pk=235325, Retrieved Wed, 15 May 2024 14:26:09 +0000
QR Codes:

Original text written by user:
IsPrivate?No (this computation is public)
User-defined keywordsToon Oeyen
Estimated Impact157
Family? (F = Feedback message, R = changed R code, M = changed R Module, P = changed Parameters, D = changed Data)
-       [Standard Deviation-Mean Plot] [tijdreeks B stap 21] [2014-07-15 11:13:28] [529eccf7e66da1786c0a491e4074a2d7] [Current]
Feedback Forum

Post a new message
Dataseries X:
10700
12400
12000
12800
11800
11900
11900
12300
11700
11900
11900
14000
11300
12600
12600
12600
11300
12200
11800
12800
11400
11600
11700
14100
11000
12800
13300
12600
10700
12600
12700
14100
11600
11300
11600
13000
10800
13800
12600
12500
9900
11800
12400
15000
11500
11100
10800
12700
10500
14900
12800
12300
9600
11000
12700
15300
12900
11200
11000
13100
10200
15100
12600
11600
9700
10200
12100
15300
13500
10700
11400
12500
9300
15100
12300
11800
9600
9600
12400
16400
13500
11000
11200
12900
8900
15600
12500
11700
9000
8600
13100
16100
14400
11300
12200
14000
9300
14900
12500
11600
9100
8800
13000
15500
14600
11200
12700
14100


Summary of computational transaction
Raw Inputview raw input (R code)
Raw Outputview raw output of R engine
Computing time2 seconds
R Server'Sir Ronald Aylmer Fisher' @ fisher.wessa.net

\begin{tabular}{lllllllll}
\hline
Summary of computational transaction \tabularnewline
Raw Input & view raw input (R code)  \tabularnewline
Raw Output & view raw output of R engine  \tabularnewline
Computing time & 2 seconds \tabularnewline
R Server & 'Sir Ronald Aylmer Fisher' @ fisher.wessa.net \tabularnewline
\hline
\end{tabular}
%Source: https://freestatistics.org/blog/index.php?pk=235325&T=0

[TABLE]
[ROW][C]Summary of computational transaction[/C][/ROW]
[ROW][C]Raw Input[/C][C]view raw input (R code) [/C][/ROW]
[ROW][C]Raw Output[/C][C]view raw output of R engine [/C][/ROW]
[ROW][C]Computing time[/C][C]2 seconds[/C][/ROW]
[ROW][C]R Server[/C][C]'Sir Ronald Aylmer Fisher' @ fisher.wessa.net[/C][/ROW]
[/TABLE]
Source: https://freestatistics.org/blog/index.php?pk=235325&T=0

Globally Unique Identifier (entire table): ba.freestatistics.org/blog/index.php?pk=235325&T=0

As an alternative you can also use a QR Code:  

The GUIDs for individual cells are displayed in the table below:

Summary of computational transaction
Raw Inputview raw input (R code)
Raw Outputview raw output of R engine
Computing time2 seconds
R Server'Sir Ronald Aylmer Fisher' @ fisher.wessa.net


Standard Deviation-Mean Plot
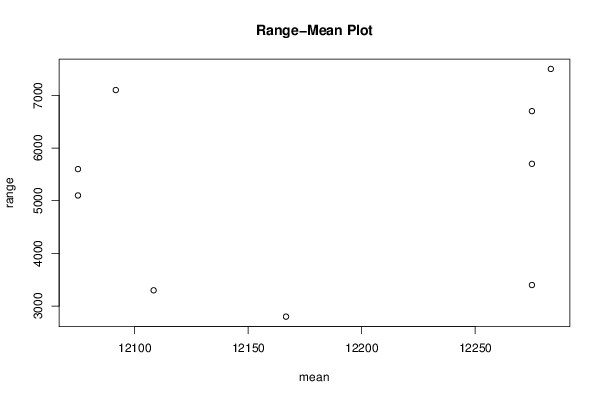
SectionMeanStandard DeviationRange
112108.3333333333775.1343969488993300
212166.6666666667823.88584087112800
3122751024.362329363093400
4120751408.496942262795100
5122751713.117838116435700
6120751841.010098239065600
712091.66666666672188.174138547047100
812283.33333333332537.297536332467500
9122752323.83890851486700

\begin{tabular}{lllllllll}
\hline
Standard Deviation-Mean Plot \tabularnewline
Section & Mean & Standard Deviation & Range \tabularnewline
1 & 12108.3333333333 & 775.134396948899 & 3300 \tabularnewline
2 & 12166.6666666667 & 823.8858408711 & 2800 \tabularnewline
3 & 12275 & 1024.36232936309 & 3400 \tabularnewline
4 & 12075 & 1408.49694226279 & 5100 \tabularnewline
5 & 12275 & 1713.11783811643 & 5700 \tabularnewline
6 & 12075 & 1841.01009823906 & 5600 \tabularnewline
7 & 12091.6666666667 & 2188.17413854704 & 7100 \tabularnewline
8 & 12283.3333333333 & 2537.29753633246 & 7500 \tabularnewline
9 & 12275 & 2323.8389085148 & 6700 \tabularnewline
\hline
\end{tabular}
%Source: https://freestatistics.org/blog/index.php?pk=235325&T=1

[TABLE]
[ROW][C]Standard Deviation-Mean Plot[/C][/ROW]
[ROW][C]Section[/C][C]Mean[/C][C]Standard Deviation[/C][C]Range[/C][/ROW]
[ROW][C]1[/C][C]12108.3333333333[/C][C]775.134396948899[/C][C]3300[/C][/ROW]
[ROW][C]2[/C][C]12166.6666666667[/C][C]823.8858408711[/C][C]2800[/C][/ROW]
[ROW][C]3[/C][C]12275[/C][C]1024.36232936309[/C][C]3400[/C][/ROW]
[ROW][C]4[/C][C]12075[/C][C]1408.49694226279[/C][C]5100[/C][/ROW]
[ROW][C]5[/C][C]12275[/C][C]1713.11783811643[/C][C]5700[/C][/ROW]
[ROW][C]6[/C][C]12075[/C][C]1841.01009823906[/C][C]5600[/C][/ROW]
[ROW][C]7[/C][C]12091.6666666667[/C][C]2188.17413854704[/C][C]7100[/C][/ROW]
[ROW][C]8[/C][C]12283.3333333333[/C][C]2537.29753633246[/C][C]7500[/C][/ROW]
[ROW][C]9[/C][C]12275[/C][C]2323.8389085148[/C][C]6700[/C][/ROW]
[/TABLE]
Source: https://freestatistics.org/blog/index.php?pk=235325&T=1

Globally Unique Identifier (entire table): ba.freestatistics.org/blog/index.php?pk=235325&T=1

As an alternative you can also use a QR Code:  

The GUIDs for individual cells are displayed in the table below:

Standard Deviation-Mean Plot
SectionMeanStandard DeviationRange
112108.3333333333775.1343969488993300
212166.6666666667823.88584087112800
3122751024.362329363093400
4120751408.496942262795100
5122751713.117838116435700
6120751841.010098239065600
712091.66666666672188.174138547047100
812283.33333333332537.297536332467500
9122752323.83890851486700


Regression: S.E.(k) = alpha + beta * Mean(k)
alpha-20734.6130110703
beta1.83577500687643
S.D.2.51098538258522
T-STAT0.731097448678248
p-value0.488463801436326

\begin{tabular}{lllllllll}
\hline
Regression: S.E.(k) = alpha + beta * Mean(k) \tabularnewline
alpha & -20734.6130110703 \tabularnewline
beta & 1.83577500687643 \tabularnewline
S.D. & 2.51098538258522 \tabularnewline
T-STAT & 0.731097448678248 \tabularnewline
p-value & 0.488463801436326 \tabularnewline
\hline
\end{tabular}
%Source: https://freestatistics.org/blog/index.php?pk=235325&T=2

[TABLE]
[ROW][C]Regression: S.E.(k) = alpha + beta * Mean(k)[/C][/ROW]
[ROW][C]alpha[/C][C]-20734.6130110703[/C][/ROW]
[ROW][C]beta[/C][C]1.83577500687643[/C][/ROW]
[ROW][C]S.D.[/C][C]2.51098538258522[/C][/ROW]
[ROW][C]T-STAT[/C][C]0.731097448678248[/C][/ROW]
[ROW][C]p-value[/C][C]0.488463801436326[/C][/ROW]
[/TABLE]
Source: https://freestatistics.org/blog/index.php?pk=235325&T=2

Globally Unique Identifier (entire table): ba.freestatistics.org/blog/index.php?pk=235325&T=2

As an alternative you can also use a QR Code:  

The GUIDs for individual cells are displayed in the table below:

Regression: S.E.(k) = alpha + beta * Mean(k)
alpha-20734.6130110703
beta1.83577500687643
S.D.2.51098538258522
T-STAT0.731097448678248
p-value0.488463801436326


Regression: ln S.E.(k) = alpha + beta * ln Mean(k)
alpha-116.868071906143
beta13.1998515773101
S.D.21.0815826842881
T-STAT0.626131907408823
p-value0.551090890492636
Lambda-12.1998515773101

\begin{tabular}{lllllllll}
\hline
Regression: ln S.E.(k) = alpha + beta * ln Mean(k) \tabularnewline
alpha & -116.868071906143 \tabularnewline
beta & 13.1998515773101 \tabularnewline
S.D. & 21.0815826842881 \tabularnewline
T-STAT & 0.626131907408823 \tabularnewline
p-value & 0.551090890492636 \tabularnewline
Lambda & -12.1998515773101 \tabularnewline
\hline
\end{tabular}
%Source: https://freestatistics.org/blog/index.php?pk=235325&T=3

[TABLE]
[ROW][C]Regression: ln S.E.(k) = alpha + beta * ln Mean(k)[/C][/ROW]
[ROW][C]alpha[/C][C]-116.868071906143[/C][/ROW]
[ROW][C]beta[/C][C]13.1998515773101[/C][/ROW]
[ROW][C]S.D.[/C][C]21.0815826842881[/C][/ROW]
[ROW][C]T-STAT[/C][C]0.626131907408823[/C][/ROW]
[ROW][C]p-value[/C][C]0.551090890492636[/C][/ROW]
[ROW][C]Lambda[/C][C]-12.1998515773101[/C][/ROW]
[/TABLE]
Source: https://freestatistics.org/blog/index.php?pk=235325&T=3

Globally Unique Identifier (entire table): ba.freestatistics.org/blog/index.php?pk=235325&T=3

As an alternative you can also use a QR Code:  

The GUIDs for individual cells are displayed in the table below:

Regression: ln S.E.(k) = alpha + beta * ln Mean(k)
alpha-116.868071906143
beta13.1998515773101
S.D.21.0815826842881
T-STAT0.626131907408823
p-value0.551090890492636
Lambda-12.1998515773101


Parameters (Session):
par1 = 0 ; par2 = no ; par3 = 512 ;
Parameters (R input):
par1 = 12 ;
R code (references can be found in the software module):
par1 <- as.numeric(par1)
(n <- length(x))
(np <- floor(n / par1))
arr <- array(NA,dim=c(par1,np))
j <- 0
k <- 1
for (i in 1:(np*par1))
{
j = j + 1
arr[j,k] <- x[i]
if (j == par1) {
j = 0
k=k+1
}
}
arr
arr.mean <- array(NA,dim=np)
arr.sd <- array(NA,dim=np)
arr.range <- array(NA,dim=np)
for (j in 1:np)
{
arr.mean[j] <- mean(arr[,j],na.rm=TRUE)
arr.sd[j] <- sd(arr[,j],na.rm=TRUE)
arr.range[j] <- max(arr[,j],na.rm=TRUE) - min(arr[,j],na.rm=TRUE)
}
arr.mean
arr.sd
arr.range
(lm1 <- lm(arr.sd~arr.mean))
(lnlm1 <- lm(log(arr.sd)~log(arr.mean)))
(lm2 <- lm(arr.range~arr.mean))
bitmap(file='test1.png')
plot(arr.mean,arr.sd,main='Standard Deviation-Mean Plot',xlab='mean',ylab='standard deviation')
dev.off()
bitmap(file='test2.png')
plot(arr.mean,arr.range,main='Range-Mean Plot',xlab='mean',ylab='range')
dev.off()
load(file='createtable')
a<-table.start()
a<-table.row.start(a)
a<-table.element(a,'Standard Deviation-Mean Plot',4,TRUE)
a<-table.row.end(a)
a<-table.row.start(a)
a<-table.element(a,'Section',header=TRUE)
a<-table.element(a,'Mean',header=TRUE)
a<-table.element(a,'Standard Deviation',header=TRUE)
a<-table.element(a,'Range',header=TRUE)
a<-table.row.end(a)
for (j in 1:np) {
a<-table.row.start(a)
a<-table.element(a,j,header=TRUE)
a<-table.element(a,arr.mean[j])
a<-table.element(a,arr.sd[j] )
a<-table.element(a,arr.range[j] )
a<-table.row.end(a)
}
a<-table.end(a)
table.save(a,file='mytable.tab')
a<-table.start()
a<-table.row.start(a)
a<-table.element(a,'Regression: S.E.(k) = alpha + beta * Mean(k)',2,TRUE)
a<-table.row.end(a)
a<-table.row.start(a)
a<-table.element(a,'alpha',header=TRUE)
a<-table.element(a,lm1$coefficients[[1]])
a<-table.row.end(a)
a<-table.row.start(a)
a<-table.element(a,'beta',header=TRUE)
a<-table.element(a,lm1$coefficients[[2]])
a<-table.row.end(a)
a<-table.row.start(a)
a<-table.element(a,'S.D.',header=TRUE)
a<-table.element(a,summary(lm1)$coefficients[2,2])
a<-table.row.end(a)
a<-table.row.start(a)
a<-table.element(a,'T-STAT',header=TRUE)
a<-table.element(a,summary(lm1)$coefficients[2,3])
a<-table.row.end(a)
a<-table.row.start(a)
a<-table.element(a,'p-value',header=TRUE)
a<-table.element(a,summary(lm1)$coefficients[2,4])
a<-table.row.end(a)
a<-table.end(a)
table.save(a,file='mytable1.tab')
a<-table.start()
a<-table.row.start(a)
a<-table.element(a,'Regression: ln S.E.(k) = alpha + beta * ln Mean(k)',2,TRUE)
a<-table.row.end(a)
a<-table.row.start(a)
a<-table.element(a,'alpha',header=TRUE)
a<-table.element(a,lnlm1$coefficients[[1]])
a<-table.row.end(a)
a<-table.row.start(a)
a<-table.element(a,'beta',header=TRUE)
a<-table.element(a,lnlm1$coefficients[[2]])
a<-table.row.end(a)
a<-table.row.start(a)
a<-table.element(a,'S.D.',header=TRUE)
a<-table.element(a,summary(lnlm1)$coefficients[2,2])
a<-table.row.end(a)
a<-table.row.start(a)
a<-table.element(a,'T-STAT',header=TRUE)
a<-table.element(a,summary(lnlm1)$coefficients[2,3])
a<-table.row.end(a)
a<-table.row.start(a)
a<-table.element(a,'p-value',header=TRUE)
a<-table.element(a,summary(lnlm1)$coefficients[2,4])
a<-table.row.end(a)
a<-table.row.start(a)
a<-table.element(a,'Lambda',header=TRUE)
a<-table.element(a,1-lnlm1$coefficients[[2]])
a<-table.row.end(a)
a<-table.end(a)
table.save(a,file='mytable2.tab')