Free Statistics
of Irreproducible Research!
Description of Statistical Computation | |||||||||||||||||||||||||||||||||||||||||
|---|---|---|---|---|---|---|---|---|---|---|---|---|---|---|---|---|---|---|---|---|---|---|---|---|---|---|---|---|---|---|---|---|---|---|---|---|---|---|---|---|---|
| Author's title | |||||||||||||||||||||||||||||||||||||||||
| Author | *Unverified author* | ||||||||||||||||||||||||||||||||||||||||
| R Software Module | rwasp_univariatedataseries.wasp | ||||||||||||||||||||||||||||||||||||||||
| Title produced by software | Univariate Data Series | ||||||||||||||||||||||||||||||||||||||||
| Date of computation | Thu, 17 Jul 2014 10:30:59 +0100 | ||||||||||||||||||||||||||||||||||||||||
| Cite this page as follows | Statistical Computations at FreeStatistics.org, Office for Research Development and Education, URL https://freestatistics.org/blog/index.php?v=date/2014/Jul/17/t1405589543513dpg95wv9kqml.htm/, Retrieved Tue, 14 May 2024 17:00:30 +0000 | ||||||||||||||||||||||||||||||||||||||||
| Statistical Computations at FreeStatistics.org, Office for Research Development and Education, URL https://freestatistics.org/blog/index.php?pk=235330, Retrieved Tue, 14 May 2024 17:00:30 +0000 | |||||||||||||||||||||||||||||||||||||||||
| QR Codes: | |||||||||||||||||||||||||||||||||||||||||
|
| |||||||||||||||||||||||||||||||||||||||||
| Original text written by user: | |||||||||||||||||||||||||||||||||||||||||
| IsPrivate? | No (this computation is public) | ||||||||||||||||||||||||||||||||||||||||
| User-defined keywords | Niels Diependaele | ||||||||||||||||||||||||||||||||||||||||
| Estimated Impact | 167 | ||||||||||||||||||||||||||||||||||||||||
Tree of Dependent Computations | |||||||||||||||||||||||||||||||||||||||||
| Family? (F = Feedback message, R = changed R code, M = changed R Module, P = changed Parameters, D = changed Data) | |||||||||||||||||||||||||||||||||||||||||
| - [Univariate Data Series] [Omzetcijfers Auto...] [2014-07-17 09:30:59] [0b4002381e6bc6fac3755b1107da82aa] [Current] | |||||||||||||||||||||||||||||||||||||||||
| Feedback Forum | |||||||||||||||||||||||||||||||||||||||||
Post a new message | |||||||||||||||||||||||||||||||||||||||||
Dataset | |||||||||||||||||||||||||||||||||||||||||
| Dataseries X: | |||||||||||||||||||||||||||||||||||||||||
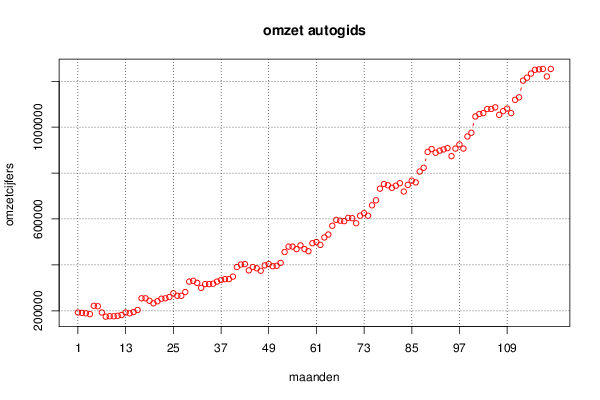
192528 190773 188996 185320 221698 219771 192528 174414 176163 176163 178112 181616 192528 188996 194449 203412 254400 254400 243516 232604 241567 252473 254400 259853 276217 265306 265306 281670 327033 330709 321580 299762 316121 316121 317876 327033 334241 337917 337917 348823 390681 401565 403314 376071 390681 385228 374317 397889 403314 394185 396112 408773 456085 479624 479624 468740 485082 468740 459588 494239 499664 486832 519533 532366 570521 595842 592339 590389 604999 603222 581432 614128 625040 614128 659491 681309 732102 752143 746712 735800 744935 755841 719441 748461 766753 759373 806657 822993 892101 904761 888424 897554 903007 908460 873809 906511 924624 906511 959275 975618 1046468 1057380 1060884 1079170 1079170 1086378 1053676 1070041 1080925 1060884 1119079 1129986 1202597 1215430 1233543 1249908 1251657 1253584 1220883 1253584 | |||||||||||||||||||||||||||||||||||||||||
Tables (Output of Computation) | |||||||||||||||||||||||||||||||||||||||||
| |||||||||||||||||||||||||||||||||||||||||
Figures (Output of Computation) | |||||||||||||||||||||||||||||||||||||||||
Input Parameters & R Code | |||||||||||||||||||||||||||||||||||||||||
| Parameters (Session): | |||||||||||||||||||||||||||||||||||||||||
| par1 = Omzet autogids (uitgedrukt in 100.00 EUR) ; par2 = niet gekend ; par3 = Deze reeks omschrijft de omzet van autogids vanaf januari 2004 tot december 2013 ; par4 = 12 ; | |||||||||||||||||||||||||||||||||||||||||
| Parameters (R input): | |||||||||||||||||||||||||||||||||||||||||
| par1 = Omzet autogids (uitgedrukt in 100.00 EUR) ; par2 = niet gekend ; par3 = Deze reeks omschrijft de omzet van autogids vanaf januari 2004 tot december 2013 ; par4 = 12 ; | |||||||||||||||||||||||||||||||||||||||||
| R code (references can be found in the software module): | |||||||||||||||||||||||||||||||||||||||||
if (par4 != 'No season') { | |||||||||||||||||||||||||||||||||||||||||