Free Statistics

of Irreproducible Research!

Author's title

Author*Unverified author*
R Software Modulerwasp_correlation.wasp
Title produced by softwarePearson Correlation
Date of computationWed, 07 May 2014 16:17:53 -0400
Cite this page as followsStatistical Computations at FreeStatistics.org, Office for Research Development and Education, URL https://freestatistics.org/blog/index.php?v=date/2014/May/07/t1399493895ooxt9wvhwqy3zgf.htm/, Retrieved Tue, 14 May 2024 12:10:18 +0000
Statistical Computations at FreeStatistics.org, Office for Research Development and Education, URL https://freestatistics.org/blog/index.php?pk=234774, Retrieved Tue, 14 May 2024 12:10:18 +0000
QR Codes:

Original text written by user:
IsPrivate?No (this computation is public)
User-defined keywords
Estimated Impact186
Family? (F = Feedback message, R = changed R code, M = changed R Module, P = changed Parameters, D = changed Data)
-       [Pearson Correlation] [] [2014-05-07 20:17:53] [d41d8cd98f00b204e9800998ecf8427e] [Current]
Feedback Forum

Post a new message
Dataseries X:
1
3
3
3
3
0
0
2
2
2
2
2
2
3
3
3
3
3
3
3
3
2
2
2
2
2
2
2
2
3
3
3
3
1
1
1
1
1
1
2
2
2
2
2
2
3
3
1
1
1
1
1
1
1
1
0
0
0
0
2
2
3
3
2
2
2
2
Dataseries Y:
60677
61007
62158
61808
61720
63167
63934
64564
66264
66647
67647
68339
69579
70267
70278
71697
73274
74228
75338
76777
78270
80281
82727
83946
86614
89018
91287
93399
95746
98330
101574
104172
106591
108925
109820
110828
113098
115331
117316
119336
121251
123565
125649
126548
127841
128584
130621
132590
133409
136016
137150
138959
142751
143569
144725
146474
146850
148926
150881
152435
153769
154509
154642
153566
154565
155359
155421


Summary of computational transaction
Raw Inputview raw input (R code)
Raw Outputview raw output of R engine
Computing time1 seconds
R Server'Gwilym Jenkins' @ jenkins.wessa.net

\begin{tabular}{lllllllll}
\hline
Summary of computational transaction \tabularnewline
Raw Input & view raw input (R code)  \tabularnewline
Raw Output & view raw output of R engine  \tabularnewline
Computing time & 1 seconds \tabularnewline
R Server & 'Gwilym Jenkins' @ jenkins.wessa.net \tabularnewline
\hline
\end{tabular}
%Source: https://freestatistics.org/blog/index.php?pk=234774&T=0

[TABLE]
[ROW][C]Summary of computational transaction[/C][/ROW]
[ROW][C]Raw Input[/C][C]view raw input (R code) [/C][/ROW]
[ROW][C]Raw Output[/C][C]view raw output of R engine [/C][/ROW]
[ROW][C]Computing time[/C][C]1 seconds[/C][/ROW]
[ROW][C]R Server[/C][C]'Gwilym Jenkins' @ jenkins.wessa.net[/C][/ROW]
[/TABLE]
Source: https://freestatistics.org/blog/index.php?pk=234774&T=0

Globally Unique Identifier (entire table): ba.freestatistics.org/blog/index.php?pk=234774&T=0

As an alternative you can also use a QR Code:  

The GUIDs for individual cells are displayed in the table below:

Summary of computational transaction
Raw Inputview raw input (R code)
Raw Outputview raw output of R engine
Computing time1 seconds
R Server'Gwilym Jenkins' @ jenkins.wessa.net


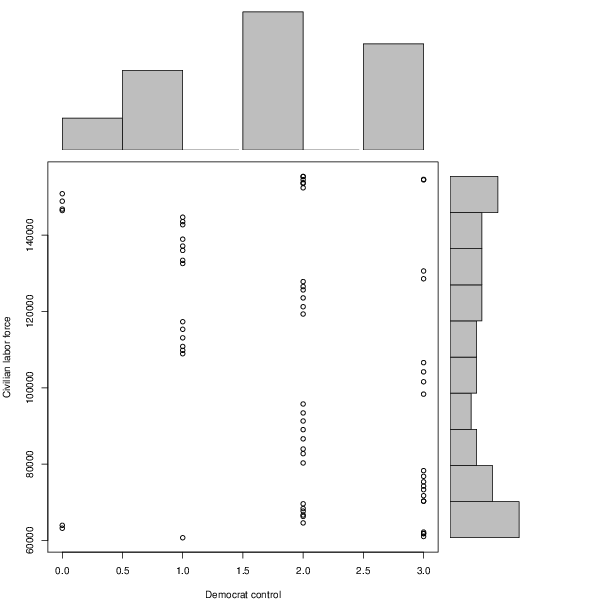
Pearson Product Moment Correlation - Ungrouped Data
StatisticVariable XVariable Y
Mean1.8955223880597106814.985074627
Biased Variance0.8696814435286251070965055.71619
Biased Standard Deviation0.93256712548139232725.6024500114
Covariance-10940.5773405699
Correlation-0.353135697449707
Determination0.124704820813291
T-Test-3.0431336852474
p-value (2 sided)0.0033763990409347
p-value (1 sided)0.00168819952046735
Degrees of Freedom65
Number of Observations67

\begin{tabular}{lllllllll}
\hline
Pearson Product Moment Correlation - Ungrouped Data \tabularnewline
Statistic & Variable X & Variable Y \tabularnewline
Mean & 1.8955223880597 & 106814.985074627 \tabularnewline
Biased Variance & 0.869681443528625 & 1070965055.71619 \tabularnewline
Biased Standard Deviation & 0.932567125481392 & 32725.6024500114 \tabularnewline
Covariance & -10940.5773405699 \tabularnewline
Correlation & -0.353135697449707 \tabularnewline
Determination & 0.124704820813291 \tabularnewline
T-Test & -3.0431336852474 \tabularnewline
p-value (2 sided) & 0.0033763990409347 \tabularnewline
p-value (1 sided) & 0.00168819952046735 \tabularnewline
Degrees of Freedom & 65 \tabularnewline
Number of Observations & 67 \tabularnewline
\hline
\end{tabular}
%Source: https://freestatistics.org/blog/index.php?pk=234774&T=1

[TABLE]
[ROW][C]Pearson Product Moment Correlation - Ungrouped Data[/C][/ROW]
[ROW][C]Statistic[/C][C]Variable X[/C][C]Variable Y[/C][/ROW]
[ROW][C]Mean[/C][C]1.8955223880597[/C][C]106814.985074627[/C][/ROW]
[ROW][C]Biased Variance[/C][C]0.869681443528625[/C][C]1070965055.71619[/C][/ROW]
[ROW][C]Biased Standard Deviation[/C][C]0.932567125481392[/C][C]32725.6024500114[/C][/ROW]
[ROW][C]Covariance[/C][C]-10940.5773405699[/C][/ROW]
[ROW][C]Correlation[/C][C]-0.353135697449707[/C][/ROW]
[ROW][C]Determination[/C][C]0.124704820813291[/C][/ROW]
[ROW][C]T-Test[/C][C]-3.0431336852474[/C][/ROW]
[ROW][C]p-value (2 sided)[/C][C]0.0033763990409347[/C][/ROW]
[ROW][C]p-value (1 sided)[/C][C]0.00168819952046735[/C][/ROW]
[ROW][C]Degrees of Freedom[/C][C]65[/C][/ROW]
[ROW][C]Number of Observations[/C][C]67[/C][/ROW]
[/TABLE]
Source: https://freestatistics.org/blog/index.php?pk=234774&T=1

Globally Unique Identifier (entire table): ba.freestatistics.org/blog/index.php?pk=234774&T=1

As an alternative you can also use a QR Code:  

The GUIDs for individual cells are displayed in the table below:

Pearson Product Moment Correlation - Ungrouped Data
StatisticVariable XVariable Y
Mean1.8955223880597106814.985074627
Biased Variance0.8696814435286251070965055.71619
Biased Standard Deviation0.93256712548139232725.6024500114
Covariance-10940.5773405699
Correlation-0.353135697449707
Determination0.124704820813291
T-Test-3.0431336852474
p-value (2 sided)0.0033763990409347
p-value (1 sided)0.00168819952046735
Degrees of Freedom65
Number of Observations67


Parameters (Session):
Parameters (R input):
R code (references can be found in the software module):
x <- x[!is.na(y)]
y <- y[!is.na(y)]
y <- y[!is.na(x)]
x <- x[!is.na(x)]
bitmap(file='test1.png')
histx <- hist(x, plot=FALSE)
histy <- hist(y, plot=FALSE)
maxcounts <- max(c(histx$counts, histx$counts))
xrange <- c(min(x),max(x))
yrange <- c(min(y),max(y))
nf <- layout(matrix(c(2,0,1,3),2,2,byrow=TRUE), c(3,1), c(1,3), TRUE)
par(mar=c(4,4,1,1))
plot(x, y, xlim=xrange, ylim=yrange, xlab=xlab, ylab=ylab)
par(mar=c(0,4,1,1))
barplot(histx$counts, axes=FALSE, ylim=c(0, maxcounts), space=0)
par(mar=c(4,0,1,1))
barplot(histy$counts, axes=FALSE, xlim=c(0, maxcounts), space=0, horiz=TRUE)
dev.off()
lx = length(x)
makebiased = (lx-1)/lx
varx = var(x)*makebiased
vary = var(y)*makebiased
corxy <- cor.test(x,y,method='pearson', na.rm = T)
cxy <- as.matrix(corxy$estimate)[1,1]
load(file='createtable')
a<-table.start()
a<-table.row.start(a)
a<-table.element(a,'Pearson Product Moment Correlation - Ungrouped Data',3,TRUE)
a<-table.row.end(a)
a<-table.row.start(a)
a<-table.element(a,'Statistic',1,TRUE)
a<-table.element(a,'Variable X',1,TRUE)
a<-table.element(a,'Variable Y',1,TRUE)
a<-table.row.end(a)
a<-table.row.start(a)
a<-table.element(a,hyperlink('arithmetic_mean.htm','Mean',''),header=TRUE)
a<-table.element(a,mean(x))
a<-table.element(a,mean(y))
a<-table.row.end(a)
a<-table.row.start(a)
a<-table.element(a,hyperlink('biased.htm','Biased Variance',''),header=TRUE)
a<-table.element(a,varx)
a<-table.element(a,vary)
a<-table.row.end(a)
a<-table.row.start(a)
a<-table.element(a,hyperlink('biased1.htm','Biased Standard Deviation',''),header=TRUE)
a<-table.element(a,sqrt(varx))
a<-table.element(a,sqrt(vary))
a<-table.row.end(a)
a<-table.row.start(a)
a<-table.element(a,hyperlink('covariance.htm','Covariance',''),header=TRUE)
a<-table.element(a,cov(x,y),2)
a<-table.row.end(a)
a<-table.row.start(a)
a<-table.element(a,hyperlink('pearson_correlation.htm','Correlation',''),header=TRUE)
a<-table.element(a,cxy,2)
a<-table.row.end(a)
a<-table.row.start(a)
a<-table.element(a,hyperlink('coeff_of_determination.htm','Determination',''),header=TRUE)
a<-table.element(a,cxy*cxy,2)
a<-table.row.end(a)
a<-table.row.start(a)
a<-table.element(a,hyperlink('ttest_statistic.htm','T-Test',''),header=TRUE)
a<-table.element(a,as.matrix(corxy$statistic)[1,1],2)
a<-table.row.end(a)
a<-table.row.start(a)
a<-table.element(a,'p-value (2 sided)',header=TRUE)
a<-table.element(a,(p2 <- as.matrix(corxy$p.value)[1,1]),2)
a<-table.row.end(a)
a<-table.row.start(a)
a<-table.element(a,'p-value (1 sided)',header=TRUE)
a<-table.element(a,p2/2,2)
a<-table.row.end(a)
a<-table.row.start(a)
a<-table.element(a,'Degrees of Freedom',header=TRUE)
a<-table.element(a,lx-2,2)
a<-table.row.end(a)
a<-table.row.start(a)
a<-table.element(a,'Number of Observations',header=TRUE)
a<-table.element(a,lx,2)
a<-table.row.end(a)
a<-table.end(a)
table.save(a,file='mytable.tab')