Free Statistics

of Irreproducible Research!

Author's title

Author*Unverified author*
R Software Modulerwasp_autocorrelation.wasp
Title produced by software(Partial) Autocorrelation Function
Date of computationSat, 10 May 2014 13:04:37 -0400
Cite this page as followsStatistical Computations at FreeStatistics.org, Office for Research Development and Education, URL https://freestatistics.org/blog/index.php?v=date/2014/May/10/t1399741512s1cu79u9bu4cqtj.htm/, Retrieved Tue, 14 May 2024 14:02:52 +0000
Statistical Computations at FreeStatistics.org, Office for Research Development and Education, URL https://freestatistics.org/blog/index.php?pk=234779, Retrieved Tue, 14 May 2024 14:02:52 +0000
QR Codes:

Original text written by user:
IsPrivate?No (this computation is public)
User-defined keywords
Estimated Impact187
Family? (F = Feedback message, R = changed R code, M = changed R Module, P = changed Parameters, D = changed Data)
-       [(Partial) Autocorrelation Function] [] [2014-05-10 17:04:37] [a3f6f3ab25c27d7686091f6989fa462a] [Current]
- RM      [(Partial) Autocorrelation Function] [] [2014-05-22 23:22:20] [db363657be53a1294332fdf107f4512c]
Feedback Forum

Post a new message
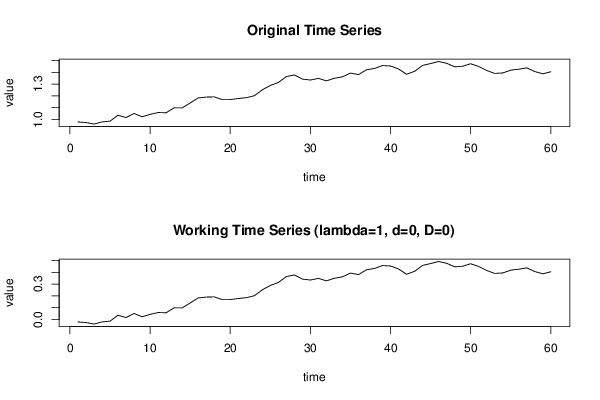
Dataseries X:
0,978
0,973
0,96
0,978
0,985
1,035
1,015
1,05
1,022
1,042
1,058
1,056
1,098
1,097
1,139
1,182
1,189
1,191
1,168
1,168
1,177
1,184
1,2
1,251
1,288
1,313
1,363
1,377
1,342
1,334
1,348
1,327
1,349
1,361
1,393
1,38
1,421
1,432
1,457
1,453
1,428
1,383
1,408
1,458
1,474
1,491
1,476
1,446
1,451
1,472
1,449
1,415
1,39
1,394
1,418
1,426
1,437
1,406
1,387
1,404


Summary of computational transaction
Raw Inputview raw input (R code)
Raw Outputview raw output of R engine
Computing time2 seconds
R Server'Gertrude Mary Cox' @ cox.wessa.net

\begin{tabular}{lllllllll}
\hline
Summary of computational transaction \tabularnewline
Raw Input & view raw input (R code)  \tabularnewline
Raw Output & view raw output of R engine  \tabularnewline
Computing time & 2 seconds \tabularnewline
R Server & 'Gertrude Mary Cox' @ cox.wessa.net \tabularnewline
\hline
\end{tabular}
%Source: https://freestatistics.org/blog/index.php?pk=234779&T=0

[TABLE]
[ROW][C]Summary of computational transaction[/C][/ROW]
[ROW][C]Raw Input[/C][C]view raw input (R code) [/C][/ROW]
[ROW][C]Raw Output[/C][C]view raw output of R engine [/C][/ROW]
[ROW][C]Computing time[/C][C]2 seconds[/C][/ROW]
[ROW][C]R Server[/C][C]'Gertrude Mary Cox' @ cox.wessa.net[/C][/ROW]
[/TABLE]
Source: https://freestatistics.org/blog/index.php?pk=234779&T=0

Globally Unique Identifier (entire table): ba.freestatistics.org/blog/index.php?pk=234779&T=0

As an alternative you can also use a QR Code:  

The GUIDs for individual cells are displayed in the table below:

Summary of computational transaction
Raw Inputview raw input (R code)
Raw Outputview raw output of R engine
Computing time2 seconds
R Server'Gertrude Mary Cox' @ cox.wessa.net


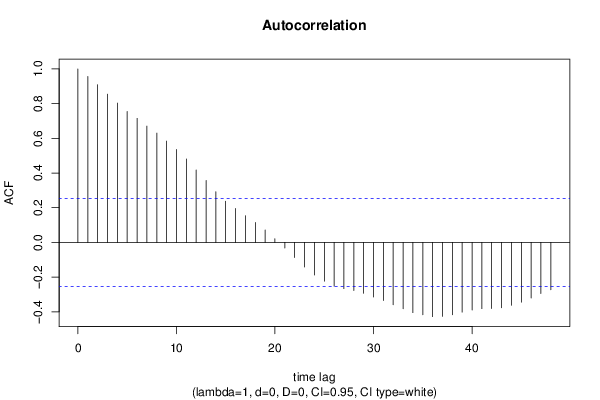
Autocorrelation Function
Time lag kACF(k)T-STATP-value
10.9568957.41210
20.9092877.04330
30.8546976.62050
40.8031396.22110
50.7547035.84590
60.7149155.53770
70.6704955.19361e-06
80.629944.87954e-06
90.5841194.52461.5e-05
100.5361264.15285.3e-05
110.4806313.7230.000218
120.4175643.23440.000992
130.3567322.76320.003794
140.292362.26460.013581
150.2376691.8410.035286
160.1951031.51130.067985
170.1540991.19360.118658
180.1148850.88990.188538
190.071640.55490.290506
200.0213660.16550.434553
21-0.032859-0.25450.399982
22-0.087475-0.67760.250321
23-0.141748-1.0980.138302
24-0.188124-1.45720.075137
25-0.223248-1.72930.044451
26-0.252313-1.95440.027659
27-0.266657-2.06550.021601
28-0.277754-2.15150.017737
29-0.292967-2.26930.013429
30-0.315217-2.44170.008793
31-0.334692-2.59250.005975
32-0.359836-2.78730.003554
33-0.382711-2.96450.002172
34-0.405071-3.13770.00132
35-0.417146-3.23120.001002
36-0.428134-3.31630.000776
37-0.426388-3.30280.000808
38-0.417011-3.23020.001005
39-0.402209-3.11550.001408
40-0.389692-3.01850.001863
41-0.382023-2.95910.002205
42-0.38148-2.95490.002232
43-0.377252-2.92220.002447
44-0.36215-2.80520.003384
45-0.344552-2.66890.004887
46-0.320273-2.48080.007965
47-0.29446-2.28090.013061
48-0.273391-2.11770.019178

\begin{tabular}{lllllllll}
\hline
Autocorrelation Function \tabularnewline
Time lag k & ACF(k) & T-STAT & P-value \tabularnewline
1 & 0.956895 & 7.4121 & 0 \tabularnewline
2 & 0.909287 & 7.0433 & 0 \tabularnewline
3 & 0.854697 & 6.6205 & 0 \tabularnewline
4 & 0.803139 & 6.2211 & 0 \tabularnewline
5 & 0.754703 & 5.8459 & 0 \tabularnewline
6 & 0.714915 & 5.5377 & 0 \tabularnewline
7 & 0.670495 & 5.1936 & 1e-06 \tabularnewline
8 & 0.62994 & 4.8795 & 4e-06 \tabularnewline
9 & 0.584119 & 4.5246 & 1.5e-05 \tabularnewline
10 & 0.536126 & 4.1528 & 5.3e-05 \tabularnewline
11 & 0.480631 & 3.723 & 0.000218 \tabularnewline
12 & 0.417564 & 3.2344 & 0.000992 \tabularnewline
13 & 0.356732 & 2.7632 & 0.003794 \tabularnewline
14 & 0.29236 & 2.2646 & 0.013581 \tabularnewline
15 & 0.237669 & 1.841 & 0.035286 \tabularnewline
16 & 0.195103 & 1.5113 & 0.067985 \tabularnewline
17 & 0.154099 & 1.1936 & 0.118658 \tabularnewline
18 & 0.114885 & 0.8899 & 0.188538 \tabularnewline
19 & 0.07164 & 0.5549 & 0.290506 \tabularnewline
20 & 0.021366 & 0.1655 & 0.434553 \tabularnewline
21 & -0.032859 & -0.2545 & 0.399982 \tabularnewline
22 & -0.087475 & -0.6776 & 0.250321 \tabularnewline
23 & -0.141748 & -1.098 & 0.138302 \tabularnewline
24 & -0.188124 & -1.4572 & 0.075137 \tabularnewline
25 & -0.223248 & -1.7293 & 0.044451 \tabularnewline
26 & -0.252313 & -1.9544 & 0.027659 \tabularnewline
27 & -0.266657 & -2.0655 & 0.021601 \tabularnewline
28 & -0.277754 & -2.1515 & 0.017737 \tabularnewline
29 & -0.292967 & -2.2693 & 0.013429 \tabularnewline
30 & -0.315217 & -2.4417 & 0.008793 \tabularnewline
31 & -0.334692 & -2.5925 & 0.005975 \tabularnewline
32 & -0.359836 & -2.7873 & 0.003554 \tabularnewline
33 & -0.382711 & -2.9645 & 0.002172 \tabularnewline
34 & -0.405071 & -3.1377 & 0.00132 \tabularnewline
35 & -0.417146 & -3.2312 & 0.001002 \tabularnewline
36 & -0.428134 & -3.3163 & 0.000776 \tabularnewline
37 & -0.426388 & -3.3028 & 0.000808 \tabularnewline
38 & -0.417011 & -3.2302 & 0.001005 \tabularnewline
39 & -0.402209 & -3.1155 & 0.001408 \tabularnewline
40 & -0.389692 & -3.0185 & 0.001863 \tabularnewline
41 & -0.382023 & -2.9591 & 0.002205 \tabularnewline
42 & -0.38148 & -2.9549 & 0.002232 \tabularnewline
43 & -0.377252 & -2.9222 & 0.002447 \tabularnewline
44 & -0.36215 & -2.8052 & 0.003384 \tabularnewline
45 & -0.344552 & -2.6689 & 0.004887 \tabularnewline
46 & -0.320273 & -2.4808 & 0.007965 \tabularnewline
47 & -0.29446 & -2.2809 & 0.013061 \tabularnewline
48 & -0.273391 & -2.1177 & 0.019178 \tabularnewline
\hline
\end{tabular}
%Source: https://freestatistics.org/blog/index.php?pk=234779&T=1

[TABLE]
[ROW][C]Autocorrelation Function[/C][/ROW]
[ROW][C]Time lag k[/C][C]ACF(k)[/C][C]T-STAT[/C][C]P-value[/C][/ROW]
[ROW][C]1[/C][C]0.956895[/C][C]7.4121[/C][C]0[/C][/ROW]
[ROW][C]2[/C][C]0.909287[/C][C]7.0433[/C][C]0[/C][/ROW]
[ROW][C]3[/C][C]0.854697[/C][C]6.6205[/C][C]0[/C][/ROW]
[ROW][C]4[/C][C]0.803139[/C][C]6.2211[/C][C]0[/C][/ROW]
[ROW][C]5[/C][C]0.754703[/C][C]5.8459[/C][C]0[/C][/ROW]
[ROW][C]6[/C][C]0.714915[/C][C]5.5377[/C][C]0[/C][/ROW]
[ROW][C]7[/C][C]0.670495[/C][C]5.1936[/C][C]1e-06[/C][/ROW]
[ROW][C]8[/C][C]0.62994[/C][C]4.8795[/C][C]4e-06[/C][/ROW]
[ROW][C]9[/C][C]0.584119[/C][C]4.5246[/C][C]1.5e-05[/C][/ROW]
[ROW][C]10[/C][C]0.536126[/C][C]4.1528[/C][C]5.3e-05[/C][/ROW]
[ROW][C]11[/C][C]0.480631[/C][C]3.723[/C][C]0.000218[/C][/ROW]
[ROW][C]12[/C][C]0.417564[/C][C]3.2344[/C][C]0.000992[/C][/ROW]
[ROW][C]13[/C][C]0.356732[/C][C]2.7632[/C][C]0.003794[/C][/ROW]
[ROW][C]14[/C][C]0.29236[/C][C]2.2646[/C][C]0.013581[/C][/ROW]
[ROW][C]15[/C][C]0.237669[/C][C]1.841[/C][C]0.035286[/C][/ROW]
[ROW][C]16[/C][C]0.195103[/C][C]1.5113[/C][C]0.067985[/C][/ROW]
[ROW][C]17[/C][C]0.154099[/C][C]1.1936[/C][C]0.118658[/C][/ROW]
[ROW][C]18[/C][C]0.114885[/C][C]0.8899[/C][C]0.188538[/C][/ROW]
[ROW][C]19[/C][C]0.07164[/C][C]0.5549[/C][C]0.290506[/C][/ROW]
[ROW][C]20[/C][C]0.021366[/C][C]0.1655[/C][C]0.434553[/C][/ROW]
[ROW][C]21[/C][C]-0.032859[/C][C]-0.2545[/C][C]0.399982[/C][/ROW]
[ROW][C]22[/C][C]-0.087475[/C][C]-0.6776[/C][C]0.250321[/C][/ROW]
[ROW][C]23[/C][C]-0.141748[/C][C]-1.098[/C][C]0.138302[/C][/ROW]
[ROW][C]24[/C][C]-0.188124[/C][C]-1.4572[/C][C]0.075137[/C][/ROW]
[ROW][C]25[/C][C]-0.223248[/C][C]-1.7293[/C][C]0.044451[/C][/ROW]
[ROW][C]26[/C][C]-0.252313[/C][C]-1.9544[/C][C]0.027659[/C][/ROW]
[ROW][C]27[/C][C]-0.266657[/C][C]-2.0655[/C][C]0.021601[/C][/ROW]
[ROW][C]28[/C][C]-0.277754[/C][C]-2.1515[/C][C]0.017737[/C][/ROW]
[ROW][C]29[/C][C]-0.292967[/C][C]-2.2693[/C][C]0.013429[/C][/ROW]
[ROW][C]30[/C][C]-0.315217[/C][C]-2.4417[/C][C]0.008793[/C][/ROW]
[ROW][C]31[/C][C]-0.334692[/C][C]-2.5925[/C][C]0.005975[/C][/ROW]
[ROW][C]32[/C][C]-0.359836[/C][C]-2.7873[/C][C]0.003554[/C][/ROW]
[ROW][C]33[/C][C]-0.382711[/C][C]-2.9645[/C][C]0.002172[/C][/ROW]
[ROW][C]34[/C][C]-0.405071[/C][C]-3.1377[/C][C]0.00132[/C][/ROW]
[ROW][C]35[/C][C]-0.417146[/C][C]-3.2312[/C][C]0.001002[/C][/ROW]
[ROW][C]36[/C][C]-0.428134[/C][C]-3.3163[/C][C]0.000776[/C][/ROW]
[ROW][C]37[/C][C]-0.426388[/C][C]-3.3028[/C][C]0.000808[/C][/ROW]
[ROW][C]38[/C][C]-0.417011[/C][C]-3.2302[/C][C]0.001005[/C][/ROW]
[ROW][C]39[/C][C]-0.402209[/C][C]-3.1155[/C][C]0.001408[/C][/ROW]
[ROW][C]40[/C][C]-0.389692[/C][C]-3.0185[/C][C]0.001863[/C][/ROW]
[ROW][C]41[/C][C]-0.382023[/C][C]-2.9591[/C][C]0.002205[/C][/ROW]
[ROW][C]42[/C][C]-0.38148[/C][C]-2.9549[/C][C]0.002232[/C][/ROW]
[ROW][C]43[/C][C]-0.377252[/C][C]-2.9222[/C][C]0.002447[/C][/ROW]
[ROW][C]44[/C][C]-0.36215[/C][C]-2.8052[/C][C]0.003384[/C][/ROW]
[ROW][C]45[/C][C]-0.344552[/C][C]-2.6689[/C][C]0.004887[/C][/ROW]
[ROW][C]46[/C][C]-0.320273[/C][C]-2.4808[/C][C]0.007965[/C][/ROW]
[ROW][C]47[/C][C]-0.29446[/C][C]-2.2809[/C][C]0.013061[/C][/ROW]
[ROW][C]48[/C][C]-0.273391[/C][C]-2.1177[/C][C]0.019178[/C][/ROW]
[/TABLE]
Source: https://freestatistics.org/blog/index.php?pk=234779&T=1

Globally Unique Identifier (entire table): ba.freestatistics.org/blog/index.php?pk=234779&T=1

As an alternative you can also use a QR Code:  

The GUIDs for individual cells are displayed in the table below:

Autocorrelation Function
Time lag kACF(k)T-STATP-value
10.9568957.41210
20.9092877.04330
30.8546976.62050
40.8031396.22110
50.7547035.84590
60.7149155.53770
70.6704955.19361e-06
80.629944.87954e-06
90.5841194.52461.5e-05
100.5361264.15285.3e-05
110.4806313.7230.000218
120.4175643.23440.000992
130.3567322.76320.003794
140.292362.26460.013581
150.2376691.8410.035286
160.1951031.51130.067985
170.1540991.19360.118658
180.1148850.88990.188538
190.071640.55490.290506
200.0213660.16550.434553
21-0.032859-0.25450.399982
22-0.087475-0.67760.250321
23-0.141748-1.0980.138302
24-0.188124-1.45720.075137
25-0.223248-1.72930.044451
26-0.252313-1.95440.027659
27-0.266657-2.06550.021601
28-0.277754-2.15150.017737
29-0.292967-2.26930.013429
30-0.315217-2.44170.008793
31-0.334692-2.59250.005975
32-0.359836-2.78730.003554
33-0.382711-2.96450.002172
34-0.405071-3.13770.00132
35-0.417146-3.23120.001002
36-0.428134-3.31630.000776
37-0.426388-3.30280.000808
38-0.417011-3.23020.001005
39-0.402209-3.11550.001408
40-0.389692-3.01850.001863
41-0.382023-2.95910.002205
42-0.38148-2.95490.002232
43-0.377252-2.92220.002447
44-0.36215-2.80520.003384
45-0.344552-2.66890.004887
46-0.320273-2.48080.007965
47-0.29446-2.28090.013061
48-0.273391-2.11770.019178


Partial Autocorrelation Function
Time lag kPACF(k)T-STATP-value
10.9568957.41210
2-0.075419-0.58420.280641
3-0.105509-0.81730.208504
40.0146450.11340.455031
50.0116950.09060.464059
60.0666910.51660.303673
7-0.093701-0.72580.23539
80.0127510.09880.460825
9-0.075962-0.58840.279236
10-0.053252-0.41250.340726
11-0.104544-0.80980.21063
12-0.131678-1.020.155918
130.0105580.08180.467547
14-0.102847-0.79660.214399
150.06410.49650.310672
160.0831270.64390.261048
17-0.053338-0.41320.340483
18-0.015397-0.11930.452732
19-0.0936-0.7250.235627
20-0.077428-0.59980.275463
21-0.07799-0.60410.274025
22-0.040999-0.31760.375956
23-0.043928-0.34030.367423
240.0080990.06270.475094
250.0754930.58480.280448
26-0.038511-0.29830.383251
270.127950.99110.162809
28-0.003634-0.02820.488818
29-0.09106-0.70540.241661
30-0.062262-0.48230.315682
310.0287930.2230.412134
32-0.074997-0.58090.281734
33-0.059659-0.46210.322834
34-0.063571-0.49240.31211
350.0193150.14960.440785
36-0.057641-0.44650.328427
370.0734160.56870.28585
380.0586760.45450.325554
390.0772860.59870.275827
40-0.005384-0.04170.483435
41-0.073898-0.57240.28459
42-0.038792-0.30050.382424
430.0041820.03240.487133
440.0702170.54390.294262
45-0.060867-0.47150.319505
460.0121880.09440.46255
47-0.019821-0.15350.439248
48-0.092372-0.71550.238535

\begin{tabular}{lllllllll}
\hline
Partial Autocorrelation Function \tabularnewline
Time lag k & PACF(k) & T-STAT & P-value \tabularnewline
1 & 0.956895 & 7.4121 & 0 \tabularnewline
2 & -0.075419 & -0.5842 & 0.280641 \tabularnewline
3 & -0.105509 & -0.8173 & 0.208504 \tabularnewline
4 & 0.014645 & 0.1134 & 0.455031 \tabularnewline
5 & 0.011695 & 0.0906 & 0.464059 \tabularnewline
6 & 0.066691 & 0.5166 & 0.303673 \tabularnewline
7 & -0.093701 & -0.7258 & 0.23539 \tabularnewline
8 & 0.012751 & 0.0988 & 0.460825 \tabularnewline
9 & -0.075962 & -0.5884 & 0.279236 \tabularnewline
10 & -0.053252 & -0.4125 & 0.340726 \tabularnewline
11 & -0.104544 & -0.8098 & 0.21063 \tabularnewline
12 & -0.131678 & -1.02 & 0.155918 \tabularnewline
13 & 0.010558 & 0.0818 & 0.467547 \tabularnewline
14 & -0.102847 & -0.7966 & 0.214399 \tabularnewline
15 & 0.0641 & 0.4965 & 0.310672 \tabularnewline
16 & 0.083127 & 0.6439 & 0.261048 \tabularnewline
17 & -0.053338 & -0.4132 & 0.340483 \tabularnewline
18 & -0.015397 & -0.1193 & 0.452732 \tabularnewline
19 & -0.0936 & -0.725 & 0.235627 \tabularnewline
20 & -0.077428 & -0.5998 & 0.275463 \tabularnewline
21 & -0.07799 & -0.6041 & 0.274025 \tabularnewline
22 & -0.040999 & -0.3176 & 0.375956 \tabularnewline
23 & -0.043928 & -0.3403 & 0.367423 \tabularnewline
24 & 0.008099 & 0.0627 & 0.475094 \tabularnewline
25 & 0.075493 & 0.5848 & 0.280448 \tabularnewline
26 & -0.038511 & -0.2983 & 0.383251 \tabularnewline
27 & 0.12795 & 0.9911 & 0.162809 \tabularnewline
28 & -0.003634 & -0.0282 & 0.488818 \tabularnewline
29 & -0.09106 & -0.7054 & 0.241661 \tabularnewline
30 & -0.062262 & -0.4823 & 0.315682 \tabularnewline
31 & 0.028793 & 0.223 & 0.412134 \tabularnewline
32 & -0.074997 & -0.5809 & 0.281734 \tabularnewline
33 & -0.059659 & -0.4621 & 0.322834 \tabularnewline
34 & -0.063571 & -0.4924 & 0.31211 \tabularnewline
35 & 0.019315 & 0.1496 & 0.440785 \tabularnewline
36 & -0.057641 & -0.4465 & 0.328427 \tabularnewline
37 & 0.073416 & 0.5687 & 0.28585 \tabularnewline
38 & 0.058676 & 0.4545 & 0.325554 \tabularnewline
39 & 0.077286 & 0.5987 & 0.275827 \tabularnewline
40 & -0.005384 & -0.0417 & 0.483435 \tabularnewline
41 & -0.073898 & -0.5724 & 0.28459 \tabularnewline
42 & -0.038792 & -0.3005 & 0.382424 \tabularnewline
43 & 0.004182 & 0.0324 & 0.487133 \tabularnewline
44 & 0.070217 & 0.5439 & 0.294262 \tabularnewline
45 & -0.060867 & -0.4715 & 0.319505 \tabularnewline
46 & 0.012188 & 0.0944 & 0.46255 \tabularnewline
47 & -0.019821 & -0.1535 & 0.439248 \tabularnewline
48 & -0.092372 & -0.7155 & 0.238535 \tabularnewline
\hline
\end{tabular}
%Source: https://freestatistics.org/blog/index.php?pk=234779&T=2

[TABLE]
[ROW][C]Partial Autocorrelation Function[/C][/ROW]
[ROW][C]Time lag k[/C][C]PACF(k)[/C][C]T-STAT[/C][C]P-value[/C][/ROW]
[ROW][C]1[/C][C]0.956895[/C][C]7.4121[/C][C]0[/C][/ROW]
[ROW][C]2[/C][C]-0.075419[/C][C]-0.5842[/C][C]0.280641[/C][/ROW]
[ROW][C]3[/C][C]-0.105509[/C][C]-0.8173[/C][C]0.208504[/C][/ROW]
[ROW][C]4[/C][C]0.014645[/C][C]0.1134[/C][C]0.455031[/C][/ROW]
[ROW][C]5[/C][C]0.011695[/C][C]0.0906[/C][C]0.464059[/C][/ROW]
[ROW][C]6[/C][C]0.066691[/C][C]0.5166[/C][C]0.303673[/C][/ROW]
[ROW][C]7[/C][C]-0.093701[/C][C]-0.7258[/C][C]0.23539[/C][/ROW]
[ROW][C]8[/C][C]0.012751[/C][C]0.0988[/C][C]0.460825[/C][/ROW]
[ROW][C]9[/C][C]-0.075962[/C][C]-0.5884[/C][C]0.279236[/C][/ROW]
[ROW][C]10[/C][C]-0.053252[/C][C]-0.4125[/C][C]0.340726[/C][/ROW]
[ROW][C]11[/C][C]-0.104544[/C][C]-0.8098[/C][C]0.21063[/C][/ROW]
[ROW][C]12[/C][C]-0.131678[/C][C]-1.02[/C][C]0.155918[/C][/ROW]
[ROW][C]13[/C][C]0.010558[/C][C]0.0818[/C][C]0.467547[/C][/ROW]
[ROW][C]14[/C][C]-0.102847[/C][C]-0.7966[/C][C]0.214399[/C][/ROW]
[ROW][C]15[/C][C]0.0641[/C][C]0.4965[/C][C]0.310672[/C][/ROW]
[ROW][C]16[/C][C]0.083127[/C][C]0.6439[/C][C]0.261048[/C][/ROW]
[ROW][C]17[/C][C]-0.053338[/C][C]-0.4132[/C][C]0.340483[/C][/ROW]
[ROW][C]18[/C][C]-0.015397[/C][C]-0.1193[/C][C]0.452732[/C][/ROW]
[ROW][C]19[/C][C]-0.0936[/C][C]-0.725[/C][C]0.235627[/C][/ROW]
[ROW][C]20[/C][C]-0.077428[/C][C]-0.5998[/C][C]0.275463[/C][/ROW]
[ROW][C]21[/C][C]-0.07799[/C][C]-0.6041[/C][C]0.274025[/C][/ROW]
[ROW][C]22[/C][C]-0.040999[/C][C]-0.3176[/C][C]0.375956[/C][/ROW]
[ROW][C]23[/C][C]-0.043928[/C][C]-0.3403[/C][C]0.367423[/C][/ROW]
[ROW][C]24[/C][C]0.008099[/C][C]0.0627[/C][C]0.475094[/C][/ROW]
[ROW][C]25[/C][C]0.075493[/C][C]0.5848[/C][C]0.280448[/C][/ROW]
[ROW][C]26[/C][C]-0.038511[/C][C]-0.2983[/C][C]0.383251[/C][/ROW]
[ROW][C]27[/C][C]0.12795[/C][C]0.9911[/C][C]0.162809[/C][/ROW]
[ROW][C]28[/C][C]-0.003634[/C][C]-0.0282[/C][C]0.488818[/C][/ROW]
[ROW][C]29[/C][C]-0.09106[/C][C]-0.7054[/C][C]0.241661[/C][/ROW]
[ROW][C]30[/C][C]-0.062262[/C][C]-0.4823[/C][C]0.315682[/C][/ROW]
[ROW][C]31[/C][C]0.028793[/C][C]0.223[/C][C]0.412134[/C][/ROW]
[ROW][C]32[/C][C]-0.074997[/C][C]-0.5809[/C][C]0.281734[/C][/ROW]
[ROW][C]33[/C][C]-0.059659[/C][C]-0.4621[/C][C]0.322834[/C][/ROW]
[ROW][C]34[/C][C]-0.063571[/C][C]-0.4924[/C][C]0.31211[/C][/ROW]
[ROW][C]35[/C][C]0.019315[/C][C]0.1496[/C][C]0.440785[/C][/ROW]
[ROW][C]36[/C][C]-0.057641[/C][C]-0.4465[/C][C]0.328427[/C][/ROW]
[ROW][C]37[/C][C]0.073416[/C][C]0.5687[/C][C]0.28585[/C][/ROW]
[ROW][C]38[/C][C]0.058676[/C][C]0.4545[/C][C]0.325554[/C][/ROW]
[ROW][C]39[/C][C]0.077286[/C][C]0.5987[/C][C]0.275827[/C][/ROW]
[ROW][C]40[/C][C]-0.005384[/C][C]-0.0417[/C][C]0.483435[/C][/ROW]
[ROW][C]41[/C][C]-0.073898[/C][C]-0.5724[/C][C]0.28459[/C][/ROW]
[ROW][C]42[/C][C]-0.038792[/C][C]-0.3005[/C][C]0.382424[/C][/ROW]
[ROW][C]43[/C][C]0.004182[/C][C]0.0324[/C][C]0.487133[/C][/ROW]
[ROW][C]44[/C][C]0.070217[/C][C]0.5439[/C][C]0.294262[/C][/ROW]
[ROW][C]45[/C][C]-0.060867[/C][C]-0.4715[/C][C]0.319505[/C][/ROW]
[ROW][C]46[/C][C]0.012188[/C][C]0.0944[/C][C]0.46255[/C][/ROW]
[ROW][C]47[/C][C]-0.019821[/C][C]-0.1535[/C][C]0.439248[/C][/ROW]
[ROW][C]48[/C][C]-0.092372[/C][C]-0.7155[/C][C]0.238535[/C][/ROW]
[/TABLE]
Source: https://freestatistics.org/blog/index.php?pk=234779&T=2

Globally Unique Identifier (entire table): ba.freestatistics.org/blog/index.php?pk=234779&T=2

As an alternative you can also use a QR Code:  

The GUIDs for individual cells are displayed in the table below:

Partial Autocorrelation Function
Time lag kPACF(k)T-STATP-value
10.9568957.41210
2-0.075419-0.58420.280641
3-0.105509-0.81730.208504
40.0146450.11340.455031
50.0116950.09060.464059
60.0666910.51660.303673
7-0.093701-0.72580.23539
80.0127510.09880.460825
9-0.075962-0.58840.279236
10-0.053252-0.41250.340726
11-0.104544-0.80980.21063
12-0.131678-1.020.155918
130.0105580.08180.467547
14-0.102847-0.79660.214399
150.06410.49650.310672
160.0831270.64390.261048
17-0.053338-0.41320.340483
18-0.015397-0.11930.452732
19-0.0936-0.7250.235627
20-0.077428-0.59980.275463
21-0.07799-0.60410.274025
22-0.040999-0.31760.375956
23-0.043928-0.34030.367423
240.0080990.06270.475094
250.0754930.58480.280448
26-0.038511-0.29830.383251
270.127950.99110.162809
28-0.003634-0.02820.488818
29-0.09106-0.70540.241661
30-0.062262-0.48230.315682
310.0287930.2230.412134
32-0.074997-0.58090.281734
33-0.059659-0.46210.322834
34-0.063571-0.49240.31211
350.0193150.14960.440785
36-0.057641-0.44650.328427
370.0734160.56870.28585
380.0586760.45450.325554
390.0772860.59870.275827
40-0.005384-0.04170.483435
41-0.073898-0.57240.28459
42-0.038792-0.30050.382424
430.0041820.03240.487133
440.0702170.54390.294262
45-0.060867-0.47150.319505
460.0121880.09440.46255
47-0.019821-0.15350.439248
48-0.092372-0.71550.238535


Parameters (Session):
par1 = 48 ; par2 = 1 ; par3 = 0 ; par4 = 0 ; par5 = 12 ; par6 = White Noise ; par7 = 0.95 ;
Parameters (R input):
par1 = 48 ; par2 = 1 ; par3 = 0 ; par4 = 0 ; par5 = 12 ; par6 = White Noise ; par7 = 0.95 ; par8 = ;
R code (references can be found in the software module):
if (par1 == 'Default') {
par1 = 10*log10(length(x))
} else {
par1 <- as.numeric(par1)
}
par2 <- as.numeric(par2)
par3 <- as.numeric(par3)
par4 <- as.numeric(par4)
par5 <- as.numeric(par5)
if (par6 == 'White Noise') par6 <- 'white' else par6 <- 'ma'
par7 <- as.numeric(par7)
if (par8 != '') par8 <- as.numeric(par8)
ox <- x
if (par8 == '') {
if (par2 == 0) {
x <- log(x)
} else {
x <- (x ^ par2 - 1) / par2
}
} else {
x <- log(x,base=par8)
}
if (par3 > 0) x <- diff(x,lag=1,difference=par3)
if (par4 > 0) x <- diff(x,lag=par5,difference=par4)
bitmap(file='picts.png')
op <- par(mfrow=c(2,1))
plot(ox,type='l',main='Original Time Series',xlab='time',ylab='value')
if (par8=='') {
mytitle <- paste('Working Time Series (lambda=',par2,', d=',par3,', D=',par4,')',sep='')
mysub <- paste('(lambda=',par2,', d=',par3,', D=',par4,', CI=', par7, ', CI type=',par6,')',sep='')
} else {
mytitle <- paste('Working Time Series (base=',par8,', d=',par3,', D=',par4,')',sep='')
mysub <- paste('(base=',par8,', d=',par3,', D=',par4,', CI=', par7, ', CI type=',par6,')',sep='')
}
plot(x,type='l', main=mytitle,xlab='time',ylab='value')
par(op)
dev.off()
bitmap(file='pic1.png')
racf <- acf(x, par1, main='Autocorrelation', xlab='time lag', ylab='ACF', ci.type=par6, ci=par7, sub=mysub)
dev.off()
bitmap(file='pic2.png')
rpacf <- pacf(x,par1,main='Partial Autocorrelation',xlab='lags',ylab='PACF',sub=mysub)
dev.off()
(myacf <- c(racf$acf))
(mypacf <- c(rpacf$acf))
lengthx <- length(x)
sqrtn <- sqrt(lengthx)
load(file='createtable')
a<-table.start()
a<-table.row.start(a)
a<-table.element(a,'Autocorrelation Function',4,TRUE)
a<-table.row.end(a)
a<-table.row.start(a)
a<-table.element(a,'Time lag k',header=TRUE)
a<-table.element(a,hyperlink('basics.htm','ACF(k)','click here for more information about the Autocorrelation Function'),header=TRUE)
a<-table.element(a,'T-STAT',header=TRUE)
a<-table.element(a,'P-value',header=TRUE)
a<-table.row.end(a)
for (i in 2:(par1+1)) {
a<-table.row.start(a)
a<-table.element(a,i-1,header=TRUE)
a<-table.element(a,round(myacf[i],6))
mytstat <- myacf[i]*sqrtn
a<-table.element(a,round(mytstat,4))
a<-table.element(a,round(1-pt(abs(mytstat),lengthx),6))
a<-table.row.end(a)
}
a<-table.end(a)
table.save(a,file='mytable.tab')
a<-table.start()
a<-table.row.start(a)
a<-table.element(a,'Partial Autocorrelation Function',4,TRUE)
a<-table.row.end(a)
a<-table.row.start(a)
a<-table.element(a,'Time lag k',header=TRUE)
a<-table.element(a,hyperlink('basics.htm','PACF(k)','click here for more information about the Partial Autocorrelation Function'),header=TRUE)
a<-table.element(a,'T-STAT',header=TRUE)
a<-table.element(a,'P-value',header=TRUE)
a<-table.row.end(a)
for (i in 1:par1) {
a<-table.row.start(a)
a<-table.element(a,i,header=TRUE)
a<-table.element(a,round(mypacf[i],6))
mytstat <- mypacf[i]*sqrtn
a<-table.element(a,round(mytstat,4))
a<-table.element(a,round(1-pt(abs(mytstat),lengthx),6))
a<-table.row.end(a)
}
a<-table.end(a)
table.save(a,file='mytable1.tab')