Free Statistics

of Irreproducible Research!

Author's title

Author*Unverified author*
R Software Modulerwasp_autocorrelation.wasp
Title produced by software(Partial) Autocorrelation Function
Date of computationSat, 10 May 2014 16:34:27 -0400
Cite this page as followsStatistical Computations at FreeStatistics.org, Office for Research Development and Education, URL https://freestatistics.org/blog/index.php?v=date/2014/May/10/t1399754110479a1vzlevoe1mj.htm/, Retrieved Tue, 14 May 2024 12:59:57 +0000
Statistical Computations at FreeStatistics.org, Office for Research Development and Education, URL https://freestatistics.org/blog/index.php?pk=234780, Retrieved Tue, 14 May 2024 12:59:57 +0000
QR Codes:

Original text written by user:
IsPrivate?No (this computation is public)
User-defined keywords
Estimated Impact189
Family? (F = Feedback message, R = changed R code, M = changed R Module, P = changed Parameters, D = changed Data)
-       [(Partial) Autocorrelation Function] [] [2014-05-10 20:34:27] [a3f6f3ab25c27d7686091f6989fa462a] [Current]
- RM      [(Partial) Autocorrelation Function] [] [2014-05-22 23:21:43] [db363657be53a1294332fdf107f4512c]
Feedback Forum

Post a new message
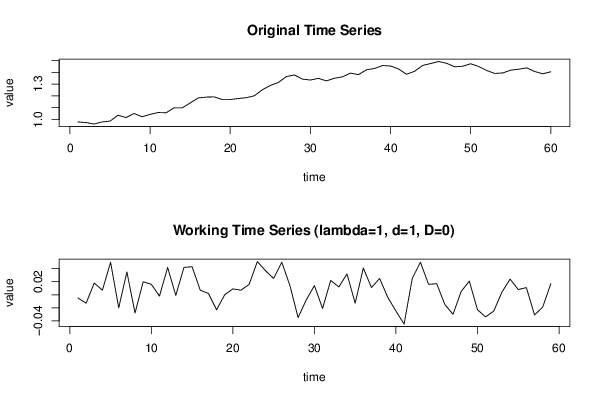
Dataseries X:
0.978
0.973
0.96
0.978
0.985
1.035
1.015
1.05
1.022
1.042
1.058
1.056
1.098
1.097
1.139
1.182
1.189
1.191
1.168
1.168
1.177
1.184
1.2
1.251
1.288
1.313
1.363
1.377
1.342
1.334
1.348
1.327
1.349
1.361
1.393
1.38
1.421
1.432
1.457
1.453
1.428
1.383
1.408
1.458
1.474
1.491
1.476
1.446
1.451
1.472
1.449
1.415
1.39
1.394
1.418
1.426
1.437
1.406
1.387
1.404


Summary of computational transaction
Raw Inputview raw input (R code)
Raw Outputview raw output of R engine
Computing time2 seconds
R Server'Herman Ole Andreas Wold' @ wold.wessa.net

\begin{tabular}{lllllllll}
\hline
Summary of computational transaction \tabularnewline
Raw Input & view raw input (R code)  \tabularnewline
Raw Output & view raw output of R engine  \tabularnewline
Computing time & 2 seconds \tabularnewline
R Server & 'Herman Ole Andreas Wold' @ wold.wessa.net \tabularnewline
\hline
\end{tabular}
%Source: https://freestatistics.org/blog/index.php?pk=234780&T=0

[TABLE]
[ROW][C]Summary of computational transaction[/C][/ROW]
[ROW][C]Raw Input[/C][C]view raw input (R code) [/C][/ROW]
[ROW][C]Raw Output[/C][C]view raw output of R engine [/C][/ROW]
[ROW][C]Computing time[/C][C]2 seconds[/C][/ROW]
[ROW][C]R Server[/C][C]'Herman Ole Andreas Wold' @ wold.wessa.net[/C][/ROW]
[/TABLE]
Source: https://freestatistics.org/blog/index.php?pk=234780&T=0

Globally Unique Identifier (entire table): ba.freestatistics.org/blog/index.php?pk=234780&T=0

As an alternative you can also use a QR Code:  

The GUIDs for individual cells are displayed in the table below:

Summary of computational transaction
Raw Inputview raw input (R code)
Raw Outputview raw output of R engine
Computing time2 seconds
R Server'Herman Ole Andreas Wold' @ wold.wessa.net


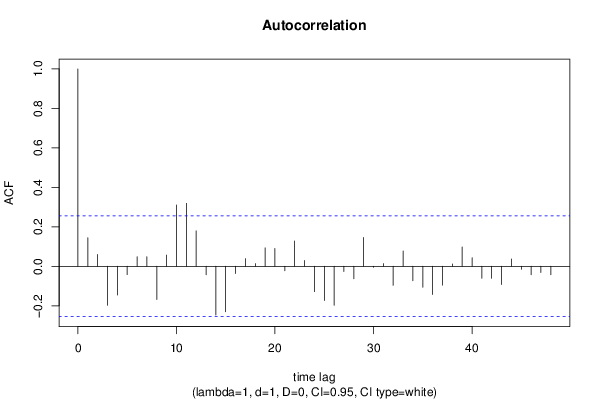
Autocorrelation Function
Time lag kACF(k)T-STATP-value
10.1448791.11280.135146
20.0596810.45840.324167
3-0.197642-1.51810.067163
4-0.145275-1.11590.134499
5-0.042288-0.32480.373233
60.0481090.36950.356526
70.0486010.37330.355127
8-0.167896-1.28960.101105
90.0568270.43650.332036
100.3109762.38870.010064
110.3188382.4490.008657
120.1796741.38010.086382
13-0.042688-0.32790.372078
14-0.246828-1.89590.031436
15-0.230795-1.77280.040714
16-0.03641-0.27970.390355
170.0389880.29950.382816
180.0135010.10370.458879
190.0935650.71870.237587
200.0898840.69040.246322
21-0.022508-0.17290.431666
220.1278720.98220.165006
230.0292560.22470.411487
24-0.128422-0.98640.163976
25-0.173483-1.33250.093903
26-0.197769-1.51910.06704
27-0.026663-0.20480.419216
28-0.062808-0.48240.315641
290.1459611.12110.133384
30-0.004618-0.03550.485912
310.0134820.10360.458936
32-0.096558-0.74170.230613
330.0777590.59730.276302
34-0.073104-0.56150.288284
35-0.106445-0.81760.208432
36-0.143039-1.09870.13818
37-0.095611-0.73440.232807
380.0113280.0870.465479
390.097690.75040.228007
400.0432150.33190.370556
41-0.060939-0.46810.320726
42-0.060817-0.46710.321057
43-0.09191-0.7060.241491
440.0370030.28420.388616
45-0.015282-0.11740.453479
46-0.042501-0.32650.372617
47-0.03171-0.24360.404204
48-0.042522-0.32660.372557

\begin{tabular}{lllllllll}
\hline
Autocorrelation Function \tabularnewline
Time lag k & ACF(k) & T-STAT & P-value \tabularnewline
1 & 0.144879 & 1.1128 & 0.135146 \tabularnewline
2 & 0.059681 & 0.4584 & 0.324167 \tabularnewline
3 & -0.197642 & -1.5181 & 0.067163 \tabularnewline
4 & -0.145275 & -1.1159 & 0.134499 \tabularnewline
5 & -0.042288 & -0.3248 & 0.373233 \tabularnewline
6 & 0.048109 & 0.3695 & 0.356526 \tabularnewline
7 & 0.048601 & 0.3733 & 0.355127 \tabularnewline
8 & -0.167896 & -1.2896 & 0.101105 \tabularnewline
9 & 0.056827 & 0.4365 & 0.332036 \tabularnewline
10 & 0.310976 & 2.3887 & 0.010064 \tabularnewline
11 & 0.318838 & 2.449 & 0.008657 \tabularnewline
12 & 0.179674 & 1.3801 & 0.086382 \tabularnewline
13 & -0.042688 & -0.3279 & 0.372078 \tabularnewline
14 & -0.246828 & -1.8959 & 0.031436 \tabularnewline
15 & -0.230795 & -1.7728 & 0.040714 \tabularnewline
16 & -0.03641 & -0.2797 & 0.390355 \tabularnewline
17 & 0.038988 & 0.2995 & 0.382816 \tabularnewline
18 & 0.013501 & 0.1037 & 0.458879 \tabularnewline
19 & 0.093565 & 0.7187 & 0.237587 \tabularnewline
20 & 0.089884 & 0.6904 & 0.246322 \tabularnewline
21 & -0.022508 & -0.1729 & 0.431666 \tabularnewline
22 & 0.127872 & 0.9822 & 0.165006 \tabularnewline
23 & 0.029256 & 0.2247 & 0.411487 \tabularnewline
24 & -0.128422 & -0.9864 & 0.163976 \tabularnewline
25 & -0.173483 & -1.3325 & 0.093903 \tabularnewline
26 & -0.197769 & -1.5191 & 0.06704 \tabularnewline
27 & -0.026663 & -0.2048 & 0.419216 \tabularnewline
28 & -0.062808 & -0.4824 & 0.315641 \tabularnewline
29 & 0.145961 & 1.1211 & 0.133384 \tabularnewline
30 & -0.004618 & -0.0355 & 0.485912 \tabularnewline
31 & 0.013482 & 0.1036 & 0.458936 \tabularnewline
32 & -0.096558 & -0.7417 & 0.230613 \tabularnewline
33 & 0.077759 & 0.5973 & 0.276302 \tabularnewline
34 & -0.073104 & -0.5615 & 0.288284 \tabularnewline
35 & -0.106445 & -0.8176 & 0.208432 \tabularnewline
36 & -0.143039 & -1.0987 & 0.13818 \tabularnewline
37 & -0.095611 & -0.7344 & 0.232807 \tabularnewline
38 & 0.011328 & 0.087 & 0.465479 \tabularnewline
39 & 0.09769 & 0.7504 & 0.228007 \tabularnewline
40 & 0.043215 & 0.3319 & 0.370556 \tabularnewline
41 & -0.060939 & -0.4681 & 0.320726 \tabularnewline
42 & -0.060817 & -0.4671 & 0.321057 \tabularnewline
43 & -0.09191 & -0.706 & 0.241491 \tabularnewline
44 & 0.037003 & 0.2842 & 0.388616 \tabularnewline
45 & -0.015282 & -0.1174 & 0.453479 \tabularnewline
46 & -0.042501 & -0.3265 & 0.372617 \tabularnewline
47 & -0.03171 & -0.2436 & 0.404204 \tabularnewline
48 & -0.042522 & -0.3266 & 0.372557 \tabularnewline
\hline
\end{tabular}
%Source: https://freestatistics.org/blog/index.php?pk=234780&T=1

[TABLE]
[ROW][C]Autocorrelation Function[/C][/ROW]
[ROW][C]Time lag k[/C][C]ACF(k)[/C][C]T-STAT[/C][C]P-value[/C][/ROW]
[ROW][C]1[/C][C]0.144879[/C][C]1.1128[/C][C]0.135146[/C][/ROW]
[ROW][C]2[/C][C]0.059681[/C][C]0.4584[/C][C]0.324167[/C][/ROW]
[ROW][C]3[/C][C]-0.197642[/C][C]-1.5181[/C][C]0.067163[/C][/ROW]
[ROW][C]4[/C][C]-0.145275[/C][C]-1.1159[/C][C]0.134499[/C][/ROW]
[ROW][C]5[/C][C]-0.042288[/C][C]-0.3248[/C][C]0.373233[/C][/ROW]
[ROW][C]6[/C][C]0.048109[/C][C]0.3695[/C][C]0.356526[/C][/ROW]
[ROW][C]7[/C][C]0.048601[/C][C]0.3733[/C][C]0.355127[/C][/ROW]
[ROW][C]8[/C][C]-0.167896[/C][C]-1.2896[/C][C]0.101105[/C][/ROW]
[ROW][C]9[/C][C]0.056827[/C][C]0.4365[/C][C]0.332036[/C][/ROW]
[ROW][C]10[/C][C]0.310976[/C][C]2.3887[/C][C]0.010064[/C][/ROW]
[ROW][C]11[/C][C]0.318838[/C][C]2.449[/C][C]0.008657[/C][/ROW]
[ROW][C]12[/C][C]0.179674[/C][C]1.3801[/C][C]0.086382[/C][/ROW]
[ROW][C]13[/C][C]-0.042688[/C][C]-0.3279[/C][C]0.372078[/C][/ROW]
[ROW][C]14[/C][C]-0.246828[/C][C]-1.8959[/C][C]0.031436[/C][/ROW]
[ROW][C]15[/C][C]-0.230795[/C][C]-1.7728[/C][C]0.040714[/C][/ROW]
[ROW][C]16[/C][C]-0.03641[/C][C]-0.2797[/C][C]0.390355[/C][/ROW]
[ROW][C]17[/C][C]0.038988[/C][C]0.2995[/C][C]0.382816[/C][/ROW]
[ROW][C]18[/C][C]0.013501[/C][C]0.1037[/C][C]0.458879[/C][/ROW]
[ROW][C]19[/C][C]0.093565[/C][C]0.7187[/C][C]0.237587[/C][/ROW]
[ROW][C]20[/C][C]0.089884[/C][C]0.6904[/C][C]0.246322[/C][/ROW]
[ROW][C]21[/C][C]-0.022508[/C][C]-0.1729[/C][C]0.431666[/C][/ROW]
[ROW][C]22[/C][C]0.127872[/C][C]0.9822[/C][C]0.165006[/C][/ROW]
[ROW][C]23[/C][C]0.029256[/C][C]0.2247[/C][C]0.411487[/C][/ROW]
[ROW][C]24[/C][C]-0.128422[/C][C]-0.9864[/C][C]0.163976[/C][/ROW]
[ROW][C]25[/C][C]-0.173483[/C][C]-1.3325[/C][C]0.093903[/C][/ROW]
[ROW][C]26[/C][C]-0.197769[/C][C]-1.5191[/C][C]0.06704[/C][/ROW]
[ROW][C]27[/C][C]-0.026663[/C][C]-0.2048[/C][C]0.419216[/C][/ROW]
[ROW][C]28[/C][C]-0.062808[/C][C]-0.4824[/C][C]0.315641[/C][/ROW]
[ROW][C]29[/C][C]0.145961[/C][C]1.1211[/C][C]0.133384[/C][/ROW]
[ROW][C]30[/C][C]-0.004618[/C][C]-0.0355[/C][C]0.485912[/C][/ROW]
[ROW][C]31[/C][C]0.013482[/C][C]0.1036[/C][C]0.458936[/C][/ROW]
[ROW][C]32[/C][C]-0.096558[/C][C]-0.7417[/C][C]0.230613[/C][/ROW]
[ROW][C]33[/C][C]0.077759[/C][C]0.5973[/C][C]0.276302[/C][/ROW]
[ROW][C]34[/C][C]-0.073104[/C][C]-0.5615[/C][C]0.288284[/C][/ROW]
[ROW][C]35[/C][C]-0.106445[/C][C]-0.8176[/C][C]0.208432[/C][/ROW]
[ROW][C]36[/C][C]-0.143039[/C][C]-1.0987[/C][C]0.13818[/C][/ROW]
[ROW][C]37[/C][C]-0.095611[/C][C]-0.7344[/C][C]0.232807[/C][/ROW]
[ROW][C]38[/C][C]0.011328[/C][C]0.087[/C][C]0.465479[/C][/ROW]
[ROW][C]39[/C][C]0.09769[/C][C]0.7504[/C][C]0.228007[/C][/ROW]
[ROW][C]40[/C][C]0.043215[/C][C]0.3319[/C][C]0.370556[/C][/ROW]
[ROW][C]41[/C][C]-0.060939[/C][C]-0.4681[/C][C]0.320726[/C][/ROW]
[ROW][C]42[/C][C]-0.060817[/C][C]-0.4671[/C][C]0.321057[/C][/ROW]
[ROW][C]43[/C][C]-0.09191[/C][C]-0.706[/C][C]0.241491[/C][/ROW]
[ROW][C]44[/C][C]0.037003[/C][C]0.2842[/C][C]0.388616[/C][/ROW]
[ROW][C]45[/C][C]-0.015282[/C][C]-0.1174[/C][C]0.453479[/C][/ROW]
[ROW][C]46[/C][C]-0.042501[/C][C]-0.3265[/C][C]0.372617[/C][/ROW]
[ROW][C]47[/C][C]-0.03171[/C][C]-0.2436[/C][C]0.404204[/C][/ROW]
[ROW][C]48[/C][C]-0.042522[/C][C]-0.3266[/C][C]0.372557[/C][/ROW]
[/TABLE]
Source: https://freestatistics.org/blog/index.php?pk=234780&T=1

Globally Unique Identifier (entire table): ba.freestatistics.org/blog/index.php?pk=234780&T=1

As an alternative you can also use a QR Code:  

The GUIDs for individual cells are displayed in the table below:

Autocorrelation Function
Time lag kACF(k)T-STATP-value
10.1448791.11280.135146
20.0596810.45840.324167
3-0.197642-1.51810.067163
4-0.145275-1.11590.134499
5-0.042288-0.32480.373233
60.0481090.36950.356526
70.0486010.37330.355127
8-0.167896-1.28960.101105
90.0568270.43650.332036
100.3109762.38870.010064
110.3188382.4490.008657
120.1796741.38010.086382
13-0.042688-0.32790.372078
14-0.246828-1.89590.031436
15-0.230795-1.77280.040714
16-0.03641-0.27970.390355
170.0389880.29950.382816
180.0135010.10370.458879
190.0935650.71870.237587
200.0898840.69040.246322
21-0.022508-0.17290.431666
220.1278720.98220.165006
230.0292560.22470.411487
24-0.128422-0.98640.163976
25-0.173483-1.33250.093903
26-0.197769-1.51910.06704
27-0.026663-0.20480.419216
28-0.062808-0.48240.315641
290.1459611.12110.133384
30-0.004618-0.03550.485912
310.0134820.10360.458936
32-0.096558-0.74170.230613
330.0777590.59730.276302
34-0.073104-0.56150.288284
35-0.106445-0.81760.208432
36-0.143039-1.09870.13818
37-0.095611-0.73440.232807
380.0113280.0870.465479
390.097690.75040.228007
400.0432150.33190.370556
41-0.060939-0.46810.320726
42-0.060817-0.46710.321057
43-0.09191-0.7060.241491
440.0370030.28420.388616
45-0.015282-0.11740.453479
46-0.042501-0.32650.372617
47-0.03171-0.24360.404204
48-0.042522-0.32660.372557


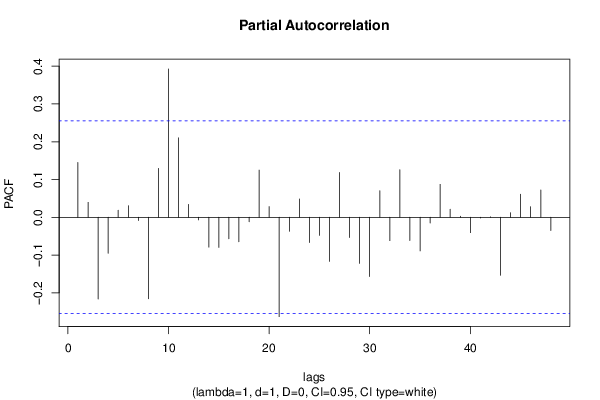
Partial Autocorrelation Function
Time lag kPACF(k)T-STATP-value
10.1448791.11280.135146
20.0395210.30360.381263
3-0.216549-1.66330.050773
4-0.095385-0.73270.233332
50.018580.14270.443501
60.0303790.23330.408152
7-0.008517-0.06540.47403
8-0.215789-1.65750.051363
90.1294340.99420.162093
100.3927313.01660.001884
110.2103361.61560.055756
120.0341260.26210.397069
13-0.006851-0.05260.479105
14-0.078971-0.60660.273225
15-0.079696-0.61220.271392
16-0.056939-0.43740.331726
17-0.06491-0.49860.309962
18-0.012023-0.09230.463368
190.1249130.95950.170617
200.0283040.21740.414322
21-0.26305-2.02050.023938
22-0.037079-0.28480.388393
230.0484950.37250.35543
24-0.066906-0.51390.304614
25-0.0479-0.36790.357122
26-0.116699-0.89640.186845
270.1185740.91080.183058
28-0.053553-0.41140.341153
29-0.121978-0.93690.176307
30-0.156805-1.20440.116614
310.0701910.53910.295908
32-0.06174-0.47420.318542
330.1261120.96870.168328
34-0.061343-0.47120.319623
35-0.088992-0.68360.248465
36-0.015029-0.11540.454244
370.0872040.66980.252791
380.0214090.16440.43497
390.0027930.02150.491479
40-0.040569-0.31160.378214
41-0.002058-0.01580.493721
420.0011570.00890.496468
43-0.153351-1.17790.121781
440.0121830.09360.462879
450.0612440.47040.319893
460.0279710.21490.415312
470.0722440.55490.290524
48-0.035014-0.26890.394454

\begin{tabular}{lllllllll}
\hline
Partial Autocorrelation Function \tabularnewline
Time lag k & PACF(k) & T-STAT & P-value \tabularnewline
1 & 0.144879 & 1.1128 & 0.135146 \tabularnewline
2 & 0.039521 & 0.3036 & 0.381263 \tabularnewline
3 & -0.216549 & -1.6633 & 0.050773 \tabularnewline
4 & -0.095385 & -0.7327 & 0.233332 \tabularnewline
5 & 0.01858 & 0.1427 & 0.443501 \tabularnewline
6 & 0.030379 & 0.2333 & 0.408152 \tabularnewline
7 & -0.008517 & -0.0654 & 0.47403 \tabularnewline
8 & -0.215789 & -1.6575 & 0.051363 \tabularnewline
9 & 0.129434 & 0.9942 & 0.162093 \tabularnewline
10 & 0.392731 & 3.0166 & 0.001884 \tabularnewline
11 & 0.210336 & 1.6156 & 0.055756 \tabularnewline
12 & 0.034126 & 0.2621 & 0.397069 \tabularnewline
13 & -0.006851 & -0.0526 & 0.479105 \tabularnewline
14 & -0.078971 & -0.6066 & 0.273225 \tabularnewline
15 & -0.079696 & -0.6122 & 0.271392 \tabularnewline
16 & -0.056939 & -0.4374 & 0.331726 \tabularnewline
17 & -0.06491 & -0.4986 & 0.309962 \tabularnewline
18 & -0.012023 & -0.0923 & 0.463368 \tabularnewline
19 & 0.124913 & 0.9595 & 0.170617 \tabularnewline
20 & 0.028304 & 0.2174 & 0.414322 \tabularnewline
21 & -0.26305 & -2.0205 & 0.023938 \tabularnewline
22 & -0.037079 & -0.2848 & 0.388393 \tabularnewline
23 & 0.048495 & 0.3725 & 0.35543 \tabularnewline
24 & -0.066906 & -0.5139 & 0.304614 \tabularnewline
25 & -0.0479 & -0.3679 & 0.357122 \tabularnewline
26 & -0.116699 & -0.8964 & 0.186845 \tabularnewline
27 & 0.118574 & 0.9108 & 0.183058 \tabularnewline
28 & -0.053553 & -0.4114 & 0.341153 \tabularnewline
29 & -0.121978 & -0.9369 & 0.176307 \tabularnewline
30 & -0.156805 & -1.2044 & 0.116614 \tabularnewline
31 & 0.070191 & 0.5391 & 0.295908 \tabularnewline
32 & -0.06174 & -0.4742 & 0.318542 \tabularnewline
33 & 0.126112 & 0.9687 & 0.168328 \tabularnewline
34 & -0.061343 & -0.4712 & 0.319623 \tabularnewline
35 & -0.088992 & -0.6836 & 0.248465 \tabularnewline
36 & -0.015029 & -0.1154 & 0.454244 \tabularnewline
37 & 0.087204 & 0.6698 & 0.252791 \tabularnewline
38 & 0.021409 & 0.1644 & 0.43497 \tabularnewline
39 & 0.002793 & 0.0215 & 0.491479 \tabularnewline
40 & -0.040569 & -0.3116 & 0.378214 \tabularnewline
41 & -0.002058 & -0.0158 & 0.493721 \tabularnewline
42 & 0.001157 & 0.0089 & 0.496468 \tabularnewline
43 & -0.153351 & -1.1779 & 0.121781 \tabularnewline
44 & 0.012183 & 0.0936 & 0.462879 \tabularnewline
45 & 0.061244 & 0.4704 & 0.319893 \tabularnewline
46 & 0.027971 & 0.2149 & 0.415312 \tabularnewline
47 & 0.072244 & 0.5549 & 0.290524 \tabularnewline
48 & -0.035014 & -0.2689 & 0.394454 \tabularnewline
\hline
\end{tabular}
%Source: https://freestatistics.org/blog/index.php?pk=234780&T=2

[TABLE]
[ROW][C]Partial Autocorrelation Function[/C][/ROW]
[ROW][C]Time lag k[/C][C]PACF(k)[/C][C]T-STAT[/C][C]P-value[/C][/ROW]
[ROW][C]1[/C][C]0.144879[/C][C]1.1128[/C][C]0.135146[/C][/ROW]
[ROW][C]2[/C][C]0.039521[/C][C]0.3036[/C][C]0.381263[/C][/ROW]
[ROW][C]3[/C][C]-0.216549[/C][C]-1.6633[/C][C]0.050773[/C][/ROW]
[ROW][C]4[/C][C]-0.095385[/C][C]-0.7327[/C][C]0.233332[/C][/ROW]
[ROW][C]5[/C][C]0.01858[/C][C]0.1427[/C][C]0.443501[/C][/ROW]
[ROW][C]6[/C][C]0.030379[/C][C]0.2333[/C][C]0.408152[/C][/ROW]
[ROW][C]7[/C][C]-0.008517[/C][C]-0.0654[/C][C]0.47403[/C][/ROW]
[ROW][C]8[/C][C]-0.215789[/C][C]-1.6575[/C][C]0.051363[/C][/ROW]
[ROW][C]9[/C][C]0.129434[/C][C]0.9942[/C][C]0.162093[/C][/ROW]
[ROW][C]10[/C][C]0.392731[/C][C]3.0166[/C][C]0.001884[/C][/ROW]
[ROW][C]11[/C][C]0.210336[/C][C]1.6156[/C][C]0.055756[/C][/ROW]
[ROW][C]12[/C][C]0.034126[/C][C]0.2621[/C][C]0.397069[/C][/ROW]
[ROW][C]13[/C][C]-0.006851[/C][C]-0.0526[/C][C]0.479105[/C][/ROW]
[ROW][C]14[/C][C]-0.078971[/C][C]-0.6066[/C][C]0.273225[/C][/ROW]
[ROW][C]15[/C][C]-0.079696[/C][C]-0.6122[/C][C]0.271392[/C][/ROW]
[ROW][C]16[/C][C]-0.056939[/C][C]-0.4374[/C][C]0.331726[/C][/ROW]
[ROW][C]17[/C][C]-0.06491[/C][C]-0.4986[/C][C]0.309962[/C][/ROW]
[ROW][C]18[/C][C]-0.012023[/C][C]-0.0923[/C][C]0.463368[/C][/ROW]
[ROW][C]19[/C][C]0.124913[/C][C]0.9595[/C][C]0.170617[/C][/ROW]
[ROW][C]20[/C][C]0.028304[/C][C]0.2174[/C][C]0.414322[/C][/ROW]
[ROW][C]21[/C][C]-0.26305[/C][C]-2.0205[/C][C]0.023938[/C][/ROW]
[ROW][C]22[/C][C]-0.037079[/C][C]-0.2848[/C][C]0.388393[/C][/ROW]
[ROW][C]23[/C][C]0.048495[/C][C]0.3725[/C][C]0.35543[/C][/ROW]
[ROW][C]24[/C][C]-0.066906[/C][C]-0.5139[/C][C]0.304614[/C][/ROW]
[ROW][C]25[/C][C]-0.0479[/C][C]-0.3679[/C][C]0.357122[/C][/ROW]
[ROW][C]26[/C][C]-0.116699[/C][C]-0.8964[/C][C]0.186845[/C][/ROW]
[ROW][C]27[/C][C]0.118574[/C][C]0.9108[/C][C]0.183058[/C][/ROW]
[ROW][C]28[/C][C]-0.053553[/C][C]-0.4114[/C][C]0.341153[/C][/ROW]
[ROW][C]29[/C][C]-0.121978[/C][C]-0.9369[/C][C]0.176307[/C][/ROW]
[ROW][C]30[/C][C]-0.156805[/C][C]-1.2044[/C][C]0.116614[/C][/ROW]
[ROW][C]31[/C][C]0.070191[/C][C]0.5391[/C][C]0.295908[/C][/ROW]
[ROW][C]32[/C][C]-0.06174[/C][C]-0.4742[/C][C]0.318542[/C][/ROW]
[ROW][C]33[/C][C]0.126112[/C][C]0.9687[/C][C]0.168328[/C][/ROW]
[ROW][C]34[/C][C]-0.061343[/C][C]-0.4712[/C][C]0.319623[/C][/ROW]
[ROW][C]35[/C][C]-0.088992[/C][C]-0.6836[/C][C]0.248465[/C][/ROW]
[ROW][C]36[/C][C]-0.015029[/C][C]-0.1154[/C][C]0.454244[/C][/ROW]
[ROW][C]37[/C][C]0.087204[/C][C]0.6698[/C][C]0.252791[/C][/ROW]
[ROW][C]38[/C][C]0.021409[/C][C]0.1644[/C][C]0.43497[/C][/ROW]
[ROW][C]39[/C][C]0.002793[/C][C]0.0215[/C][C]0.491479[/C][/ROW]
[ROW][C]40[/C][C]-0.040569[/C][C]-0.3116[/C][C]0.378214[/C][/ROW]
[ROW][C]41[/C][C]-0.002058[/C][C]-0.0158[/C][C]0.493721[/C][/ROW]
[ROW][C]42[/C][C]0.001157[/C][C]0.0089[/C][C]0.496468[/C][/ROW]
[ROW][C]43[/C][C]-0.153351[/C][C]-1.1779[/C][C]0.121781[/C][/ROW]
[ROW][C]44[/C][C]0.012183[/C][C]0.0936[/C][C]0.462879[/C][/ROW]
[ROW][C]45[/C][C]0.061244[/C][C]0.4704[/C][C]0.319893[/C][/ROW]
[ROW][C]46[/C][C]0.027971[/C][C]0.2149[/C][C]0.415312[/C][/ROW]
[ROW][C]47[/C][C]0.072244[/C][C]0.5549[/C][C]0.290524[/C][/ROW]
[ROW][C]48[/C][C]-0.035014[/C][C]-0.2689[/C][C]0.394454[/C][/ROW]
[/TABLE]
Source: https://freestatistics.org/blog/index.php?pk=234780&T=2

Globally Unique Identifier (entire table): ba.freestatistics.org/blog/index.php?pk=234780&T=2

As an alternative you can also use a QR Code:  

The GUIDs for individual cells are displayed in the table below:

Partial Autocorrelation Function
Time lag kPACF(k)T-STATP-value
10.1448791.11280.135146
20.0395210.30360.381263
3-0.216549-1.66330.050773
4-0.095385-0.73270.233332
50.018580.14270.443501
60.0303790.23330.408152
7-0.008517-0.06540.47403
8-0.215789-1.65750.051363
90.1294340.99420.162093
100.3927313.01660.001884
110.2103361.61560.055756
120.0341260.26210.397069
13-0.006851-0.05260.479105
14-0.078971-0.60660.273225
15-0.079696-0.61220.271392
16-0.056939-0.43740.331726
17-0.06491-0.49860.309962
18-0.012023-0.09230.463368
190.1249130.95950.170617
200.0283040.21740.414322
21-0.26305-2.02050.023938
22-0.037079-0.28480.388393
230.0484950.37250.35543
24-0.066906-0.51390.304614
25-0.0479-0.36790.357122
26-0.116699-0.89640.186845
270.1185740.91080.183058
28-0.053553-0.41140.341153
29-0.121978-0.93690.176307
30-0.156805-1.20440.116614
310.0701910.53910.295908
32-0.06174-0.47420.318542
330.1261120.96870.168328
34-0.061343-0.47120.319623
35-0.088992-0.68360.248465
36-0.015029-0.11540.454244
370.0872040.66980.252791
380.0214090.16440.43497
390.0027930.02150.491479
40-0.040569-0.31160.378214
41-0.002058-0.01580.493721
420.0011570.00890.496468
43-0.153351-1.17790.121781
440.0121830.09360.462879
450.0612440.47040.319893
460.0279710.21490.415312
470.0722440.55490.290524
48-0.035014-0.26890.394454


Parameters (Session):
par1 = 48 ; par2 = 1 ; par3 = 1 ; par4 = 0 ; par5 = 12 ; par6 = White Noise ; par7 = 0.95 ;
Parameters (R input):
par1 = 48 ; par2 = 1 ; par3 = 1 ; par4 = 0 ; par5 = 12 ; par6 = White Noise ; par7 = 0.95 ; par8 = ;
R code (references can be found in the software module):
par8 <- ''
par7 <- '0.95'
par6 <- 'White Noise'
par5 <- '12'
par4 <- '0'
par3 <- '0'
par2 <- '1'
par1 <- '48'
if (par1 == 'Default') {
par1 = 10*log10(length(x))
} else {
par1 <- as.numeric(par1)
}
par2 <- as.numeric(par2)
par3 <- as.numeric(par3)
par4 <- as.numeric(par4)
par5 <- as.numeric(par5)
if (par6 == 'White Noise') par6 <- 'white' else par6 <- 'ma'
par7 <- as.numeric(par7)
if (par8 != '') par8 <- as.numeric(par8)
ox <- x
if (par8 == '') {
if (par2 == 0) {
x <- log(x)
} else {
x <- (x ^ par2 - 1) / par2
}
} else {
x <- log(x,base=par8)
}
if (par3 > 0) x <- diff(x,lag=1,difference=par3)
if (par4 > 0) x <- diff(x,lag=par5,difference=par4)
bitmap(file='picts.png')
op <- par(mfrow=c(2,1))
plot(ox,type='l',main='Original Time Series',xlab='time',ylab='value')
if (par8=='') {
mytitle <- paste('Working Time Series (lambda=',par2,', d=',par3,', D=',par4,')',sep='')
mysub <- paste('(lambda=',par2,', d=',par3,', D=',par4,', CI=', par7, ', CI type=',par6,')',sep='')
} else {
mytitle <- paste('Working Time Series (base=',par8,', d=',par3,', D=',par4,')',sep='')
mysub <- paste('(base=',par8,', d=',par3,', D=',par4,', CI=', par7, ', CI type=',par6,')',sep='')
}
plot(x,type='l', main=mytitle,xlab='time',ylab='value')
par(op)
dev.off()
bitmap(file='pic1.png')
racf <- acf(x, par1, main='Autocorrelation', xlab='time lag', ylab='ACF', ci.type=par6, ci=par7, sub=mysub)
dev.off()
bitmap(file='pic2.png')
rpacf <- pacf(x,par1,main='Partial Autocorrelation',xlab='lags',ylab='PACF',sub=mysub)
dev.off()
(myacf <- c(racf$acf))
(mypacf <- c(rpacf$acf))
lengthx <- length(x)
sqrtn <- sqrt(lengthx)
load(file='createtable')
a<-table.start()
a<-table.row.start(a)
a<-table.element(a,'Autocorrelation Function',4,TRUE)
a<-table.row.end(a)
a<-table.row.start(a)
a<-table.element(a,'Time lag k',header=TRUE)
a<-table.element(a,hyperlink('basics.htm','ACF(k)','click here for more information about the Autocorrelation Function'),header=TRUE)
a<-table.element(a,'T-STAT',header=TRUE)
a<-table.element(a,'P-value',header=TRUE)
a<-table.row.end(a)
for (i in 2:(par1+1)) {
a<-table.row.start(a)
a<-table.element(a,i-1,header=TRUE)
a<-table.element(a,round(myacf[i],6))
mytstat <- myacf[i]*sqrtn
a<-table.element(a,round(mytstat,4))
a<-table.element(a,round(1-pt(abs(mytstat),lengthx),6))
a<-table.row.end(a)
}
a<-table.end(a)
table.save(a,file='mytable.tab')
a<-table.start()
a<-table.row.start(a)
a<-table.element(a,'Partial Autocorrelation Function',4,TRUE)
a<-table.row.end(a)
a<-table.row.start(a)
a<-table.element(a,'Time lag k',header=TRUE)
a<-table.element(a,hyperlink('basics.htm','PACF(k)','click here for more information about the Partial Autocorrelation Function'),header=TRUE)
a<-table.element(a,'T-STAT',header=TRUE)
a<-table.element(a,'P-value',header=TRUE)
a<-table.row.end(a)
for (i in 1:par1) {
a<-table.row.start(a)
a<-table.element(a,i,header=TRUE)
a<-table.element(a,round(mypacf[i],6))
mytstat <- mypacf[i]*sqrtn
a<-table.element(a,round(mytstat,4))
a<-table.element(a,round(1-pt(abs(mytstat),lengthx),6))
a<-table.row.end(a)
}
a<-table.end(a)
table.save(a,file='mytable1.tab')