Free Statistics

of Irreproducible Research!

Author's title

Author*Unverified author*
R Software Modulerwasp_autocorrelation.wasp
Title produced by software(Partial) Autocorrelation Function
Date of computationMon, 19 May 2014 08:37:45 -0400
Cite this page as followsStatistical Computations at FreeStatistics.org, Office for Research Development and Education, URL https://freestatistics.org/blog/index.php?v=date/2014/May/19/t1400503115xp8auj85pyv9kbm.htm/, Retrieved Wed, 15 May 2024 00:54:27 +0000
Statistical Computations at FreeStatistics.org, Office for Research Development and Education, URL https://freestatistics.org/blog/index.php?pk=234944, Retrieved Wed, 15 May 2024 00:54:27 +0000
QR Codes:

Original text written by user:
IsPrivate?No (this computation is public)
User-defined keywords
Estimated Impact136
Family? (F = Feedback message, R = changed R code, M = changed R Module, P = changed Parameters, D = changed Data)
-       [(Partial) Autocorrelation Function] [] [2014-05-19 12:37:45] [96d7fff632246663047c645f81fe87bb] [Current]
Feedback Forum

Post a new message
Dataseries X:
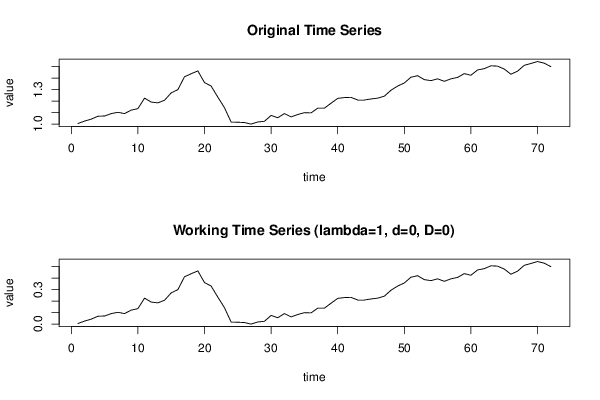
1,005
1,026
1,043
1,068
1,07
1,091
1,102
1,091
1,121
1,134
1,225
1,191
1,184
1,207
1,271
1,299
1,411
1,437
1,462
1,36
1,33
1,234
1,142
1,017
1,016
1,013
1
1,018
1,024
1,075
1,055
1,091
1,062
1,083
1,099
1,097
1,138
1,138
1,181
1,223
1,23
1,232
1,209
1,209
1,218
1,225
1,242
1,294
1,33
1,357
1,407
1,42
1,386
1,377
1,393
1,371
1,393
1,405
1,438
1,424
1,47
1,481
1,506
1,503
1,478
1,433
1,459
1,51
1,526
1,543
1,529
1,499


Summary of computational transaction
Raw Inputview raw input (R code)
Raw Outputview raw output of R engine
Computing time3 seconds
R Server'Gertrude Mary Cox' @ cox.wessa.net

\begin{tabular}{lllllllll}
\hline
Summary of computational transaction \tabularnewline
Raw Input & view raw input (R code)  \tabularnewline
Raw Output & view raw output of R engine  \tabularnewline
Computing time & 3 seconds \tabularnewline
R Server & 'Gertrude Mary Cox' @ cox.wessa.net \tabularnewline
\hline
\end{tabular}
%Source: https://freestatistics.org/blog/index.php?pk=234944&T=0

[TABLE]
[ROW][C]Summary of computational transaction[/C][/ROW]
[ROW][C]Raw Input[/C][C]view raw input (R code) [/C][/ROW]
[ROW][C]Raw Output[/C][C]view raw output of R engine [/C][/ROW]
[ROW][C]Computing time[/C][C]3 seconds[/C][/ROW]
[ROW][C]R Server[/C][C]'Gertrude Mary Cox' @ cox.wessa.net[/C][/ROW]
[/TABLE]
Source: https://freestatistics.org/blog/index.php?pk=234944&T=0

Globally Unique Identifier (entire table): ba.freestatistics.org/blog/index.php?pk=234944&T=0

As an alternative you can also use a QR Code:  

The GUIDs for individual cells are displayed in the table below:

Summary of computational transaction
Raw Inputview raw input (R code)
Raw Outputview raw output of R engine
Computing time3 seconds
R Server'Gertrude Mary Cox' @ cox.wessa.net


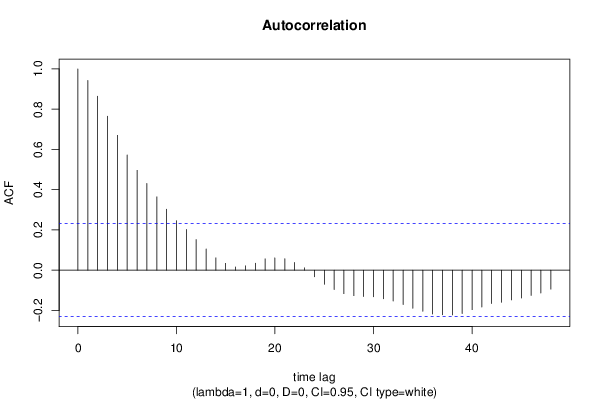
Autocorrelation Function
Time lag kACF(k)T-STATP-value
10.9424817.99720
20.864267.33350
30.7652136.4930
40.6698865.68420
50.5728054.86043e-06
60.4958664.20763.7e-05
70.4304653.65260.000245
80.3643883.09190.001414
90.3028472.56970.006124
100.2458992.08650.020237
110.2023191.71670.045164
120.1517951.2880.100931
130.1050040.8910.187952
140.0611960.51930.302585
150.0339550.28810.387042
160.0155410.13190.447727
170.0215780.18310.427617
180.0341320.28960.38647
190.056060.47570.317868
200.061010.51770.303132
210.0570280.48390.314963
220.0385360.3270.372313
230.0115150.09770.461218
24-0.03265-0.2770.39127
25-0.070001-0.5940.277194
26-0.096378-0.81780.208087
27-0.116516-0.98870.163067
28-0.12667-1.07480.14302
29-0.131001-1.11160.135009
30-0.131941-1.11960.133312
31-0.14189-1.2040.116271
32-0.153169-1.29970.098928
33-0.171-1.4510.075563
34-0.189232-1.60570.05636
35-0.204384-1.73430.043576
36-0.218251-1.85190.034069
37-0.221769-1.88180.031955
38-0.2223-1.88630.031645
39-0.215455-1.82820.035831
40-0.196281-1.66550.050079
41-0.183193-1.55440.062231
42-0.166075-1.40920.081541
43-0.159486-1.35330.090099
44-0.147856-1.25460.106842
45-0.138312-1.17360.122208
46-0.125214-1.06250.145784
47-0.113804-0.96570.168723
48-0.094391-0.80090.212901

\begin{tabular}{lllllllll}
\hline
Autocorrelation Function \tabularnewline
Time lag k & ACF(k) & T-STAT & P-value \tabularnewline
1 & 0.942481 & 7.9972 & 0 \tabularnewline
2 & 0.86426 & 7.3335 & 0 \tabularnewline
3 & 0.765213 & 6.493 & 0 \tabularnewline
4 & 0.669886 & 5.6842 & 0 \tabularnewline
5 & 0.572805 & 4.8604 & 3e-06 \tabularnewline
6 & 0.495866 & 4.2076 & 3.7e-05 \tabularnewline
7 & 0.430465 & 3.6526 & 0.000245 \tabularnewline
8 & 0.364388 & 3.0919 & 0.001414 \tabularnewline
9 & 0.302847 & 2.5697 & 0.006124 \tabularnewline
10 & 0.245899 & 2.0865 & 0.020237 \tabularnewline
11 & 0.202319 & 1.7167 & 0.045164 \tabularnewline
12 & 0.151795 & 1.288 & 0.100931 \tabularnewline
13 & 0.105004 & 0.891 & 0.187952 \tabularnewline
14 & 0.061196 & 0.5193 & 0.302585 \tabularnewline
15 & 0.033955 & 0.2881 & 0.387042 \tabularnewline
16 & 0.015541 & 0.1319 & 0.447727 \tabularnewline
17 & 0.021578 & 0.1831 & 0.427617 \tabularnewline
18 & 0.034132 & 0.2896 & 0.38647 \tabularnewline
19 & 0.05606 & 0.4757 & 0.317868 \tabularnewline
20 & 0.06101 & 0.5177 & 0.303132 \tabularnewline
21 & 0.057028 & 0.4839 & 0.314963 \tabularnewline
22 & 0.038536 & 0.327 & 0.372313 \tabularnewline
23 & 0.011515 & 0.0977 & 0.461218 \tabularnewline
24 & -0.03265 & -0.277 & 0.39127 \tabularnewline
25 & -0.070001 & -0.594 & 0.277194 \tabularnewline
26 & -0.096378 & -0.8178 & 0.208087 \tabularnewline
27 & -0.116516 & -0.9887 & 0.163067 \tabularnewline
28 & -0.12667 & -1.0748 & 0.14302 \tabularnewline
29 & -0.131001 & -1.1116 & 0.135009 \tabularnewline
30 & -0.131941 & -1.1196 & 0.133312 \tabularnewline
31 & -0.14189 & -1.204 & 0.116271 \tabularnewline
32 & -0.153169 & -1.2997 & 0.098928 \tabularnewline
33 & -0.171 & -1.451 & 0.075563 \tabularnewline
34 & -0.189232 & -1.6057 & 0.05636 \tabularnewline
35 & -0.204384 & -1.7343 & 0.043576 \tabularnewline
36 & -0.218251 & -1.8519 & 0.034069 \tabularnewline
37 & -0.221769 & -1.8818 & 0.031955 \tabularnewline
38 & -0.2223 & -1.8863 & 0.031645 \tabularnewline
39 & -0.215455 & -1.8282 & 0.035831 \tabularnewline
40 & -0.196281 & -1.6655 & 0.050079 \tabularnewline
41 & -0.183193 & -1.5544 & 0.062231 \tabularnewline
42 & -0.166075 & -1.4092 & 0.081541 \tabularnewline
43 & -0.159486 & -1.3533 & 0.090099 \tabularnewline
44 & -0.147856 & -1.2546 & 0.106842 \tabularnewline
45 & -0.138312 & -1.1736 & 0.122208 \tabularnewline
46 & -0.125214 & -1.0625 & 0.145784 \tabularnewline
47 & -0.113804 & -0.9657 & 0.168723 \tabularnewline
48 & -0.094391 & -0.8009 & 0.212901 \tabularnewline
\hline
\end{tabular}
%Source: https://freestatistics.org/blog/index.php?pk=234944&T=1

[TABLE]
[ROW][C]Autocorrelation Function[/C][/ROW]
[ROW][C]Time lag k[/C][C]ACF(k)[/C][C]T-STAT[/C][C]P-value[/C][/ROW]
[ROW][C]1[/C][C]0.942481[/C][C]7.9972[/C][C]0[/C][/ROW]
[ROW][C]2[/C][C]0.86426[/C][C]7.3335[/C][C]0[/C][/ROW]
[ROW][C]3[/C][C]0.765213[/C][C]6.493[/C][C]0[/C][/ROW]
[ROW][C]4[/C][C]0.669886[/C][C]5.6842[/C][C]0[/C][/ROW]
[ROW][C]5[/C][C]0.572805[/C][C]4.8604[/C][C]3e-06[/C][/ROW]
[ROW][C]6[/C][C]0.495866[/C][C]4.2076[/C][C]3.7e-05[/C][/ROW]
[ROW][C]7[/C][C]0.430465[/C][C]3.6526[/C][C]0.000245[/C][/ROW]
[ROW][C]8[/C][C]0.364388[/C][C]3.0919[/C][C]0.001414[/C][/ROW]
[ROW][C]9[/C][C]0.302847[/C][C]2.5697[/C][C]0.006124[/C][/ROW]
[ROW][C]10[/C][C]0.245899[/C][C]2.0865[/C][C]0.020237[/C][/ROW]
[ROW][C]11[/C][C]0.202319[/C][C]1.7167[/C][C]0.045164[/C][/ROW]
[ROW][C]12[/C][C]0.151795[/C][C]1.288[/C][C]0.100931[/C][/ROW]
[ROW][C]13[/C][C]0.105004[/C][C]0.891[/C][C]0.187952[/C][/ROW]
[ROW][C]14[/C][C]0.061196[/C][C]0.5193[/C][C]0.302585[/C][/ROW]
[ROW][C]15[/C][C]0.033955[/C][C]0.2881[/C][C]0.387042[/C][/ROW]
[ROW][C]16[/C][C]0.015541[/C][C]0.1319[/C][C]0.447727[/C][/ROW]
[ROW][C]17[/C][C]0.021578[/C][C]0.1831[/C][C]0.427617[/C][/ROW]
[ROW][C]18[/C][C]0.034132[/C][C]0.2896[/C][C]0.38647[/C][/ROW]
[ROW][C]19[/C][C]0.05606[/C][C]0.4757[/C][C]0.317868[/C][/ROW]
[ROW][C]20[/C][C]0.06101[/C][C]0.5177[/C][C]0.303132[/C][/ROW]
[ROW][C]21[/C][C]0.057028[/C][C]0.4839[/C][C]0.314963[/C][/ROW]
[ROW][C]22[/C][C]0.038536[/C][C]0.327[/C][C]0.372313[/C][/ROW]
[ROW][C]23[/C][C]0.011515[/C][C]0.0977[/C][C]0.461218[/C][/ROW]
[ROW][C]24[/C][C]-0.03265[/C][C]-0.277[/C][C]0.39127[/C][/ROW]
[ROW][C]25[/C][C]-0.070001[/C][C]-0.594[/C][C]0.277194[/C][/ROW]
[ROW][C]26[/C][C]-0.096378[/C][C]-0.8178[/C][C]0.208087[/C][/ROW]
[ROW][C]27[/C][C]-0.116516[/C][C]-0.9887[/C][C]0.163067[/C][/ROW]
[ROW][C]28[/C][C]-0.12667[/C][C]-1.0748[/C][C]0.14302[/C][/ROW]
[ROW][C]29[/C][C]-0.131001[/C][C]-1.1116[/C][C]0.135009[/C][/ROW]
[ROW][C]30[/C][C]-0.131941[/C][C]-1.1196[/C][C]0.133312[/C][/ROW]
[ROW][C]31[/C][C]-0.14189[/C][C]-1.204[/C][C]0.116271[/C][/ROW]
[ROW][C]32[/C][C]-0.153169[/C][C]-1.2997[/C][C]0.098928[/C][/ROW]
[ROW][C]33[/C][C]-0.171[/C][C]-1.451[/C][C]0.075563[/C][/ROW]
[ROW][C]34[/C][C]-0.189232[/C][C]-1.6057[/C][C]0.05636[/C][/ROW]
[ROW][C]35[/C][C]-0.204384[/C][C]-1.7343[/C][C]0.043576[/C][/ROW]
[ROW][C]36[/C][C]-0.218251[/C][C]-1.8519[/C][C]0.034069[/C][/ROW]
[ROW][C]37[/C][C]-0.221769[/C][C]-1.8818[/C][C]0.031955[/C][/ROW]
[ROW][C]38[/C][C]-0.2223[/C][C]-1.8863[/C][C]0.031645[/C][/ROW]
[ROW][C]39[/C][C]-0.215455[/C][C]-1.8282[/C][C]0.035831[/C][/ROW]
[ROW][C]40[/C][C]-0.196281[/C][C]-1.6655[/C][C]0.050079[/C][/ROW]
[ROW][C]41[/C][C]-0.183193[/C][C]-1.5544[/C][C]0.062231[/C][/ROW]
[ROW][C]42[/C][C]-0.166075[/C][C]-1.4092[/C][C]0.081541[/C][/ROW]
[ROW][C]43[/C][C]-0.159486[/C][C]-1.3533[/C][C]0.090099[/C][/ROW]
[ROW][C]44[/C][C]-0.147856[/C][C]-1.2546[/C][C]0.106842[/C][/ROW]
[ROW][C]45[/C][C]-0.138312[/C][C]-1.1736[/C][C]0.122208[/C][/ROW]
[ROW][C]46[/C][C]-0.125214[/C][C]-1.0625[/C][C]0.145784[/C][/ROW]
[ROW][C]47[/C][C]-0.113804[/C][C]-0.9657[/C][C]0.168723[/C][/ROW]
[ROW][C]48[/C][C]-0.094391[/C][C]-0.8009[/C][C]0.212901[/C][/ROW]
[/TABLE]
Source: https://freestatistics.org/blog/index.php?pk=234944&T=1

Globally Unique Identifier (entire table): ba.freestatistics.org/blog/index.php?pk=234944&T=1

As an alternative you can also use a QR Code:  

The GUIDs for individual cells are displayed in the table below:

Autocorrelation Function
Time lag kACF(k)T-STATP-value
10.9424817.99720
20.864267.33350
30.7652136.4930
40.6698865.68420
50.5728054.86043e-06
60.4958664.20763.7e-05
70.4304653.65260.000245
80.3643883.09190.001414
90.3028472.56970.006124
100.2458992.08650.020237
110.2023191.71670.045164
120.1517951.2880.100931
130.1050040.8910.187952
140.0611960.51930.302585
150.0339550.28810.387042
160.0155410.13190.447727
170.0215780.18310.427617
180.0341320.28960.38647
190.056060.47570.317868
200.061010.51770.303132
210.0570280.48390.314963
220.0385360.3270.372313
230.0115150.09770.461218
24-0.03265-0.2770.39127
25-0.070001-0.5940.277194
26-0.096378-0.81780.208087
27-0.116516-0.98870.163067
28-0.12667-1.07480.14302
29-0.131001-1.11160.135009
30-0.131941-1.11960.133312
31-0.14189-1.2040.116271
32-0.153169-1.29970.098928
33-0.171-1.4510.075563
34-0.189232-1.60570.05636
35-0.204384-1.73430.043576
36-0.218251-1.85190.034069
37-0.221769-1.88180.031955
38-0.2223-1.88630.031645
39-0.215455-1.82820.035831
40-0.196281-1.66550.050079
41-0.183193-1.55440.062231
42-0.166075-1.40920.081541
43-0.159486-1.35330.090099
44-0.147856-1.25460.106842
45-0.138312-1.17360.122208
46-0.125214-1.06250.145784
47-0.113804-0.96570.168723
48-0.094391-0.80090.212901


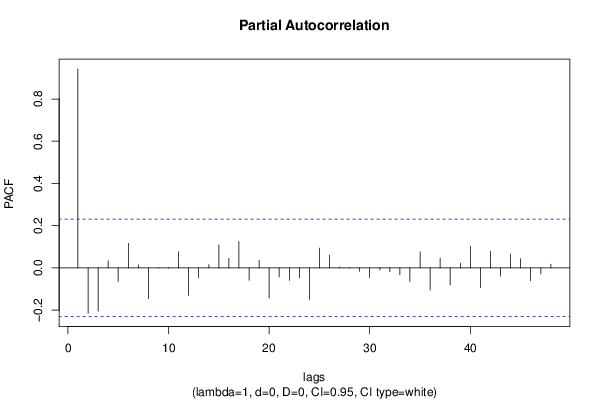
Partial Autocorrelation Function
Time lag kPACF(k)T-STATP-value
10.9424817.99720
2-0.214889-1.82340.036197
3-0.204968-1.73920.043136
40.0340790.28920.386642
5-0.064493-0.54720.292952
60.1163630.98740.163384
70.0136960.11620.453902
8-0.145489-1.23450.110512
90.0013110.01110.495576
10-0.00164-0.01390.494467
110.076240.64690.259872
12-0.13027-1.10540.136338
13-0.046402-0.39370.347471
140.0154440.1310.448053
150.1087360.92270.179634
160.0453060.38440.350895
170.1250021.06070.146191
18-0.058758-0.49860.309799
190.035130.29810.383247
20-0.142897-1.21250.114638
21-0.043213-0.36670.35747
22-0.059304-0.50320.308176
23-0.047272-0.40110.344762
24-0.149283-1.26670.104671
250.0936130.79430.214807
260.0605970.51420.30435
270.0036520.0310.487684
280.0008160.00690.497246
29-0.015929-0.13520.446429
30-0.045303-0.38440.350904
31-0.010803-0.09170.46361
32-0.017766-0.15070.440298
33-0.032793-0.27830.390807
34-0.06462-0.54830.292584
350.0758290.64340.260995
36-0.105214-0.89280.187477
370.0455140.38620.350243
38-0.081066-0.68790.246874
390.0225360.19120.424442
400.1023070.86810.19411
41-0.093531-0.79360.215008
420.0789660.670.252485
43-0.039025-0.33110.37075
440.0660550.56050.288442
450.0433930.36820.356902
46-0.061106-0.51850.302848
47-0.028321-0.24030.405384
480.0175920.14930.440879

\begin{tabular}{lllllllll}
\hline
Partial Autocorrelation Function \tabularnewline
Time lag k & PACF(k) & T-STAT & P-value \tabularnewline
1 & 0.942481 & 7.9972 & 0 \tabularnewline
2 & -0.214889 & -1.8234 & 0.036197 \tabularnewline
3 & -0.204968 & -1.7392 & 0.043136 \tabularnewline
4 & 0.034079 & 0.2892 & 0.386642 \tabularnewline
5 & -0.064493 & -0.5472 & 0.292952 \tabularnewline
6 & 0.116363 & 0.9874 & 0.163384 \tabularnewline
7 & 0.013696 & 0.1162 & 0.453902 \tabularnewline
8 & -0.145489 & -1.2345 & 0.110512 \tabularnewline
9 & 0.001311 & 0.0111 & 0.495576 \tabularnewline
10 & -0.00164 & -0.0139 & 0.494467 \tabularnewline
11 & 0.07624 & 0.6469 & 0.259872 \tabularnewline
12 & -0.13027 & -1.1054 & 0.136338 \tabularnewline
13 & -0.046402 & -0.3937 & 0.347471 \tabularnewline
14 & 0.015444 & 0.131 & 0.448053 \tabularnewline
15 & 0.108736 & 0.9227 & 0.179634 \tabularnewline
16 & 0.045306 & 0.3844 & 0.350895 \tabularnewline
17 & 0.125002 & 1.0607 & 0.146191 \tabularnewline
18 & -0.058758 & -0.4986 & 0.309799 \tabularnewline
19 & 0.03513 & 0.2981 & 0.383247 \tabularnewline
20 & -0.142897 & -1.2125 & 0.114638 \tabularnewline
21 & -0.043213 & -0.3667 & 0.35747 \tabularnewline
22 & -0.059304 & -0.5032 & 0.308176 \tabularnewline
23 & -0.047272 & -0.4011 & 0.344762 \tabularnewline
24 & -0.149283 & -1.2667 & 0.104671 \tabularnewline
25 & 0.093613 & 0.7943 & 0.214807 \tabularnewline
26 & 0.060597 & 0.5142 & 0.30435 \tabularnewline
27 & 0.003652 & 0.031 & 0.487684 \tabularnewline
28 & 0.000816 & 0.0069 & 0.497246 \tabularnewline
29 & -0.015929 & -0.1352 & 0.446429 \tabularnewline
30 & -0.045303 & -0.3844 & 0.350904 \tabularnewline
31 & -0.010803 & -0.0917 & 0.46361 \tabularnewline
32 & -0.017766 & -0.1507 & 0.440298 \tabularnewline
33 & -0.032793 & -0.2783 & 0.390807 \tabularnewline
34 & -0.06462 & -0.5483 & 0.292584 \tabularnewline
35 & 0.075829 & 0.6434 & 0.260995 \tabularnewline
36 & -0.105214 & -0.8928 & 0.187477 \tabularnewline
37 & 0.045514 & 0.3862 & 0.350243 \tabularnewline
38 & -0.081066 & -0.6879 & 0.246874 \tabularnewline
39 & 0.022536 & 0.1912 & 0.424442 \tabularnewline
40 & 0.102307 & 0.8681 & 0.19411 \tabularnewline
41 & -0.093531 & -0.7936 & 0.215008 \tabularnewline
42 & 0.078966 & 0.67 & 0.252485 \tabularnewline
43 & -0.039025 & -0.3311 & 0.37075 \tabularnewline
44 & 0.066055 & 0.5605 & 0.288442 \tabularnewline
45 & 0.043393 & 0.3682 & 0.356902 \tabularnewline
46 & -0.061106 & -0.5185 & 0.302848 \tabularnewline
47 & -0.028321 & -0.2403 & 0.405384 \tabularnewline
48 & 0.017592 & 0.1493 & 0.440879 \tabularnewline
\hline
\end{tabular}
%Source: https://freestatistics.org/blog/index.php?pk=234944&T=2

[TABLE]
[ROW][C]Partial Autocorrelation Function[/C][/ROW]
[ROW][C]Time lag k[/C][C]PACF(k)[/C][C]T-STAT[/C][C]P-value[/C][/ROW]
[ROW][C]1[/C][C]0.942481[/C][C]7.9972[/C][C]0[/C][/ROW]
[ROW][C]2[/C][C]-0.214889[/C][C]-1.8234[/C][C]0.036197[/C][/ROW]
[ROW][C]3[/C][C]-0.204968[/C][C]-1.7392[/C][C]0.043136[/C][/ROW]
[ROW][C]4[/C][C]0.034079[/C][C]0.2892[/C][C]0.386642[/C][/ROW]
[ROW][C]5[/C][C]-0.064493[/C][C]-0.5472[/C][C]0.292952[/C][/ROW]
[ROW][C]6[/C][C]0.116363[/C][C]0.9874[/C][C]0.163384[/C][/ROW]
[ROW][C]7[/C][C]0.013696[/C][C]0.1162[/C][C]0.453902[/C][/ROW]
[ROW][C]8[/C][C]-0.145489[/C][C]-1.2345[/C][C]0.110512[/C][/ROW]
[ROW][C]9[/C][C]0.001311[/C][C]0.0111[/C][C]0.495576[/C][/ROW]
[ROW][C]10[/C][C]-0.00164[/C][C]-0.0139[/C][C]0.494467[/C][/ROW]
[ROW][C]11[/C][C]0.07624[/C][C]0.6469[/C][C]0.259872[/C][/ROW]
[ROW][C]12[/C][C]-0.13027[/C][C]-1.1054[/C][C]0.136338[/C][/ROW]
[ROW][C]13[/C][C]-0.046402[/C][C]-0.3937[/C][C]0.347471[/C][/ROW]
[ROW][C]14[/C][C]0.015444[/C][C]0.131[/C][C]0.448053[/C][/ROW]
[ROW][C]15[/C][C]0.108736[/C][C]0.9227[/C][C]0.179634[/C][/ROW]
[ROW][C]16[/C][C]0.045306[/C][C]0.3844[/C][C]0.350895[/C][/ROW]
[ROW][C]17[/C][C]0.125002[/C][C]1.0607[/C][C]0.146191[/C][/ROW]
[ROW][C]18[/C][C]-0.058758[/C][C]-0.4986[/C][C]0.309799[/C][/ROW]
[ROW][C]19[/C][C]0.03513[/C][C]0.2981[/C][C]0.383247[/C][/ROW]
[ROW][C]20[/C][C]-0.142897[/C][C]-1.2125[/C][C]0.114638[/C][/ROW]
[ROW][C]21[/C][C]-0.043213[/C][C]-0.3667[/C][C]0.35747[/C][/ROW]
[ROW][C]22[/C][C]-0.059304[/C][C]-0.5032[/C][C]0.308176[/C][/ROW]
[ROW][C]23[/C][C]-0.047272[/C][C]-0.4011[/C][C]0.344762[/C][/ROW]
[ROW][C]24[/C][C]-0.149283[/C][C]-1.2667[/C][C]0.104671[/C][/ROW]
[ROW][C]25[/C][C]0.093613[/C][C]0.7943[/C][C]0.214807[/C][/ROW]
[ROW][C]26[/C][C]0.060597[/C][C]0.5142[/C][C]0.30435[/C][/ROW]
[ROW][C]27[/C][C]0.003652[/C][C]0.031[/C][C]0.487684[/C][/ROW]
[ROW][C]28[/C][C]0.000816[/C][C]0.0069[/C][C]0.497246[/C][/ROW]
[ROW][C]29[/C][C]-0.015929[/C][C]-0.1352[/C][C]0.446429[/C][/ROW]
[ROW][C]30[/C][C]-0.045303[/C][C]-0.3844[/C][C]0.350904[/C][/ROW]
[ROW][C]31[/C][C]-0.010803[/C][C]-0.0917[/C][C]0.46361[/C][/ROW]
[ROW][C]32[/C][C]-0.017766[/C][C]-0.1507[/C][C]0.440298[/C][/ROW]
[ROW][C]33[/C][C]-0.032793[/C][C]-0.2783[/C][C]0.390807[/C][/ROW]
[ROW][C]34[/C][C]-0.06462[/C][C]-0.5483[/C][C]0.292584[/C][/ROW]
[ROW][C]35[/C][C]0.075829[/C][C]0.6434[/C][C]0.260995[/C][/ROW]
[ROW][C]36[/C][C]-0.105214[/C][C]-0.8928[/C][C]0.187477[/C][/ROW]
[ROW][C]37[/C][C]0.045514[/C][C]0.3862[/C][C]0.350243[/C][/ROW]
[ROW][C]38[/C][C]-0.081066[/C][C]-0.6879[/C][C]0.246874[/C][/ROW]
[ROW][C]39[/C][C]0.022536[/C][C]0.1912[/C][C]0.424442[/C][/ROW]
[ROW][C]40[/C][C]0.102307[/C][C]0.8681[/C][C]0.19411[/C][/ROW]
[ROW][C]41[/C][C]-0.093531[/C][C]-0.7936[/C][C]0.215008[/C][/ROW]
[ROW][C]42[/C][C]0.078966[/C][C]0.67[/C][C]0.252485[/C][/ROW]
[ROW][C]43[/C][C]-0.039025[/C][C]-0.3311[/C][C]0.37075[/C][/ROW]
[ROW][C]44[/C][C]0.066055[/C][C]0.5605[/C][C]0.288442[/C][/ROW]
[ROW][C]45[/C][C]0.043393[/C][C]0.3682[/C][C]0.356902[/C][/ROW]
[ROW][C]46[/C][C]-0.061106[/C][C]-0.5185[/C][C]0.302848[/C][/ROW]
[ROW][C]47[/C][C]-0.028321[/C][C]-0.2403[/C][C]0.405384[/C][/ROW]
[ROW][C]48[/C][C]0.017592[/C][C]0.1493[/C][C]0.440879[/C][/ROW]
[/TABLE]
Source: https://freestatistics.org/blog/index.php?pk=234944&T=2

Globally Unique Identifier (entire table): ba.freestatistics.org/blog/index.php?pk=234944&T=2

As an alternative you can also use a QR Code:  

The GUIDs for individual cells are displayed in the table below:

Partial Autocorrelation Function
Time lag kPACF(k)T-STATP-value
10.9424817.99720
2-0.214889-1.82340.036197
3-0.204968-1.73920.043136
40.0340790.28920.386642
5-0.064493-0.54720.292952
60.1163630.98740.163384
70.0136960.11620.453902
8-0.145489-1.23450.110512
90.0013110.01110.495576
10-0.00164-0.01390.494467
110.076240.64690.259872
12-0.13027-1.10540.136338
13-0.046402-0.39370.347471
140.0154440.1310.448053
150.1087360.92270.179634
160.0453060.38440.350895
170.1250021.06070.146191
18-0.058758-0.49860.309799
190.035130.29810.383247
20-0.142897-1.21250.114638
21-0.043213-0.36670.35747
22-0.059304-0.50320.308176
23-0.047272-0.40110.344762
24-0.149283-1.26670.104671
250.0936130.79430.214807
260.0605970.51420.30435
270.0036520.0310.487684
280.0008160.00690.497246
29-0.015929-0.13520.446429
30-0.045303-0.38440.350904
31-0.010803-0.09170.46361
32-0.017766-0.15070.440298
33-0.032793-0.27830.390807
34-0.06462-0.54830.292584
350.0758290.64340.260995
36-0.105214-0.89280.187477
370.0455140.38620.350243
38-0.081066-0.68790.246874
390.0225360.19120.424442
400.1023070.86810.19411
41-0.093531-0.79360.215008
420.0789660.670.252485
43-0.039025-0.33110.37075
440.0660550.56050.288442
450.0433930.36820.356902
46-0.061106-0.51850.302848
47-0.028321-0.24030.405384
480.0175920.14930.440879


Parameters (Session):
par1 = 48 ; par2 = 1 ; par3 = 0 ; par4 = 0 ; par5 = 12 ; par6 = White Noise ; par7 = 0.95 ;
Parameters (R input):
par1 = 48 ; par2 = 1 ; par3 = 0 ; par4 = 0 ; par5 = 12 ; par6 = White Noise ; par7 = 0.95 ; par8 = ;
R code (references can be found in the software module):
if (par1 == 'Default') {
par1 = 10*log10(length(x))
} else {
par1 <- as.numeric(par1)
}
par2 <- as.numeric(par2)
par3 <- as.numeric(par3)
par4 <- as.numeric(par4)
par5 <- as.numeric(par5)
if (par6 == 'White Noise') par6 <- 'white' else par6 <- 'ma'
par7 <- as.numeric(par7)
if (par8 != '') par8 <- as.numeric(par8)
ox <- x
if (par8 == '') {
if (par2 == 0) {
x <- log(x)
} else {
x <- (x ^ par2 - 1) / par2
}
} else {
x <- log(x,base=par8)
}
if (par3 > 0) x <- diff(x,lag=1,difference=par3)
if (par4 > 0) x <- diff(x,lag=par5,difference=par4)
bitmap(file='picts.png')
op <- par(mfrow=c(2,1))
plot(ox,type='l',main='Original Time Series',xlab='time',ylab='value')
if (par8=='') {
mytitle <- paste('Working Time Series (lambda=',par2,', d=',par3,', D=',par4,')',sep='')
mysub <- paste('(lambda=',par2,', d=',par3,', D=',par4,', CI=', par7, ', CI type=',par6,')',sep='')
} else {
mytitle <- paste('Working Time Series (base=',par8,', d=',par3,', D=',par4,')',sep='')
mysub <- paste('(base=',par8,', d=',par3,', D=',par4,', CI=', par7, ', CI type=',par6,')',sep='')
}
plot(x,type='l', main=mytitle,xlab='time',ylab='value')
par(op)
dev.off()
bitmap(file='pic1.png')
racf <- acf(x, par1, main='Autocorrelation', xlab='time lag', ylab='ACF', ci.type=par6, ci=par7, sub=mysub)
dev.off()
bitmap(file='pic2.png')
rpacf <- pacf(x,par1,main='Partial Autocorrelation',xlab='lags',ylab='PACF',sub=mysub)
dev.off()
(myacf <- c(racf$acf))
(mypacf <- c(rpacf$acf))
lengthx <- length(x)
sqrtn <- sqrt(lengthx)
load(file='createtable')
a<-table.start()
a<-table.row.start(a)
a<-table.element(a,'Autocorrelation Function',4,TRUE)
a<-table.row.end(a)
a<-table.row.start(a)
a<-table.element(a,'Time lag k',header=TRUE)
a<-table.element(a,hyperlink('basics.htm','ACF(k)','click here for more information about the Autocorrelation Function'),header=TRUE)
a<-table.element(a,'T-STAT',header=TRUE)
a<-table.element(a,'P-value',header=TRUE)
a<-table.row.end(a)
for (i in 2:(par1+1)) {
a<-table.row.start(a)
a<-table.element(a,i-1,header=TRUE)
a<-table.element(a,round(myacf[i],6))
mytstat <- myacf[i]*sqrtn
a<-table.element(a,round(mytstat,4))
a<-table.element(a,round(1-pt(abs(mytstat),lengthx),6))
a<-table.row.end(a)
}
a<-table.end(a)
table.save(a,file='mytable.tab')
a<-table.start()
a<-table.row.start(a)
a<-table.element(a,'Partial Autocorrelation Function',4,TRUE)
a<-table.row.end(a)
a<-table.row.start(a)
a<-table.element(a,'Time lag k',header=TRUE)
a<-table.element(a,hyperlink('basics.htm','PACF(k)','click here for more information about the Partial Autocorrelation Function'),header=TRUE)
a<-table.element(a,'T-STAT',header=TRUE)
a<-table.element(a,'P-value',header=TRUE)
a<-table.row.end(a)
for (i in 1:par1) {
a<-table.row.start(a)
a<-table.element(a,i,header=TRUE)
a<-table.element(a,round(mypacf[i],6))
mytstat <- mypacf[i]*sqrtn
a<-table.element(a,round(mytstat,4))
a<-table.element(a,round(1-pt(abs(mytstat),lengthx),6))
a<-table.row.end(a)
}
a<-table.end(a)
table.save(a,file='mytable1.tab')