Free Statistics

of Irreproducible Research!

Author's title

Author*Unverified author*
R Software Modulerwasp_autocorrelation.wasp
Title produced by software(Partial) Autocorrelation Function
Date of computationWed, 21 May 2014 07:44:22 -0400
Cite this page as followsStatistical Computations at FreeStatistics.org, Office for Research Development and Education, URL https://freestatistics.org/blog/index.php?v=date/2014/May/21/t1400672668onxbcbyvpes2e98.htm/, Retrieved Tue, 14 May 2024 22:59:14 +0000
Statistical Computations at FreeStatistics.org, Office for Research Development and Education, URL https://freestatistics.org/blog/index.php?pk=235031, Retrieved Tue, 14 May 2024 22:59:14 +0000
QR Codes:

Original text written by user:
IsPrivate?No (this computation is public)
User-defined keywords
Estimated Impact102
Family? (F = Feedback message, R = changed R code, M = changed R Module, P = changed Parameters, D = changed Data)
-       [(Partial) Autocorrelation Function] [] [2014-05-21 11:44:22] [b3e3d38149b35cb70244b37a39776b3a] [Current]
Feedback Forum

Post a new message
Dataseries X:
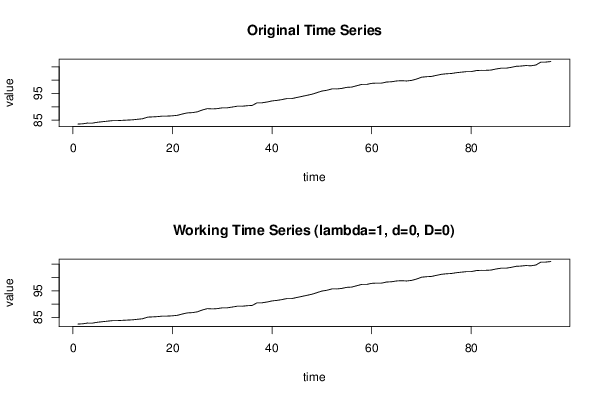
83,5
83,6
83,9
83,9
84,2
84,4
84,6
84,8
84,8
84,9
85
85,1
85,3
85,5
86,1
86,2
86,3
86,5
86,5
86,6
86,8
87,3
87,7
87,8
88,1
88,8
89,3
89,2
89,3
89,6
89,6
89,9
90,2
90,2
90,4
90,5
91,5
91,5
91,8
92,2
92,4
92,7
93,1
93,1
93,5
93,9
94,3
94,7
95,3
95,9
96,2
96,7
96,7
96,9
97,3
97,4
97,9
98,4
98,4
98,8
98,9
98,9
99,3
99,4
99,7
99,8
99,7
99,9
100,4
101,1
101,3
101,4
101,8
102,2
102,4
102,5
102,8
103
103,2
103,2
103,6
103,7
103,7
103,8
104,2
104,5
104,5
104,8
105,2
105,3
105,5
105,4
105,7
106,8
106,8
107


Summary of computational transaction
Raw Inputview raw input (R code)
Raw Outputview raw output of R engine
Computing time2 seconds
R Server'Gwilym Jenkins' @ jenkins.wessa.net

\begin{tabular}{lllllllll}
\hline
Summary of computational transaction \tabularnewline
Raw Input & view raw input (R code)  \tabularnewline
Raw Output & view raw output of R engine  \tabularnewline
Computing time & 2 seconds \tabularnewline
R Server & 'Gwilym Jenkins' @ jenkins.wessa.net \tabularnewline
\hline
\end{tabular}
%Source: https://freestatistics.org/blog/index.php?pk=235031&T=0

[TABLE]
[ROW][C]Summary of computational transaction[/C][/ROW]
[ROW][C]Raw Input[/C][C]view raw input (R code) [/C][/ROW]
[ROW][C]Raw Output[/C][C]view raw output of R engine [/C][/ROW]
[ROW][C]Computing time[/C][C]2 seconds[/C][/ROW]
[ROW][C]R Server[/C][C]'Gwilym Jenkins' @ jenkins.wessa.net[/C][/ROW]
[/TABLE]
Source: https://freestatistics.org/blog/index.php?pk=235031&T=0

Globally Unique Identifier (entire table): ba.freestatistics.org/blog/index.php?pk=235031&T=0

As an alternative you can also use a QR Code:  

The GUIDs for individual cells are displayed in the table below:

Summary of computational transaction
Raw Inputview raw input (R code)
Raw Outputview raw output of R engine
Computing time2 seconds
R Server'Gwilym Jenkins' @ jenkins.wessa.net


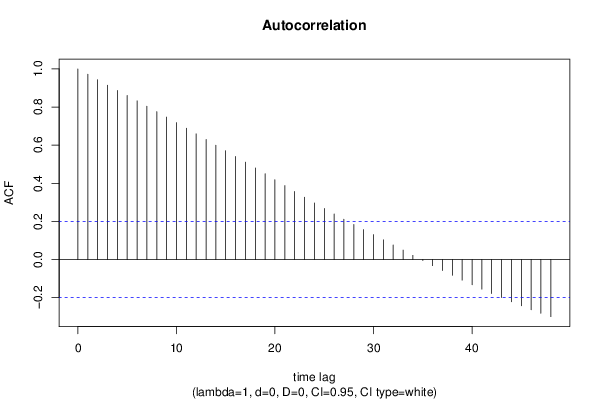
Autocorrelation Function
Time lag kACF(k)T-STATP-value
10.9719529.52310
20.9435039.24440
30.9147118.96230
40.8873638.69430
50.8603328.42950
60.8323368.15520
70.8042497.880
80.7758317.60160
90.7472047.32110
100.7184957.03980
110.6889146.74990
120.6591826.45860
130.6297356.17010
140.5999385.87820
150.5705785.59050
160.5405495.29630
170.510755.00431e-06
180.4804484.70744e-06
190.4496674.40581.4e-05
200.4186164.10164.3e-05
210.3876093.79780.000128
220.3569573.49740.000357
230.3267573.20160.000927
240.2967112.90720.002265
250.2672312.61830.005134
260.2385672.33750.010746
270.2106432.06390.020864
280.1833911.79690.037752
290.1566661.5350.064035
300.1303251.27690.102355
310.1029841.0090.157747
320.075660.74130.230157
330.048940.47950.316332
340.0216380.2120.416276
35-0.00512-0.05020.480047
36-0.03233-0.31680.376053
37-0.057906-0.56740.285895
38-0.083332-0.81650.208122
39-0.108754-1.06560.144647
40-0.132797-1.30110.098162
41-0.155853-1.5270.065019
42-0.178535-1.74930.041719
43-0.200088-1.96050.026421
44-0.221855-2.17370.016093
45-0.24349-2.38570.009505
46-0.263676-2.58350.005644
47-0.282823-2.77110.003355
48-0.300267-2.9420.002044

\begin{tabular}{lllllllll}
\hline
Autocorrelation Function \tabularnewline
Time lag k & ACF(k) & T-STAT & P-value \tabularnewline
1 & 0.971952 & 9.5231 & 0 \tabularnewline
2 & 0.943503 & 9.2444 & 0 \tabularnewline
3 & 0.914711 & 8.9623 & 0 \tabularnewline
4 & 0.887363 & 8.6943 & 0 \tabularnewline
5 & 0.860332 & 8.4295 & 0 \tabularnewline
6 & 0.832336 & 8.1552 & 0 \tabularnewline
7 & 0.804249 & 7.88 & 0 \tabularnewline
8 & 0.775831 & 7.6016 & 0 \tabularnewline
9 & 0.747204 & 7.3211 & 0 \tabularnewline
10 & 0.718495 & 7.0398 & 0 \tabularnewline
11 & 0.688914 & 6.7499 & 0 \tabularnewline
12 & 0.659182 & 6.4586 & 0 \tabularnewline
13 & 0.629735 & 6.1701 & 0 \tabularnewline
14 & 0.599938 & 5.8782 & 0 \tabularnewline
15 & 0.570578 & 5.5905 & 0 \tabularnewline
16 & 0.540549 & 5.2963 & 0 \tabularnewline
17 & 0.51075 & 5.0043 & 1e-06 \tabularnewline
18 & 0.480448 & 4.7074 & 4e-06 \tabularnewline
19 & 0.449667 & 4.4058 & 1.4e-05 \tabularnewline
20 & 0.418616 & 4.1016 & 4.3e-05 \tabularnewline
21 & 0.387609 & 3.7978 & 0.000128 \tabularnewline
22 & 0.356957 & 3.4974 & 0.000357 \tabularnewline
23 & 0.326757 & 3.2016 & 0.000927 \tabularnewline
24 & 0.296711 & 2.9072 & 0.002265 \tabularnewline
25 & 0.267231 & 2.6183 & 0.005134 \tabularnewline
26 & 0.238567 & 2.3375 & 0.010746 \tabularnewline
27 & 0.210643 & 2.0639 & 0.020864 \tabularnewline
28 & 0.183391 & 1.7969 & 0.037752 \tabularnewline
29 & 0.156666 & 1.535 & 0.064035 \tabularnewline
30 & 0.130325 & 1.2769 & 0.102355 \tabularnewline
31 & 0.102984 & 1.009 & 0.157747 \tabularnewline
32 & 0.07566 & 0.7413 & 0.230157 \tabularnewline
33 & 0.04894 & 0.4795 & 0.316332 \tabularnewline
34 & 0.021638 & 0.212 & 0.416276 \tabularnewline
35 & -0.00512 & -0.0502 & 0.480047 \tabularnewline
36 & -0.03233 & -0.3168 & 0.376053 \tabularnewline
37 & -0.057906 & -0.5674 & 0.285895 \tabularnewline
38 & -0.083332 & -0.8165 & 0.208122 \tabularnewline
39 & -0.108754 & -1.0656 & 0.144647 \tabularnewline
40 & -0.132797 & -1.3011 & 0.098162 \tabularnewline
41 & -0.155853 & -1.527 & 0.065019 \tabularnewline
42 & -0.178535 & -1.7493 & 0.041719 \tabularnewline
43 & -0.200088 & -1.9605 & 0.026421 \tabularnewline
44 & -0.221855 & -2.1737 & 0.016093 \tabularnewline
45 & -0.24349 & -2.3857 & 0.009505 \tabularnewline
46 & -0.263676 & -2.5835 & 0.005644 \tabularnewline
47 & -0.282823 & -2.7711 & 0.003355 \tabularnewline
48 & -0.300267 & -2.942 & 0.002044 \tabularnewline
\hline
\end{tabular}
%Source: https://freestatistics.org/blog/index.php?pk=235031&T=1

[TABLE]
[ROW][C]Autocorrelation Function[/C][/ROW]
[ROW][C]Time lag k[/C][C]ACF(k)[/C][C]T-STAT[/C][C]P-value[/C][/ROW]
[ROW][C]1[/C][C]0.971952[/C][C]9.5231[/C][C]0[/C][/ROW]
[ROW][C]2[/C][C]0.943503[/C][C]9.2444[/C][C]0[/C][/ROW]
[ROW][C]3[/C][C]0.914711[/C][C]8.9623[/C][C]0[/C][/ROW]
[ROW][C]4[/C][C]0.887363[/C][C]8.6943[/C][C]0[/C][/ROW]
[ROW][C]5[/C][C]0.860332[/C][C]8.4295[/C][C]0[/C][/ROW]
[ROW][C]6[/C][C]0.832336[/C][C]8.1552[/C][C]0[/C][/ROW]
[ROW][C]7[/C][C]0.804249[/C][C]7.88[/C][C]0[/C][/ROW]
[ROW][C]8[/C][C]0.775831[/C][C]7.6016[/C][C]0[/C][/ROW]
[ROW][C]9[/C][C]0.747204[/C][C]7.3211[/C][C]0[/C][/ROW]
[ROW][C]10[/C][C]0.718495[/C][C]7.0398[/C][C]0[/C][/ROW]
[ROW][C]11[/C][C]0.688914[/C][C]6.7499[/C][C]0[/C][/ROW]
[ROW][C]12[/C][C]0.659182[/C][C]6.4586[/C][C]0[/C][/ROW]
[ROW][C]13[/C][C]0.629735[/C][C]6.1701[/C][C]0[/C][/ROW]
[ROW][C]14[/C][C]0.599938[/C][C]5.8782[/C][C]0[/C][/ROW]
[ROW][C]15[/C][C]0.570578[/C][C]5.5905[/C][C]0[/C][/ROW]
[ROW][C]16[/C][C]0.540549[/C][C]5.2963[/C][C]0[/C][/ROW]
[ROW][C]17[/C][C]0.51075[/C][C]5.0043[/C][C]1e-06[/C][/ROW]
[ROW][C]18[/C][C]0.480448[/C][C]4.7074[/C][C]4e-06[/C][/ROW]
[ROW][C]19[/C][C]0.449667[/C][C]4.4058[/C][C]1.4e-05[/C][/ROW]
[ROW][C]20[/C][C]0.418616[/C][C]4.1016[/C][C]4.3e-05[/C][/ROW]
[ROW][C]21[/C][C]0.387609[/C][C]3.7978[/C][C]0.000128[/C][/ROW]
[ROW][C]22[/C][C]0.356957[/C][C]3.4974[/C][C]0.000357[/C][/ROW]
[ROW][C]23[/C][C]0.326757[/C][C]3.2016[/C][C]0.000927[/C][/ROW]
[ROW][C]24[/C][C]0.296711[/C][C]2.9072[/C][C]0.002265[/C][/ROW]
[ROW][C]25[/C][C]0.267231[/C][C]2.6183[/C][C]0.005134[/C][/ROW]
[ROW][C]26[/C][C]0.238567[/C][C]2.3375[/C][C]0.010746[/C][/ROW]
[ROW][C]27[/C][C]0.210643[/C][C]2.0639[/C][C]0.020864[/C][/ROW]
[ROW][C]28[/C][C]0.183391[/C][C]1.7969[/C][C]0.037752[/C][/ROW]
[ROW][C]29[/C][C]0.156666[/C][C]1.535[/C][C]0.064035[/C][/ROW]
[ROW][C]30[/C][C]0.130325[/C][C]1.2769[/C][C]0.102355[/C][/ROW]
[ROW][C]31[/C][C]0.102984[/C][C]1.009[/C][C]0.157747[/C][/ROW]
[ROW][C]32[/C][C]0.07566[/C][C]0.7413[/C][C]0.230157[/C][/ROW]
[ROW][C]33[/C][C]0.04894[/C][C]0.4795[/C][C]0.316332[/C][/ROW]
[ROW][C]34[/C][C]0.021638[/C][C]0.212[/C][C]0.416276[/C][/ROW]
[ROW][C]35[/C][C]-0.00512[/C][C]-0.0502[/C][C]0.480047[/C][/ROW]
[ROW][C]36[/C][C]-0.03233[/C][C]-0.3168[/C][C]0.376053[/C][/ROW]
[ROW][C]37[/C][C]-0.057906[/C][C]-0.5674[/C][C]0.285895[/C][/ROW]
[ROW][C]38[/C][C]-0.083332[/C][C]-0.8165[/C][C]0.208122[/C][/ROW]
[ROW][C]39[/C][C]-0.108754[/C][C]-1.0656[/C][C]0.144647[/C][/ROW]
[ROW][C]40[/C][C]-0.132797[/C][C]-1.3011[/C][C]0.098162[/C][/ROW]
[ROW][C]41[/C][C]-0.155853[/C][C]-1.527[/C][C]0.065019[/C][/ROW]
[ROW][C]42[/C][C]-0.178535[/C][C]-1.7493[/C][C]0.041719[/C][/ROW]
[ROW][C]43[/C][C]-0.200088[/C][C]-1.9605[/C][C]0.026421[/C][/ROW]
[ROW][C]44[/C][C]-0.221855[/C][C]-2.1737[/C][C]0.016093[/C][/ROW]
[ROW][C]45[/C][C]-0.24349[/C][C]-2.3857[/C][C]0.009505[/C][/ROW]
[ROW][C]46[/C][C]-0.263676[/C][C]-2.5835[/C][C]0.005644[/C][/ROW]
[ROW][C]47[/C][C]-0.282823[/C][C]-2.7711[/C][C]0.003355[/C][/ROW]
[ROW][C]48[/C][C]-0.300267[/C][C]-2.942[/C][C]0.002044[/C][/ROW]
[/TABLE]
Source: https://freestatistics.org/blog/index.php?pk=235031&T=1

Globally Unique Identifier (entire table): ba.freestatistics.org/blog/index.php?pk=235031&T=1

As an alternative you can also use a QR Code:  

The GUIDs for individual cells are displayed in the table below:

Autocorrelation Function
Time lag kACF(k)T-STATP-value
10.9719529.52310
20.9435039.24440
30.9147118.96230
40.8873638.69430
50.8603328.42950
60.8323368.15520
70.8042497.880
80.7758317.60160
90.7472047.32110
100.7184957.03980
110.6889146.74990
120.6591826.45860
130.6297356.17010
140.5999385.87820
150.5705785.59050
160.5405495.29630
170.510755.00431e-06
180.4804484.70744e-06
190.4496674.40581.4e-05
200.4186164.10164.3e-05
210.3876093.79780.000128
220.3569573.49740.000357
230.3267573.20160.000927
240.2967112.90720.002265
250.2672312.61830.005134
260.2385672.33750.010746
270.2106432.06390.020864
280.1833911.79690.037752
290.1566661.5350.064035
300.1303251.27690.102355
310.1029841.0090.157747
320.075660.74130.230157
330.048940.47950.316332
340.0216380.2120.416276
35-0.00512-0.05020.480047
36-0.03233-0.31680.376053
37-0.057906-0.56740.285895
38-0.083332-0.81650.208122
39-0.108754-1.06560.144647
40-0.132797-1.30110.098162
41-0.155853-1.5270.065019
42-0.178535-1.74930.041719
43-0.200088-1.96050.026421
44-0.221855-2.17370.016093
45-0.24349-2.38570.009505
46-0.263676-2.58350.005644
47-0.282823-2.77110.003355
48-0.300267-2.9420.002044


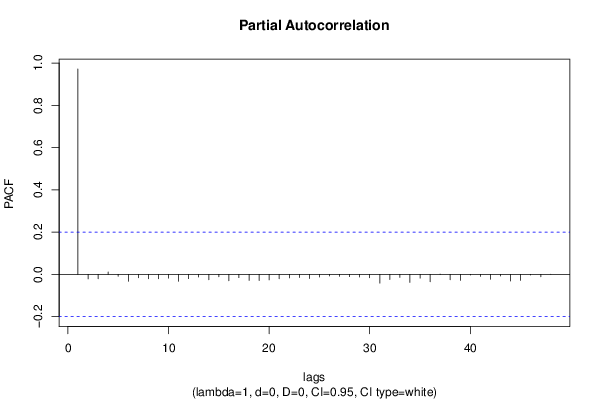
Partial Autocorrelation Function
Time lag kPACF(k)T-STATP-value
10.9719529.52310
2-0.021467-0.21030.416925
3-0.020803-0.20380.419461
40.0111850.10960.45648
5-0.009092-0.08910.464599
6-0.03243-0.31770.375684
7-0.016069-0.15740.437613
8-0.021023-0.2060.418621
9-0.020566-0.20150.420364
10-0.017986-0.17620.430245
11-0.032478-0.31820.375505
12-0.020257-0.19850.421544
13-0.01246-0.12210.451543
14-0.025173-0.24660.402855
15-0.010912-0.10690.45754
16-0.030085-0.29480.384402
17-0.015408-0.1510.440158
18-0.028483-0.27910.390392
19-0.029303-0.28710.387322
20-0.026153-0.25620.399155
21-0.020757-0.20340.419637
22-0.016553-0.16220.43575
23-0.014619-0.14320.443201
24-0.019697-0.1930.423687
25-0.012583-0.12330.45107
26-0.00767-0.07520.470126
27-0.009677-0.09480.462331
28-0.010741-0.10520.458203
29-0.012374-0.12120.451878
30-0.016089-0.15760.437534
31-0.041407-0.40570.342933
32-0.024595-0.2410.405043
33-0.014381-0.14090.444122
34-0.037836-0.37070.355833
35-0.017662-0.17310.431486
36-0.034752-0.34050.367114
370.0009610.00940.496252
38-0.025206-0.2470.402729
39-0.028492-0.27920.39036
40-0.002941-0.02880.488535
41-0.009433-0.09240.463278
42-0.022878-0.22420.411555
43-0.007765-0.07610.469755
44-0.031415-0.30780.379449
45-0.028366-0.27790.390833
46-0.002643-0.02590.489696
47-0.011566-0.11330.455007
480.0005560.00540.497832

\begin{tabular}{lllllllll}
\hline
Partial Autocorrelation Function \tabularnewline
Time lag k & PACF(k) & T-STAT & P-value \tabularnewline
1 & 0.971952 & 9.5231 & 0 \tabularnewline
2 & -0.021467 & -0.2103 & 0.416925 \tabularnewline
3 & -0.020803 & -0.2038 & 0.419461 \tabularnewline
4 & 0.011185 & 0.1096 & 0.45648 \tabularnewline
5 & -0.009092 & -0.0891 & 0.464599 \tabularnewline
6 & -0.03243 & -0.3177 & 0.375684 \tabularnewline
7 & -0.016069 & -0.1574 & 0.437613 \tabularnewline
8 & -0.021023 & -0.206 & 0.418621 \tabularnewline
9 & -0.020566 & -0.2015 & 0.420364 \tabularnewline
10 & -0.017986 & -0.1762 & 0.430245 \tabularnewline
11 & -0.032478 & -0.3182 & 0.375505 \tabularnewline
12 & -0.020257 & -0.1985 & 0.421544 \tabularnewline
13 & -0.01246 & -0.1221 & 0.451543 \tabularnewline
14 & -0.025173 & -0.2466 & 0.402855 \tabularnewline
15 & -0.010912 & -0.1069 & 0.45754 \tabularnewline
16 & -0.030085 & -0.2948 & 0.384402 \tabularnewline
17 & -0.015408 & -0.151 & 0.440158 \tabularnewline
18 & -0.028483 & -0.2791 & 0.390392 \tabularnewline
19 & -0.029303 & -0.2871 & 0.387322 \tabularnewline
20 & -0.026153 & -0.2562 & 0.399155 \tabularnewline
21 & -0.020757 & -0.2034 & 0.419637 \tabularnewline
22 & -0.016553 & -0.1622 & 0.43575 \tabularnewline
23 & -0.014619 & -0.1432 & 0.443201 \tabularnewline
24 & -0.019697 & -0.193 & 0.423687 \tabularnewline
25 & -0.012583 & -0.1233 & 0.45107 \tabularnewline
26 & -0.00767 & -0.0752 & 0.470126 \tabularnewline
27 & -0.009677 & -0.0948 & 0.462331 \tabularnewline
28 & -0.010741 & -0.1052 & 0.458203 \tabularnewline
29 & -0.012374 & -0.1212 & 0.451878 \tabularnewline
30 & -0.016089 & -0.1576 & 0.437534 \tabularnewline
31 & -0.041407 & -0.4057 & 0.342933 \tabularnewline
32 & -0.024595 & -0.241 & 0.405043 \tabularnewline
33 & -0.014381 & -0.1409 & 0.444122 \tabularnewline
34 & -0.037836 & -0.3707 & 0.355833 \tabularnewline
35 & -0.017662 & -0.1731 & 0.431486 \tabularnewline
36 & -0.034752 & -0.3405 & 0.367114 \tabularnewline
37 & 0.000961 & 0.0094 & 0.496252 \tabularnewline
38 & -0.025206 & -0.247 & 0.402729 \tabularnewline
39 & -0.028492 & -0.2792 & 0.39036 \tabularnewline
40 & -0.002941 & -0.0288 & 0.488535 \tabularnewline
41 & -0.009433 & -0.0924 & 0.463278 \tabularnewline
42 & -0.022878 & -0.2242 & 0.411555 \tabularnewline
43 & -0.007765 & -0.0761 & 0.469755 \tabularnewline
44 & -0.031415 & -0.3078 & 0.379449 \tabularnewline
45 & -0.028366 & -0.2779 & 0.390833 \tabularnewline
46 & -0.002643 & -0.0259 & 0.489696 \tabularnewline
47 & -0.011566 & -0.1133 & 0.455007 \tabularnewline
48 & 0.000556 & 0.0054 & 0.497832 \tabularnewline
\hline
\end{tabular}
%Source: https://freestatistics.org/blog/index.php?pk=235031&T=2

[TABLE]
[ROW][C]Partial Autocorrelation Function[/C][/ROW]
[ROW][C]Time lag k[/C][C]PACF(k)[/C][C]T-STAT[/C][C]P-value[/C][/ROW]
[ROW][C]1[/C][C]0.971952[/C][C]9.5231[/C][C]0[/C][/ROW]
[ROW][C]2[/C][C]-0.021467[/C][C]-0.2103[/C][C]0.416925[/C][/ROW]
[ROW][C]3[/C][C]-0.020803[/C][C]-0.2038[/C][C]0.419461[/C][/ROW]
[ROW][C]4[/C][C]0.011185[/C][C]0.1096[/C][C]0.45648[/C][/ROW]
[ROW][C]5[/C][C]-0.009092[/C][C]-0.0891[/C][C]0.464599[/C][/ROW]
[ROW][C]6[/C][C]-0.03243[/C][C]-0.3177[/C][C]0.375684[/C][/ROW]
[ROW][C]7[/C][C]-0.016069[/C][C]-0.1574[/C][C]0.437613[/C][/ROW]
[ROW][C]8[/C][C]-0.021023[/C][C]-0.206[/C][C]0.418621[/C][/ROW]
[ROW][C]9[/C][C]-0.020566[/C][C]-0.2015[/C][C]0.420364[/C][/ROW]
[ROW][C]10[/C][C]-0.017986[/C][C]-0.1762[/C][C]0.430245[/C][/ROW]
[ROW][C]11[/C][C]-0.032478[/C][C]-0.3182[/C][C]0.375505[/C][/ROW]
[ROW][C]12[/C][C]-0.020257[/C][C]-0.1985[/C][C]0.421544[/C][/ROW]
[ROW][C]13[/C][C]-0.01246[/C][C]-0.1221[/C][C]0.451543[/C][/ROW]
[ROW][C]14[/C][C]-0.025173[/C][C]-0.2466[/C][C]0.402855[/C][/ROW]
[ROW][C]15[/C][C]-0.010912[/C][C]-0.1069[/C][C]0.45754[/C][/ROW]
[ROW][C]16[/C][C]-0.030085[/C][C]-0.2948[/C][C]0.384402[/C][/ROW]
[ROW][C]17[/C][C]-0.015408[/C][C]-0.151[/C][C]0.440158[/C][/ROW]
[ROW][C]18[/C][C]-0.028483[/C][C]-0.2791[/C][C]0.390392[/C][/ROW]
[ROW][C]19[/C][C]-0.029303[/C][C]-0.2871[/C][C]0.387322[/C][/ROW]
[ROW][C]20[/C][C]-0.026153[/C][C]-0.2562[/C][C]0.399155[/C][/ROW]
[ROW][C]21[/C][C]-0.020757[/C][C]-0.2034[/C][C]0.419637[/C][/ROW]
[ROW][C]22[/C][C]-0.016553[/C][C]-0.1622[/C][C]0.43575[/C][/ROW]
[ROW][C]23[/C][C]-0.014619[/C][C]-0.1432[/C][C]0.443201[/C][/ROW]
[ROW][C]24[/C][C]-0.019697[/C][C]-0.193[/C][C]0.423687[/C][/ROW]
[ROW][C]25[/C][C]-0.012583[/C][C]-0.1233[/C][C]0.45107[/C][/ROW]
[ROW][C]26[/C][C]-0.00767[/C][C]-0.0752[/C][C]0.470126[/C][/ROW]
[ROW][C]27[/C][C]-0.009677[/C][C]-0.0948[/C][C]0.462331[/C][/ROW]
[ROW][C]28[/C][C]-0.010741[/C][C]-0.1052[/C][C]0.458203[/C][/ROW]
[ROW][C]29[/C][C]-0.012374[/C][C]-0.1212[/C][C]0.451878[/C][/ROW]
[ROW][C]30[/C][C]-0.016089[/C][C]-0.1576[/C][C]0.437534[/C][/ROW]
[ROW][C]31[/C][C]-0.041407[/C][C]-0.4057[/C][C]0.342933[/C][/ROW]
[ROW][C]32[/C][C]-0.024595[/C][C]-0.241[/C][C]0.405043[/C][/ROW]
[ROW][C]33[/C][C]-0.014381[/C][C]-0.1409[/C][C]0.444122[/C][/ROW]
[ROW][C]34[/C][C]-0.037836[/C][C]-0.3707[/C][C]0.355833[/C][/ROW]
[ROW][C]35[/C][C]-0.017662[/C][C]-0.1731[/C][C]0.431486[/C][/ROW]
[ROW][C]36[/C][C]-0.034752[/C][C]-0.3405[/C][C]0.367114[/C][/ROW]
[ROW][C]37[/C][C]0.000961[/C][C]0.0094[/C][C]0.496252[/C][/ROW]
[ROW][C]38[/C][C]-0.025206[/C][C]-0.247[/C][C]0.402729[/C][/ROW]
[ROW][C]39[/C][C]-0.028492[/C][C]-0.2792[/C][C]0.39036[/C][/ROW]
[ROW][C]40[/C][C]-0.002941[/C][C]-0.0288[/C][C]0.488535[/C][/ROW]
[ROW][C]41[/C][C]-0.009433[/C][C]-0.0924[/C][C]0.463278[/C][/ROW]
[ROW][C]42[/C][C]-0.022878[/C][C]-0.2242[/C][C]0.411555[/C][/ROW]
[ROW][C]43[/C][C]-0.007765[/C][C]-0.0761[/C][C]0.469755[/C][/ROW]
[ROW][C]44[/C][C]-0.031415[/C][C]-0.3078[/C][C]0.379449[/C][/ROW]
[ROW][C]45[/C][C]-0.028366[/C][C]-0.2779[/C][C]0.390833[/C][/ROW]
[ROW][C]46[/C][C]-0.002643[/C][C]-0.0259[/C][C]0.489696[/C][/ROW]
[ROW][C]47[/C][C]-0.011566[/C][C]-0.1133[/C][C]0.455007[/C][/ROW]
[ROW][C]48[/C][C]0.000556[/C][C]0.0054[/C][C]0.497832[/C][/ROW]
[/TABLE]
Source: https://freestatistics.org/blog/index.php?pk=235031&T=2

Globally Unique Identifier (entire table): ba.freestatistics.org/blog/index.php?pk=235031&T=2

As an alternative you can also use a QR Code:  

The GUIDs for individual cells are displayed in the table below:

Partial Autocorrelation Function
Time lag kPACF(k)T-STATP-value
10.9719529.52310
2-0.021467-0.21030.416925
3-0.020803-0.20380.419461
40.0111850.10960.45648
5-0.009092-0.08910.464599
6-0.03243-0.31770.375684
7-0.016069-0.15740.437613
8-0.021023-0.2060.418621
9-0.020566-0.20150.420364
10-0.017986-0.17620.430245
11-0.032478-0.31820.375505
12-0.020257-0.19850.421544
13-0.01246-0.12210.451543
14-0.025173-0.24660.402855
15-0.010912-0.10690.45754
16-0.030085-0.29480.384402
17-0.015408-0.1510.440158
18-0.028483-0.27910.390392
19-0.029303-0.28710.387322
20-0.026153-0.25620.399155
21-0.020757-0.20340.419637
22-0.016553-0.16220.43575
23-0.014619-0.14320.443201
24-0.019697-0.1930.423687
25-0.012583-0.12330.45107
26-0.00767-0.07520.470126
27-0.009677-0.09480.462331
28-0.010741-0.10520.458203
29-0.012374-0.12120.451878
30-0.016089-0.15760.437534
31-0.041407-0.40570.342933
32-0.024595-0.2410.405043
33-0.014381-0.14090.444122
34-0.037836-0.37070.355833
35-0.017662-0.17310.431486
36-0.034752-0.34050.367114
370.0009610.00940.496252
38-0.025206-0.2470.402729
39-0.028492-0.27920.39036
40-0.002941-0.02880.488535
41-0.009433-0.09240.463278
42-0.022878-0.22420.411555
43-0.007765-0.07610.469755
44-0.031415-0.30780.379449
45-0.028366-0.27790.390833
46-0.002643-0.02590.489696
47-0.011566-0.11330.455007
480.0005560.00540.497832


Parameters (Session):
par1 = 48 ; par2 = 1 ; par3 = 0 ; par4 = 0 ; par5 = 12 ; par6 = White Noise ; par7 = 0.95 ;
Parameters (R input):
par1 = 48 ; par2 = 1 ; par3 = 0 ; par4 = 0 ; par5 = 12 ; par6 = White Noise ; par7 = 0.95 ; par8 = ;
R code (references can be found in the software module):
if (par1 == 'Default') {
par1 = 10*log10(length(x))
} else {
par1 <- as.numeric(par1)
}
par2 <- as.numeric(par2)
par3 <- as.numeric(par3)
par4 <- as.numeric(par4)
par5 <- as.numeric(par5)
if (par6 == 'White Noise') par6 <- 'white' else par6 <- 'ma'
par7 <- as.numeric(par7)
if (par8 != '') par8 <- as.numeric(par8)
ox <- x
if (par8 == '') {
if (par2 == 0) {
x <- log(x)
} else {
x <- (x ^ par2 - 1) / par2
}
} else {
x <- log(x,base=par8)
}
if (par3 > 0) x <- diff(x,lag=1,difference=par3)
if (par4 > 0) x <- diff(x,lag=par5,difference=par4)
bitmap(file='picts.png')
op <- par(mfrow=c(2,1))
plot(ox,type='l',main='Original Time Series',xlab='time',ylab='value')
if (par8=='') {
mytitle <- paste('Working Time Series (lambda=',par2,', d=',par3,', D=',par4,')',sep='')
mysub <- paste('(lambda=',par2,', d=',par3,', D=',par4,', CI=', par7, ', CI type=',par6,')',sep='')
} else {
mytitle <- paste('Working Time Series (base=',par8,', d=',par3,', D=',par4,')',sep='')
mysub <- paste('(base=',par8,', d=',par3,', D=',par4,', CI=', par7, ', CI type=',par6,')',sep='')
}
plot(x,type='l', main=mytitle,xlab='time',ylab='value')
par(op)
dev.off()
bitmap(file='pic1.png')
racf <- acf(x, par1, main='Autocorrelation', xlab='time lag', ylab='ACF', ci.type=par6, ci=par7, sub=mysub)
dev.off()
bitmap(file='pic2.png')
rpacf <- pacf(x,par1,main='Partial Autocorrelation',xlab='lags',ylab='PACF',sub=mysub)
dev.off()
(myacf <- c(racf$acf))
(mypacf <- c(rpacf$acf))
lengthx <- length(x)
sqrtn <- sqrt(lengthx)
load(file='createtable')
a<-table.start()
a<-table.row.start(a)
a<-table.element(a,'Autocorrelation Function',4,TRUE)
a<-table.row.end(a)
a<-table.row.start(a)
a<-table.element(a,'Time lag k',header=TRUE)
a<-table.element(a,hyperlink('basics.htm','ACF(k)','click here for more information about the Autocorrelation Function'),header=TRUE)
a<-table.element(a,'T-STAT',header=TRUE)
a<-table.element(a,'P-value',header=TRUE)
a<-table.row.end(a)
for (i in 2:(par1+1)) {
a<-table.row.start(a)
a<-table.element(a,i-1,header=TRUE)
a<-table.element(a,round(myacf[i],6))
mytstat <- myacf[i]*sqrtn
a<-table.element(a,round(mytstat,4))
a<-table.element(a,round(1-pt(abs(mytstat),lengthx),6))
a<-table.row.end(a)
}
a<-table.end(a)
table.save(a,file='mytable.tab')
a<-table.start()
a<-table.row.start(a)
a<-table.element(a,'Partial Autocorrelation Function',4,TRUE)
a<-table.row.end(a)
a<-table.row.start(a)
a<-table.element(a,'Time lag k',header=TRUE)
a<-table.element(a,hyperlink('basics.htm','PACF(k)','click here for more information about the Partial Autocorrelation Function'),header=TRUE)
a<-table.element(a,'T-STAT',header=TRUE)
a<-table.element(a,'P-value',header=TRUE)
a<-table.row.end(a)
for (i in 1:par1) {
a<-table.row.start(a)
a<-table.element(a,i,header=TRUE)
a<-table.element(a,round(mypacf[i],6))
mytstat <- mypacf[i]*sqrtn
a<-table.element(a,round(mytstat,4))
a<-table.element(a,round(1-pt(abs(mytstat),lengthx),6))
a<-table.row.end(a)
}
a<-table.end(a)
table.save(a,file='mytable1.tab')