Free Statistics

of Irreproducible Research!

Author's title

Author*Unverified author*
R Software Modulerwasp_autocorrelation.wasp
Title produced by software(Partial) Autocorrelation Function
Date of computationThu, 22 May 2014 07:34:26 -0400
Cite this page as followsStatistical Computations at FreeStatistics.org, Office for Research Development and Education, URL https://freestatistics.org/blog/index.php?v=date/2014/May/22/t1400758493c5lyce6yiulw783.htm/, Retrieved Wed, 15 May 2024 02:44:25 +0000
Statistical Computations at FreeStatistics.org, Office for Research Development and Education, URL https://freestatistics.org/blog/index.php?pk=235085, Retrieved Wed, 15 May 2024 02:44:25 +0000
QR Codes:

Original text written by user:
IsPrivate?No (this computation is public)
User-defined keywords
Estimated Impact96
Family? (F = Feedback message, R = changed R code, M = changed R Module, P = changed Parameters, D = changed Data)
-       [(Partial) Autocorrelation Function] [Verbetering numbe...] [2014-05-22 11:34:26] [1195732e18620915cb775ad7ef5494bd] [Current]
Feedback Forum

Post a new message
Dataseries X:
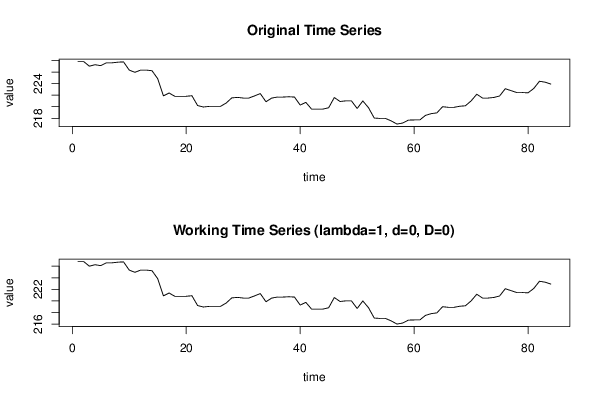
227,81
227,81
227,01
227,26
227,1
227,59
227,59
227,7
227,75
226,33
225,95
226,33
226,33
226,22
224,84
221,88
222,37
221,8
221,8
221,8
221,9
220,2
219,95
220,05
220,05
220,05
220,62
221,53
221,61
221,5
221,5
221,87
222,27
220,86
221,49
221,67
221,67
221,72
221,67
220,29
220,75
219,59
219,59
219,59
219,82
221,59
220,9
221,01
221,01
219,69
221
219,82
218,04
217,97
217,97
217,53
217
217,18
217,68
217,71
217,71
218,5
218,8
218,94
220
219,89
219,89
220,08
220,16
221
222,16
221,5
221,5
221,6
221,85
223,11
222,79
222,45
222,45
222,4
223,15
224,4
224,24
223,92


Summary of computational transaction
Raw Inputview raw input (R code)
Raw Outputview raw output of R engine
Computing time2 seconds
R Server'Herman Ole Andreas Wold' @ wold.wessa.net

\begin{tabular}{lllllllll}
\hline
Summary of computational transaction \tabularnewline
Raw Input & view raw input (R code)  \tabularnewline
Raw Output & view raw output of R engine  \tabularnewline
Computing time & 2 seconds \tabularnewline
R Server & 'Herman Ole Andreas Wold' @ wold.wessa.net \tabularnewline
\hline
\end{tabular}
%Source: https://freestatistics.org/blog/index.php?pk=235085&T=0

[TABLE]
[ROW][C]Summary of computational transaction[/C][/ROW]
[ROW][C]Raw Input[/C][C]view raw input (R code) [/C][/ROW]
[ROW][C]Raw Output[/C][C]view raw output of R engine [/C][/ROW]
[ROW][C]Computing time[/C][C]2 seconds[/C][/ROW]
[ROW][C]R Server[/C][C]'Herman Ole Andreas Wold' @ wold.wessa.net[/C][/ROW]
[/TABLE]
Source: https://freestatistics.org/blog/index.php?pk=235085&T=0

Globally Unique Identifier (entire table): ba.freestatistics.org/blog/index.php?pk=235085&T=0

As an alternative you can also use a QR Code:  

The GUIDs for individual cells are displayed in the table below:

Summary of computational transaction
Raw Inputview raw input (R code)
Raw Outputview raw output of R engine
Computing time2 seconds
R Server'Herman Ole Andreas Wold' @ wold.wessa.net


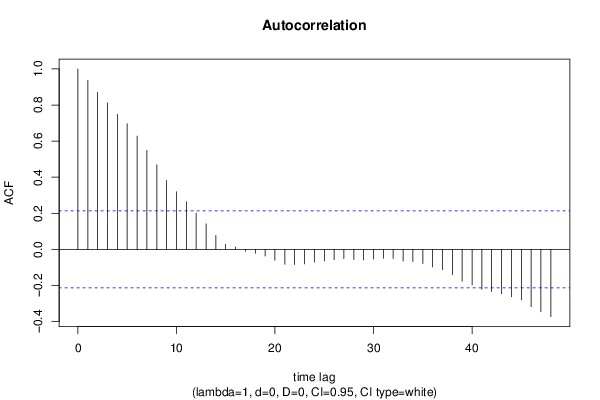
Autocorrelation Function
Time lag kACF(k)T-STATP-value
10.9366168.58420
20.8711557.98430
30.8128747.45010
40.7492086.86660
50.6962776.38150
60.6279275.7550
70.5483895.02611e-06
80.4690944.29932.3e-05
90.3820183.50130.000372
100.3198612.93160.002172
110.2637912.41770.008891
120.200471.83730.034848
130.1412781.29480.099463
140.0768560.70440.241568
150.0283130.25950.397947
160.0134890.12360.450951
17-0.010134-0.09290.46311
18-0.021343-0.19560.422693
19-0.036769-0.3370.368482
20-0.060429-0.55380.290579
21-0.082909-0.75990.22473
22-0.084079-0.77060.221555
23-0.080572-0.73850.231148
24-0.070098-0.64250.261163
25-0.064341-0.58970.278488
26-0.056771-0.52030.302105
27-0.050362-0.46160.322791
28-0.055846-0.51180.305054
29-0.058692-0.53790.296028
30-0.05332-0.48870.313169
31-0.048742-0.44670.328112
32-0.05075-0.46510.32152
33-0.064236-0.58870.278809
34-0.066998-0.6140.270423
35-0.078599-0.72040.236647
36-0.096934-0.88840.188428
37-0.1127-1.03290.152304
38-0.140578-1.28840.10057
39-0.176298-1.61580.054944
40-0.196511-1.80110.037642
41-0.220583-2.02170.023196
42-0.233209-2.13740.017736
43-0.246226-2.25670.013312
44-0.26279-2.40850.009103
45-0.280082-2.5670.006015
46-0.317325-2.90830.002324
47-0.345446-3.16610.001077
48-0.372804-3.41680.000489

\begin{tabular}{lllllllll}
\hline
Autocorrelation Function \tabularnewline
Time lag k & ACF(k) & T-STAT & P-value \tabularnewline
1 & 0.936616 & 8.5842 & 0 \tabularnewline
2 & 0.871155 & 7.9843 & 0 \tabularnewline
3 & 0.812874 & 7.4501 & 0 \tabularnewline
4 & 0.749208 & 6.8666 & 0 \tabularnewline
5 & 0.696277 & 6.3815 & 0 \tabularnewline
6 & 0.627927 & 5.755 & 0 \tabularnewline
7 & 0.548389 & 5.0261 & 1e-06 \tabularnewline
8 & 0.469094 & 4.2993 & 2.3e-05 \tabularnewline
9 & 0.382018 & 3.5013 & 0.000372 \tabularnewline
10 & 0.319861 & 2.9316 & 0.002172 \tabularnewline
11 & 0.263791 & 2.4177 & 0.008891 \tabularnewline
12 & 0.20047 & 1.8373 & 0.034848 \tabularnewline
13 & 0.141278 & 1.2948 & 0.099463 \tabularnewline
14 & 0.076856 & 0.7044 & 0.241568 \tabularnewline
15 & 0.028313 & 0.2595 & 0.397947 \tabularnewline
16 & 0.013489 & 0.1236 & 0.450951 \tabularnewline
17 & -0.010134 & -0.0929 & 0.46311 \tabularnewline
18 & -0.021343 & -0.1956 & 0.422693 \tabularnewline
19 & -0.036769 & -0.337 & 0.368482 \tabularnewline
20 & -0.060429 & -0.5538 & 0.290579 \tabularnewline
21 & -0.082909 & -0.7599 & 0.22473 \tabularnewline
22 & -0.084079 & -0.7706 & 0.221555 \tabularnewline
23 & -0.080572 & -0.7385 & 0.231148 \tabularnewline
24 & -0.070098 & -0.6425 & 0.261163 \tabularnewline
25 & -0.064341 & -0.5897 & 0.278488 \tabularnewline
26 & -0.056771 & -0.5203 & 0.302105 \tabularnewline
27 & -0.050362 & -0.4616 & 0.322791 \tabularnewline
28 & -0.055846 & -0.5118 & 0.305054 \tabularnewline
29 & -0.058692 & -0.5379 & 0.296028 \tabularnewline
30 & -0.05332 & -0.4887 & 0.313169 \tabularnewline
31 & -0.048742 & -0.4467 & 0.328112 \tabularnewline
32 & -0.05075 & -0.4651 & 0.32152 \tabularnewline
33 & -0.064236 & -0.5887 & 0.278809 \tabularnewline
34 & -0.066998 & -0.614 & 0.270423 \tabularnewline
35 & -0.078599 & -0.7204 & 0.236647 \tabularnewline
36 & -0.096934 & -0.8884 & 0.188428 \tabularnewline
37 & -0.1127 & -1.0329 & 0.152304 \tabularnewline
38 & -0.140578 & -1.2884 & 0.10057 \tabularnewline
39 & -0.176298 & -1.6158 & 0.054944 \tabularnewline
40 & -0.196511 & -1.8011 & 0.037642 \tabularnewline
41 & -0.220583 & -2.0217 & 0.023196 \tabularnewline
42 & -0.233209 & -2.1374 & 0.017736 \tabularnewline
43 & -0.246226 & -2.2567 & 0.013312 \tabularnewline
44 & -0.26279 & -2.4085 & 0.009103 \tabularnewline
45 & -0.280082 & -2.567 & 0.006015 \tabularnewline
46 & -0.317325 & -2.9083 & 0.002324 \tabularnewline
47 & -0.345446 & -3.1661 & 0.001077 \tabularnewline
48 & -0.372804 & -3.4168 & 0.000489 \tabularnewline
\hline
\end{tabular}
%Source: https://freestatistics.org/blog/index.php?pk=235085&T=1

[TABLE]
[ROW][C]Autocorrelation Function[/C][/ROW]
[ROW][C]Time lag k[/C][C]ACF(k)[/C][C]T-STAT[/C][C]P-value[/C][/ROW]
[ROW][C]1[/C][C]0.936616[/C][C]8.5842[/C][C]0[/C][/ROW]
[ROW][C]2[/C][C]0.871155[/C][C]7.9843[/C][C]0[/C][/ROW]
[ROW][C]3[/C][C]0.812874[/C][C]7.4501[/C][C]0[/C][/ROW]
[ROW][C]4[/C][C]0.749208[/C][C]6.8666[/C][C]0[/C][/ROW]
[ROW][C]5[/C][C]0.696277[/C][C]6.3815[/C][C]0[/C][/ROW]
[ROW][C]6[/C][C]0.627927[/C][C]5.755[/C][C]0[/C][/ROW]
[ROW][C]7[/C][C]0.548389[/C][C]5.0261[/C][C]1e-06[/C][/ROW]
[ROW][C]8[/C][C]0.469094[/C][C]4.2993[/C][C]2.3e-05[/C][/ROW]
[ROW][C]9[/C][C]0.382018[/C][C]3.5013[/C][C]0.000372[/C][/ROW]
[ROW][C]10[/C][C]0.319861[/C][C]2.9316[/C][C]0.002172[/C][/ROW]
[ROW][C]11[/C][C]0.263791[/C][C]2.4177[/C][C]0.008891[/C][/ROW]
[ROW][C]12[/C][C]0.20047[/C][C]1.8373[/C][C]0.034848[/C][/ROW]
[ROW][C]13[/C][C]0.141278[/C][C]1.2948[/C][C]0.099463[/C][/ROW]
[ROW][C]14[/C][C]0.076856[/C][C]0.7044[/C][C]0.241568[/C][/ROW]
[ROW][C]15[/C][C]0.028313[/C][C]0.2595[/C][C]0.397947[/C][/ROW]
[ROW][C]16[/C][C]0.013489[/C][C]0.1236[/C][C]0.450951[/C][/ROW]
[ROW][C]17[/C][C]-0.010134[/C][C]-0.0929[/C][C]0.46311[/C][/ROW]
[ROW][C]18[/C][C]-0.021343[/C][C]-0.1956[/C][C]0.422693[/C][/ROW]
[ROW][C]19[/C][C]-0.036769[/C][C]-0.337[/C][C]0.368482[/C][/ROW]
[ROW][C]20[/C][C]-0.060429[/C][C]-0.5538[/C][C]0.290579[/C][/ROW]
[ROW][C]21[/C][C]-0.082909[/C][C]-0.7599[/C][C]0.22473[/C][/ROW]
[ROW][C]22[/C][C]-0.084079[/C][C]-0.7706[/C][C]0.221555[/C][/ROW]
[ROW][C]23[/C][C]-0.080572[/C][C]-0.7385[/C][C]0.231148[/C][/ROW]
[ROW][C]24[/C][C]-0.070098[/C][C]-0.6425[/C][C]0.261163[/C][/ROW]
[ROW][C]25[/C][C]-0.064341[/C][C]-0.5897[/C][C]0.278488[/C][/ROW]
[ROW][C]26[/C][C]-0.056771[/C][C]-0.5203[/C][C]0.302105[/C][/ROW]
[ROW][C]27[/C][C]-0.050362[/C][C]-0.4616[/C][C]0.322791[/C][/ROW]
[ROW][C]28[/C][C]-0.055846[/C][C]-0.5118[/C][C]0.305054[/C][/ROW]
[ROW][C]29[/C][C]-0.058692[/C][C]-0.5379[/C][C]0.296028[/C][/ROW]
[ROW][C]30[/C][C]-0.05332[/C][C]-0.4887[/C][C]0.313169[/C][/ROW]
[ROW][C]31[/C][C]-0.048742[/C][C]-0.4467[/C][C]0.328112[/C][/ROW]
[ROW][C]32[/C][C]-0.05075[/C][C]-0.4651[/C][C]0.32152[/C][/ROW]
[ROW][C]33[/C][C]-0.064236[/C][C]-0.5887[/C][C]0.278809[/C][/ROW]
[ROW][C]34[/C][C]-0.066998[/C][C]-0.614[/C][C]0.270423[/C][/ROW]
[ROW][C]35[/C][C]-0.078599[/C][C]-0.7204[/C][C]0.236647[/C][/ROW]
[ROW][C]36[/C][C]-0.096934[/C][C]-0.8884[/C][C]0.188428[/C][/ROW]
[ROW][C]37[/C][C]-0.1127[/C][C]-1.0329[/C][C]0.152304[/C][/ROW]
[ROW][C]38[/C][C]-0.140578[/C][C]-1.2884[/C][C]0.10057[/C][/ROW]
[ROW][C]39[/C][C]-0.176298[/C][C]-1.6158[/C][C]0.054944[/C][/ROW]
[ROW][C]40[/C][C]-0.196511[/C][C]-1.8011[/C][C]0.037642[/C][/ROW]
[ROW][C]41[/C][C]-0.220583[/C][C]-2.0217[/C][C]0.023196[/C][/ROW]
[ROW][C]42[/C][C]-0.233209[/C][C]-2.1374[/C][C]0.017736[/C][/ROW]
[ROW][C]43[/C][C]-0.246226[/C][C]-2.2567[/C][C]0.013312[/C][/ROW]
[ROW][C]44[/C][C]-0.26279[/C][C]-2.4085[/C][C]0.009103[/C][/ROW]
[ROW][C]45[/C][C]-0.280082[/C][C]-2.567[/C][C]0.006015[/C][/ROW]
[ROW][C]46[/C][C]-0.317325[/C][C]-2.9083[/C][C]0.002324[/C][/ROW]
[ROW][C]47[/C][C]-0.345446[/C][C]-3.1661[/C][C]0.001077[/C][/ROW]
[ROW][C]48[/C][C]-0.372804[/C][C]-3.4168[/C][C]0.000489[/C][/ROW]
[/TABLE]
Source: https://freestatistics.org/blog/index.php?pk=235085&T=1

Globally Unique Identifier (entire table): ba.freestatistics.org/blog/index.php?pk=235085&T=1

As an alternative you can also use a QR Code:  

The GUIDs for individual cells are displayed in the table below:

Autocorrelation Function
Time lag kACF(k)T-STATP-value
10.9366168.58420
20.8711557.98430
30.8128747.45010
40.7492086.86660
50.6962776.38150
60.6279275.7550
70.5483895.02611e-06
80.4690944.29932.3e-05
90.3820183.50130.000372
100.3198612.93160.002172
110.2637912.41770.008891
120.200471.83730.034848
130.1412781.29480.099463
140.0768560.70440.241568
150.0283130.25950.397947
160.0134890.12360.450951
17-0.010134-0.09290.46311
18-0.021343-0.19560.422693
19-0.036769-0.3370.368482
20-0.060429-0.55380.290579
21-0.082909-0.75990.22473
22-0.084079-0.77060.221555
23-0.080572-0.73850.231148
24-0.070098-0.64250.261163
25-0.064341-0.58970.278488
26-0.056771-0.52030.302105
27-0.050362-0.46160.322791
28-0.055846-0.51180.305054
29-0.058692-0.53790.296028
30-0.05332-0.48870.313169
31-0.048742-0.44670.328112
32-0.05075-0.46510.32152
33-0.064236-0.58870.278809
34-0.066998-0.6140.270423
35-0.078599-0.72040.236647
36-0.096934-0.88840.188428
37-0.1127-1.03290.152304
38-0.140578-1.28840.10057
39-0.176298-1.61580.054944
40-0.196511-1.80110.037642
41-0.220583-2.02170.023196
42-0.233209-2.13740.017736
43-0.246226-2.25670.013312
44-0.26279-2.40850.009103
45-0.280082-2.5670.006015
46-0.317325-2.90830.002324
47-0.345446-3.16610.001077
48-0.372804-3.41680.000489


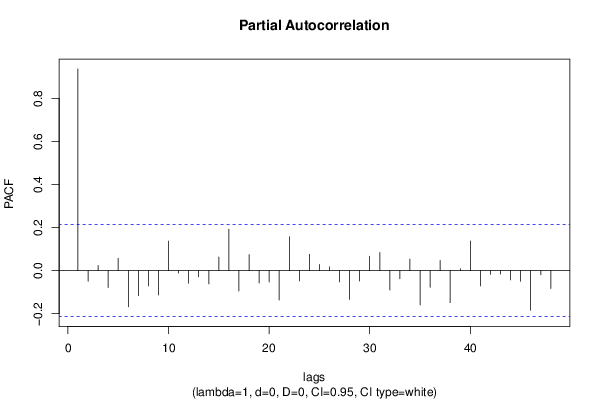
Partial Autocorrelation Function
Time lag kPACF(k)T-STATP-value
10.9366168.58420
2-0.049648-0.4550.325131
30.0239140.21920.413521
4-0.07823-0.7170.237684
50.0567710.52030.302106
6-0.167824-1.53810.063887
7-0.116291-1.06580.144779
8-0.071037-0.65110.258391
9-0.113085-1.03640.151485
100.1369511.25520.106448
11-0.011503-0.10540.458143
12-0.058511-0.53630.296597
13-0.028755-0.26350.396389
14-0.0618-0.56640.286313
150.0633720.58080.281462
160.191941.75920.041096
17-0.094551-0.86660.194322
180.0744090.6820.248566
19-0.057853-0.53020.298674
20-0.053221-0.48780.313487
21-0.136286-1.24910.107553
220.1572131.44090.076668
23-0.047739-0.43750.331424
240.075440.69140.245605
250.0286180.26230.396872
260.0174930.16030.436503
27-0.05225-0.47890.316635
28-0.133614-1.22460.112075
29-0.048295-0.44260.329584
300.0666490.61080.271476
310.083970.76960.22185
32-0.090371-0.82830.204934
33-0.037637-0.3450.365496
340.0532790.48830.313301
35-0.159149-1.45860.074199
36-0.077363-0.7090.240131
370.0469060.42990.334184
38-0.148868-1.36440.088044
390.0086990.07970.468321
400.1374321.25960.105654
41-0.070913-0.64990.258756
42-0.01748-0.16020.436553
43-0.015413-0.14130.444002
44-0.043071-0.39480.347011
45-0.049576-0.45440.325367
46-0.184438-1.69040.04733
47-0.019273-0.17660.430107
48-0.083044-0.76110.224362

\begin{tabular}{lllllllll}
\hline
Partial Autocorrelation Function \tabularnewline
Time lag k & PACF(k) & T-STAT & P-value \tabularnewline
1 & 0.936616 & 8.5842 & 0 \tabularnewline
2 & -0.049648 & -0.455 & 0.325131 \tabularnewline
3 & 0.023914 & 0.2192 & 0.413521 \tabularnewline
4 & -0.07823 & -0.717 & 0.237684 \tabularnewline
5 & 0.056771 & 0.5203 & 0.302106 \tabularnewline
6 & -0.167824 & -1.5381 & 0.063887 \tabularnewline
7 & -0.116291 & -1.0658 & 0.144779 \tabularnewline
8 & -0.071037 & -0.6511 & 0.258391 \tabularnewline
9 & -0.113085 & -1.0364 & 0.151485 \tabularnewline
10 & 0.136951 & 1.2552 & 0.106448 \tabularnewline
11 & -0.011503 & -0.1054 & 0.458143 \tabularnewline
12 & -0.058511 & -0.5363 & 0.296597 \tabularnewline
13 & -0.028755 & -0.2635 & 0.396389 \tabularnewline
14 & -0.0618 & -0.5664 & 0.286313 \tabularnewline
15 & 0.063372 & 0.5808 & 0.281462 \tabularnewline
16 & 0.19194 & 1.7592 & 0.041096 \tabularnewline
17 & -0.094551 & -0.8666 & 0.194322 \tabularnewline
18 & 0.074409 & 0.682 & 0.248566 \tabularnewline
19 & -0.057853 & -0.5302 & 0.298674 \tabularnewline
20 & -0.053221 & -0.4878 & 0.313487 \tabularnewline
21 & -0.136286 & -1.2491 & 0.107553 \tabularnewline
22 & 0.157213 & 1.4409 & 0.076668 \tabularnewline
23 & -0.047739 & -0.4375 & 0.331424 \tabularnewline
24 & 0.07544 & 0.6914 & 0.245605 \tabularnewline
25 & 0.028618 & 0.2623 & 0.396872 \tabularnewline
26 & 0.017493 & 0.1603 & 0.436503 \tabularnewline
27 & -0.05225 & -0.4789 & 0.316635 \tabularnewline
28 & -0.133614 & -1.2246 & 0.112075 \tabularnewline
29 & -0.048295 & -0.4426 & 0.329584 \tabularnewline
30 & 0.066649 & 0.6108 & 0.271476 \tabularnewline
31 & 0.08397 & 0.7696 & 0.22185 \tabularnewline
32 & -0.090371 & -0.8283 & 0.204934 \tabularnewline
33 & -0.037637 & -0.345 & 0.365496 \tabularnewline
34 & 0.053279 & 0.4883 & 0.313301 \tabularnewline
35 & -0.159149 & -1.4586 & 0.074199 \tabularnewline
36 & -0.077363 & -0.709 & 0.240131 \tabularnewline
37 & 0.046906 & 0.4299 & 0.334184 \tabularnewline
38 & -0.148868 & -1.3644 & 0.088044 \tabularnewline
39 & 0.008699 & 0.0797 & 0.468321 \tabularnewline
40 & 0.137432 & 1.2596 & 0.105654 \tabularnewline
41 & -0.070913 & -0.6499 & 0.258756 \tabularnewline
42 & -0.01748 & -0.1602 & 0.436553 \tabularnewline
43 & -0.015413 & -0.1413 & 0.444002 \tabularnewline
44 & -0.043071 & -0.3948 & 0.347011 \tabularnewline
45 & -0.049576 & -0.4544 & 0.325367 \tabularnewline
46 & -0.184438 & -1.6904 & 0.04733 \tabularnewline
47 & -0.019273 & -0.1766 & 0.430107 \tabularnewline
48 & -0.083044 & -0.7611 & 0.224362 \tabularnewline
\hline
\end{tabular}
%Source: https://freestatistics.org/blog/index.php?pk=235085&T=2

[TABLE]
[ROW][C]Partial Autocorrelation Function[/C][/ROW]
[ROW][C]Time lag k[/C][C]PACF(k)[/C][C]T-STAT[/C][C]P-value[/C][/ROW]
[ROW][C]1[/C][C]0.936616[/C][C]8.5842[/C][C]0[/C][/ROW]
[ROW][C]2[/C][C]-0.049648[/C][C]-0.455[/C][C]0.325131[/C][/ROW]
[ROW][C]3[/C][C]0.023914[/C][C]0.2192[/C][C]0.413521[/C][/ROW]
[ROW][C]4[/C][C]-0.07823[/C][C]-0.717[/C][C]0.237684[/C][/ROW]
[ROW][C]5[/C][C]0.056771[/C][C]0.5203[/C][C]0.302106[/C][/ROW]
[ROW][C]6[/C][C]-0.167824[/C][C]-1.5381[/C][C]0.063887[/C][/ROW]
[ROW][C]7[/C][C]-0.116291[/C][C]-1.0658[/C][C]0.144779[/C][/ROW]
[ROW][C]8[/C][C]-0.071037[/C][C]-0.6511[/C][C]0.258391[/C][/ROW]
[ROW][C]9[/C][C]-0.113085[/C][C]-1.0364[/C][C]0.151485[/C][/ROW]
[ROW][C]10[/C][C]0.136951[/C][C]1.2552[/C][C]0.106448[/C][/ROW]
[ROW][C]11[/C][C]-0.011503[/C][C]-0.1054[/C][C]0.458143[/C][/ROW]
[ROW][C]12[/C][C]-0.058511[/C][C]-0.5363[/C][C]0.296597[/C][/ROW]
[ROW][C]13[/C][C]-0.028755[/C][C]-0.2635[/C][C]0.396389[/C][/ROW]
[ROW][C]14[/C][C]-0.0618[/C][C]-0.5664[/C][C]0.286313[/C][/ROW]
[ROW][C]15[/C][C]0.063372[/C][C]0.5808[/C][C]0.281462[/C][/ROW]
[ROW][C]16[/C][C]0.19194[/C][C]1.7592[/C][C]0.041096[/C][/ROW]
[ROW][C]17[/C][C]-0.094551[/C][C]-0.8666[/C][C]0.194322[/C][/ROW]
[ROW][C]18[/C][C]0.074409[/C][C]0.682[/C][C]0.248566[/C][/ROW]
[ROW][C]19[/C][C]-0.057853[/C][C]-0.5302[/C][C]0.298674[/C][/ROW]
[ROW][C]20[/C][C]-0.053221[/C][C]-0.4878[/C][C]0.313487[/C][/ROW]
[ROW][C]21[/C][C]-0.136286[/C][C]-1.2491[/C][C]0.107553[/C][/ROW]
[ROW][C]22[/C][C]0.157213[/C][C]1.4409[/C][C]0.076668[/C][/ROW]
[ROW][C]23[/C][C]-0.047739[/C][C]-0.4375[/C][C]0.331424[/C][/ROW]
[ROW][C]24[/C][C]0.07544[/C][C]0.6914[/C][C]0.245605[/C][/ROW]
[ROW][C]25[/C][C]0.028618[/C][C]0.2623[/C][C]0.396872[/C][/ROW]
[ROW][C]26[/C][C]0.017493[/C][C]0.1603[/C][C]0.436503[/C][/ROW]
[ROW][C]27[/C][C]-0.05225[/C][C]-0.4789[/C][C]0.316635[/C][/ROW]
[ROW][C]28[/C][C]-0.133614[/C][C]-1.2246[/C][C]0.112075[/C][/ROW]
[ROW][C]29[/C][C]-0.048295[/C][C]-0.4426[/C][C]0.329584[/C][/ROW]
[ROW][C]30[/C][C]0.066649[/C][C]0.6108[/C][C]0.271476[/C][/ROW]
[ROW][C]31[/C][C]0.08397[/C][C]0.7696[/C][C]0.22185[/C][/ROW]
[ROW][C]32[/C][C]-0.090371[/C][C]-0.8283[/C][C]0.204934[/C][/ROW]
[ROW][C]33[/C][C]-0.037637[/C][C]-0.345[/C][C]0.365496[/C][/ROW]
[ROW][C]34[/C][C]0.053279[/C][C]0.4883[/C][C]0.313301[/C][/ROW]
[ROW][C]35[/C][C]-0.159149[/C][C]-1.4586[/C][C]0.074199[/C][/ROW]
[ROW][C]36[/C][C]-0.077363[/C][C]-0.709[/C][C]0.240131[/C][/ROW]
[ROW][C]37[/C][C]0.046906[/C][C]0.4299[/C][C]0.334184[/C][/ROW]
[ROW][C]38[/C][C]-0.148868[/C][C]-1.3644[/C][C]0.088044[/C][/ROW]
[ROW][C]39[/C][C]0.008699[/C][C]0.0797[/C][C]0.468321[/C][/ROW]
[ROW][C]40[/C][C]0.137432[/C][C]1.2596[/C][C]0.105654[/C][/ROW]
[ROW][C]41[/C][C]-0.070913[/C][C]-0.6499[/C][C]0.258756[/C][/ROW]
[ROW][C]42[/C][C]-0.01748[/C][C]-0.1602[/C][C]0.436553[/C][/ROW]
[ROW][C]43[/C][C]-0.015413[/C][C]-0.1413[/C][C]0.444002[/C][/ROW]
[ROW][C]44[/C][C]-0.043071[/C][C]-0.3948[/C][C]0.347011[/C][/ROW]
[ROW][C]45[/C][C]-0.049576[/C][C]-0.4544[/C][C]0.325367[/C][/ROW]
[ROW][C]46[/C][C]-0.184438[/C][C]-1.6904[/C][C]0.04733[/C][/ROW]
[ROW][C]47[/C][C]-0.019273[/C][C]-0.1766[/C][C]0.430107[/C][/ROW]
[ROW][C]48[/C][C]-0.083044[/C][C]-0.7611[/C][C]0.224362[/C][/ROW]
[/TABLE]
Source: https://freestatistics.org/blog/index.php?pk=235085&T=2

Globally Unique Identifier (entire table): ba.freestatistics.org/blog/index.php?pk=235085&T=2

As an alternative you can also use a QR Code:  

The GUIDs for individual cells are displayed in the table below:

Partial Autocorrelation Function
Time lag kPACF(k)T-STATP-value
10.9366168.58420
2-0.049648-0.4550.325131
30.0239140.21920.413521
4-0.07823-0.7170.237684
50.0567710.52030.302106
6-0.167824-1.53810.063887
7-0.116291-1.06580.144779
8-0.071037-0.65110.258391
9-0.113085-1.03640.151485
100.1369511.25520.106448
11-0.011503-0.10540.458143
12-0.058511-0.53630.296597
13-0.028755-0.26350.396389
14-0.0618-0.56640.286313
150.0633720.58080.281462
160.191941.75920.041096
17-0.094551-0.86660.194322
180.0744090.6820.248566
19-0.057853-0.53020.298674
20-0.053221-0.48780.313487
21-0.136286-1.24910.107553
220.1572131.44090.076668
23-0.047739-0.43750.331424
240.075440.69140.245605
250.0286180.26230.396872
260.0174930.16030.436503
27-0.05225-0.47890.316635
28-0.133614-1.22460.112075
29-0.048295-0.44260.329584
300.0666490.61080.271476
310.083970.76960.22185
32-0.090371-0.82830.204934
33-0.037637-0.3450.365496
340.0532790.48830.313301
35-0.159149-1.45860.074199
36-0.077363-0.7090.240131
370.0469060.42990.334184
38-0.148868-1.36440.088044
390.0086990.07970.468321
400.1374321.25960.105654
41-0.070913-0.64990.258756
42-0.01748-0.16020.436553
43-0.015413-0.14130.444002
44-0.043071-0.39480.347011
45-0.049576-0.45440.325367
46-0.184438-1.69040.04733
47-0.019273-0.17660.430107
48-0.083044-0.76110.224362


Parameters (Session):
par1 = 48 ; par2 = 1 ; par3 = 0 ; par4 = 0 ; par5 = 12 ; par6 = White Noise ; par7 = 0.95 ;
Parameters (R input):
par1 = 48 ; par2 = 1 ; par3 = 0 ; par4 = 0 ; par5 = 12 ; par6 = White Noise ; par7 = 0.95 ; par8 = ;
R code (references can be found in the software module):
if (par1 == 'Default') {
par1 = 10*log10(length(x))
} else {
par1 <- as.numeric(par1)
}
par2 <- as.numeric(par2)
par3 <- as.numeric(par3)
par4 <- as.numeric(par4)
par5 <- as.numeric(par5)
if (par6 == 'White Noise') par6 <- 'white' else par6 <- 'ma'
par7 <- as.numeric(par7)
if (par8 != '') par8 <- as.numeric(par8)
ox <- x
if (par8 == '') {
if (par2 == 0) {
x <- log(x)
} else {
x <- (x ^ par2 - 1) / par2
}
} else {
x <- log(x,base=par8)
}
if (par3 > 0) x <- diff(x,lag=1,difference=par3)
if (par4 > 0) x <- diff(x,lag=par5,difference=par4)
bitmap(file='picts.png')
op <- par(mfrow=c(2,1))
plot(ox,type='l',main='Original Time Series',xlab='time',ylab='value')
if (par8=='') {
mytitle <- paste('Working Time Series (lambda=',par2,', d=',par3,', D=',par4,')',sep='')
mysub <- paste('(lambda=',par2,', d=',par3,', D=',par4,', CI=', par7, ', CI type=',par6,')',sep='')
} else {
mytitle <- paste('Working Time Series (base=',par8,', d=',par3,', D=',par4,')',sep='')
mysub <- paste('(base=',par8,', d=',par3,', D=',par4,', CI=', par7, ', CI type=',par6,')',sep='')
}
plot(x,type='l', main=mytitle,xlab='time',ylab='value')
par(op)
dev.off()
bitmap(file='pic1.png')
racf <- acf(x, par1, main='Autocorrelation', xlab='time lag', ylab='ACF', ci.type=par6, ci=par7, sub=mysub)
dev.off()
bitmap(file='pic2.png')
rpacf <- pacf(x,par1,main='Partial Autocorrelation',xlab='lags',ylab='PACF',sub=mysub)
dev.off()
(myacf <- c(racf$acf))
(mypacf <- c(rpacf$acf))
lengthx <- length(x)
sqrtn <- sqrt(lengthx)
load(file='createtable')
a<-table.start()
a<-table.row.start(a)
a<-table.element(a,'Autocorrelation Function',4,TRUE)
a<-table.row.end(a)
a<-table.row.start(a)
a<-table.element(a,'Time lag k',header=TRUE)
a<-table.element(a,hyperlink('basics.htm','ACF(k)','click here for more information about the Autocorrelation Function'),header=TRUE)
a<-table.element(a,'T-STAT',header=TRUE)
a<-table.element(a,'P-value',header=TRUE)
a<-table.row.end(a)
for (i in 2:(par1+1)) {
a<-table.row.start(a)
a<-table.element(a,i-1,header=TRUE)
a<-table.element(a,round(myacf[i],6))
mytstat <- myacf[i]*sqrtn
a<-table.element(a,round(mytstat,4))
a<-table.element(a,round(1-pt(abs(mytstat),lengthx),6))
a<-table.row.end(a)
}
a<-table.end(a)
table.save(a,file='mytable.tab')
a<-table.start()
a<-table.row.start(a)
a<-table.element(a,'Partial Autocorrelation Function',4,TRUE)
a<-table.row.end(a)
a<-table.row.start(a)
a<-table.element(a,'Time lag k',header=TRUE)
a<-table.element(a,hyperlink('basics.htm','PACF(k)','click here for more information about the Partial Autocorrelation Function'),header=TRUE)
a<-table.element(a,'T-STAT',header=TRUE)
a<-table.element(a,'P-value',header=TRUE)
a<-table.row.end(a)
for (i in 1:par1) {
a<-table.row.start(a)
a<-table.element(a,i,header=TRUE)
a<-table.element(a,round(mypacf[i],6))
mytstat <- mypacf[i]*sqrtn
a<-table.element(a,round(mytstat,4))
a<-table.element(a,round(1-pt(abs(mytstat),lengthx),6))
a<-table.row.end(a)
}
a<-table.end(a)
table.save(a,file='mytable1.tab')