Free Statistics

of Irreproducible Research!

Author's title

Author*Unverified author*
R Software Modulerwasp_correlation.wasp
Title produced by softwarePearson Correlation
Date of computationThu, 22 May 2014 09:44:31 -0400
Cite this page as followsStatistical Computations at FreeStatistics.org, Office for Research Development and Education, URL https://freestatistics.org/blog/index.php?v=date/2014/May/22/t1400766408ypwf0vbkmf0qnde.htm/, Retrieved Wed, 15 May 2024 05:37:13 +0000
Statistical Computations at FreeStatistics.org, Office for Research Development and Education, URL https://freestatistics.org/blog/index.php?pk=235121, Retrieved Wed, 15 May 2024 05:37:13 +0000
QR Codes:

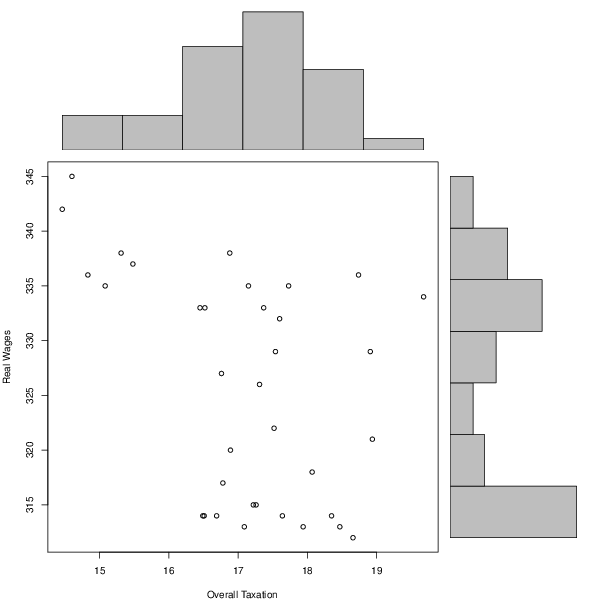
Original text written by user:Overall taxation computed as revenue plus borrowing Earnings from http://data.bls.gov/timeseries/LEU0252881600
IsPrivate?No (this computation is public)
User-defined keywords
Estimated Impact113
Family? (F = Feedback message, R = changed R code, M = changed R Module, P = changed Parameters, D = changed Data)
-       [Pearson Correlation] [Taxation vs worke...] [2014-05-22 13:44:31] [d41d8cd98f00b204e9800998ecf8427e] [Current]
Feedback Forum

Post a new message
Dataseries X:
17.6
18.07
18.66
18.47
16.51
16.49
16.89
16.76
17.54
17.31
17.52
17.26
17.09
16.69
16.78
17.22
17.64
17.94
18.35
18.94
18.91
19.68
18.74
16.88
15.48
15.31
16.45
17.37
17.73
17.15
14.6
14.46
14.83
15.08
16.52
Dataseries Y:
332
318
312
313
314
314
320
327
329
326
322
315
313
314
317
315
314
313
314
321
329
334
336
338
337
338
333
333
335
335
345
342
336
335
333


Summary of computational transaction
Raw Inputview raw input (R code)
Raw Outputview raw output of R engine
Computing time1 seconds
R Server'Gertrude Mary Cox' @ cox.wessa.net

\begin{tabular}{lllllllll}
\hline
Summary of computational transaction \tabularnewline
Raw Input & view raw input (R code)  \tabularnewline
Raw Output & view raw output of R engine  \tabularnewline
Computing time & 1 seconds \tabularnewline
R Server & 'Gertrude Mary Cox' @ cox.wessa.net \tabularnewline
\hline
\end{tabular}
%Source: https://freestatistics.org/blog/index.php?pk=235121&T=0

[TABLE]
[ROW][C]Summary of computational transaction[/C][/ROW]
[ROW][C]Raw Input[/C][C]view raw input (R code) [/C][/ROW]
[ROW][C]Raw Output[/C][C]view raw output of R engine [/C][/ROW]
[ROW][C]Computing time[/C][C]1 seconds[/C][/ROW]
[ROW][C]R Server[/C][C]'Gertrude Mary Cox' @ cox.wessa.net[/C][/ROW]
[/TABLE]
Source: https://freestatistics.org/blog/index.php?pk=235121&T=0

Globally Unique Identifier (entire table): ba.freestatistics.org/blog/index.php?pk=235121&T=0

As an alternative you can also use a QR Code:  

The GUIDs for individual cells are displayed in the table below:

Summary of computational transaction
Raw Inputview raw input (R code)
Raw Outputview raw output of R engine
Computing time1 seconds
R Server'Gertrude Mary Cox' @ cox.wessa.net


Pearson Product Moment Correlation - Ungrouped Data
StatisticVariable XVariable Y
Mean17.112325.771428571429
Biased Variance1.57798171428571103.433469387755
Biased Standard Deviation1.2561774214997310.170224647851
Covariance-5.78805882352941
Correlation-0.440111057085618
Determination0.19369774256902
T-Test-2.81559581970401
p-value (2 sided)0.0081514446173971
p-value (1 sided)0.00407572230869855
Degrees of Freedom33
Number of Observations35

\begin{tabular}{lllllllll}
\hline
Pearson Product Moment Correlation - Ungrouped Data \tabularnewline
Statistic & Variable X & Variable Y \tabularnewline
Mean & 17.112 & 325.771428571429 \tabularnewline
Biased Variance & 1.57798171428571 & 103.433469387755 \tabularnewline
Biased Standard Deviation & 1.25617742149973 & 10.170224647851 \tabularnewline
Covariance & -5.78805882352941 \tabularnewline
Correlation & -0.440111057085618 \tabularnewline
Determination & 0.19369774256902 \tabularnewline
T-Test & -2.81559581970401 \tabularnewline
p-value (2 sided) & 0.0081514446173971 \tabularnewline
p-value (1 sided) & 0.00407572230869855 \tabularnewline
Degrees of Freedom & 33 \tabularnewline
Number of Observations & 35 \tabularnewline
\hline
\end{tabular}
%Source: https://freestatistics.org/blog/index.php?pk=235121&T=1

[TABLE]
[ROW][C]Pearson Product Moment Correlation - Ungrouped Data[/C][/ROW]
[ROW][C]Statistic[/C][C]Variable X[/C][C]Variable Y[/C][/ROW]
[ROW][C]Mean[/C][C]17.112[/C][C]325.771428571429[/C][/ROW]
[ROW][C]Biased Variance[/C][C]1.57798171428571[/C][C]103.433469387755[/C][/ROW]
[ROW][C]Biased Standard Deviation[/C][C]1.25617742149973[/C][C]10.170224647851[/C][/ROW]
[ROW][C]Covariance[/C][C]-5.78805882352941[/C][/ROW]
[ROW][C]Correlation[/C][C]-0.440111057085618[/C][/ROW]
[ROW][C]Determination[/C][C]0.19369774256902[/C][/ROW]
[ROW][C]T-Test[/C][C]-2.81559581970401[/C][/ROW]
[ROW][C]p-value (2 sided)[/C][C]0.0081514446173971[/C][/ROW]
[ROW][C]p-value (1 sided)[/C][C]0.00407572230869855[/C][/ROW]
[ROW][C]Degrees of Freedom[/C][C]33[/C][/ROW]
[ROW][C]Number of Observations[/C][C]35[/C][/ROW]
[/TABLE]
Source: https://freestatistics.org/blog/index.php?pk=235121&T=1

Globally Unique Identifier (entire table): ba.freestatistics.org/blog/index.php?pk=235121&T=1

As an alternative you can also use a QR Code:  

The GUIDs for individual cells are displayed in the table below:

Pearson Product Moment Correlation - Ungrouped Data
StatisticVariable XVariable Y
Mean17.112325.771428571429
Biased Variance1.57798171428571103.433469387755
Biased Standard Deviation1.2561774214997310.170224647851
Covariance-5.78805882352941
Correlation-0.440111057085618
Determination0.19369774256902
T-Test-2.81559581970401
p-value (2 sided)0.0081514446173971
p-value (1 sided)0.00407572230869855
Degrees of Freedom33
Number of Observations35


Parameters (Session):
Parameters (R input):
R code (references can be found in the software module):
x <- x[!is.na(y)]
y <- y[!is.na(y)]
y <- y[!is.na(x)]
x <- x[!is.na(x)]
bitmap(file='test1.png')
histx <- hist(x, plot=FALSE)
histy <- hist(y, plot=FALSE)
maxcounts <- max(c(histx$counts, histx$counts))
xrange <- c(min(x),max(x))
yrange <- c(min(y),max(y))
nf <- layout(matrix(c(2,0,1,3),2,2,byrow=TRUE), c(3,1), c(1,3), TRUE)
par(mar=c(4,4,1,1))
plot(x, y, xlim=xrange, ylim=yrange, xlab=xlab, ylab=ylab)
par(mar=c(0,4,1,1))
barplot(histx$counts, axes=FALSE, ylim=c(0, maxcounts), space=0)
par(mar=c(4,0,1,1))
barplot(histy$counts, axes=FALSE, xlim=c(0, maxcounts), space=0, horiz=TRUE)
dev.off()
lx = length(x)
makebiased = (lx-1)/lx
varx = var(x)*makebiased
vary = var(y)*makebiased
corxy <- cor.test(x,y,method='pearson', na.rm = T)
cxy <- as.matrix(corxy$estimate)[1,1]
load(file='createtable')
a<-table.start()
a<-table.row.start(a)
a<-table.element(a,'Pearson Product Moment Correlation - Ungrouped Data',3,TRUE)
a<-table.row.end(a)
a<-table.row.start(a)
a<-table.element(a,'Statistic',1,TRUE)
a<-table.element(a,'Variable X',1,TRUE)
a<-table.element(a,'Variable Y',1,TRUE)
a<-table.row.end(a)
a<-table.row.start(a)
a<-table.element(a,hyperlink('arithmetic_mean.htm','Mean',''),header=TRUE)
a<-table.element(a,mean(x))
a<-table.element(a,mean(y))
a<-table.row.end(a)
a<-table.row.start(a)
a<-table.element(a,hyperlink('biased.htm','Biased Variance',''),header=TRUE)
a<-table.element(a,varx)
a<-table.element(a,vary)
a<-table.row.end(a)
a<-table.row.start(a)
a<-table.element(a,hyperlink('biased1.htm','Biased Standard Deviation',''),header=TRUE)
a<-table.element(a,sqrt(varx))
a<-table.element(a,sqrt(vary))
a<-table.row.end(a)
a<-table.row.start(a)
a<-table.element(a,hyperlink('covariance.htm','Covariance',''),header=TRUE)
a<-table.element(a,cov(x,y),2)
a<-table.row.end(a)
a<-table.row.start(a)
a<-table.element(a,hyperlink('pearson_correlation.htm','Correlation',''),header=TRUE)
a<-table.element(a,cxy,2)
a<-table.row.end(a)
a<-table.row.start(a)
a<-table.element(a,hyperlink('coeff_of_determination.htm','Determination',''),header=TRUE)
a<-table.element(a,cxy*cxy,2)
a<-table.row.end(a)
a<-table.row.start(a)
a<-table.element(a,hyperlink('ttest_statistic.htm','T-Test',''),header=TRUE)
a<-table.element(a,as.matrix(corxy$statistic)[1,1],2)
a<-table.row.end(a)
a<-table.row.start(a)
a<-table.element(a,'p-value (2 sided)',header=TRUE)
a<-table.element(a,(p2 <- as.matrix(corxy$p.value)[1,1]),2)
a<-table.row.end(a)
a<-table.row.start(a)
a<-table.element(a,'p-value (1 sided)',header=TRUE)
a<-table.element(a,p2/2,2)
a<-table.row.end(a)
a<-table.row.start(a)
a<-table.element(a,'Degrees of Freedom',header=TRUE)
a<-table.element(a,lx-2,2)
a<-table.row.end(a)
a<-table.row.start(a)
a<-table.element(a,'Number of Observations',header=TRUE)
a<-table.element(a,lx,2)
a<-table.row.end(a)
a<-table.end(a)
table.save(a,file='mytable.tab')