Free Statistics

of Irreproducible Research!

Author's title

Author*Unverified author*
R Software Modulerwasp_autocorrelation.wasp
Title produced by software(Partial) Autocorrelation Function
Date of computationFri, 23 May 2014 03:27:51 -0400
Cite this page as followsStatistical Computations at FreeStatistics.org, Office for Research Development and Education, URL https://freestatistics.org/blog/index.php?v=date/2014/May/23/t1400830092svddkwh8bvyb09i.htm/, Retrieved Mon, 13 May 2024 23:13:05 +0000
Statistical Computations at FreeStatistics.org, Office for Research Development and Education, URL https://freestatistics.org/blog/index.php?pk=235208, Retrieved Mon, 13 May 2024 23:13:05 +0000
QR Codes:

Original text written by user:
IsPrivate?No (this computation is public)
User-defined keywords
Estimated Impact151
Family? (F = Feedback message, R = changed R code, M = changed R Module, P = changed Parameters, D = changed Data)
-     [(Partial) Autocorrelation Function] [] [2014-05-23 07:17:28] [68b3e6320f252e1f50534bfc7f55de90]
- R P     [(Partial) Autocorrelation Function] [] [2014-05-23 07:27:51] [0a29af7e4d8d6424b8240e38ffd48a3a] [Current]
Feedback Forum

Post a new message
Dataseries X:
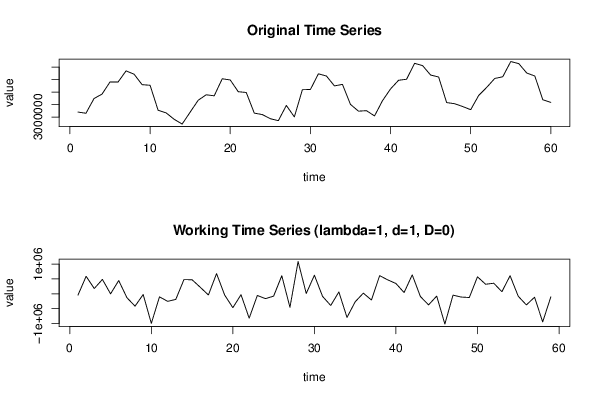
3200944
3153170
3741498
3918719
4403449
4400407
4847473
4716136
4297440
4272253
3271834
3168388
2911748
2720999
3199918
3672623
3892013
3850845
4532467
4484739
4014972
3983758
3158459
3100569
2935404
2855719
3465611
3006985
4095110
4104793
4730788
4642726
4246919
4308032
3508154
3236641
3257275
3045631
3657692
4125747
4472507
4513455
5150896
5057815
4681742
4603682
3580181
3534002
3422762
3295209
3868093
4189245
4544332
4612845
5221595
5137505
4760439
4643697
3692267
3587603


Summary of computational transaction
Raw Inputview raw input (R code)
Raw Outputview raw output of R engine
Computing time2 seconds
R Server'Gwilym Jenkins' @ jenkins.wessa.net

\begin{tabular}{lllllllll}
\hline
Summary of computational transaction \tabularnewline
Raw Input & view raw input (R code)  \tabularnewline
Raw Output & view raw output of R engine  \tabularnewline
Computing time & 2 seconds \tabularnewline
R Server & 'Gwilym Jenkins' @ jenkins.wessa.net \tabularnewline
\hline
\end{tabular}
%Source: https://freestatistics.org/blog/index.php?pk=235208&T=0

[TABLE]
[ROW][C]Summary of computational transaction[/C][/ROW]
[ROW][C]Raw Input[/C][C]view raw input (R code) [/C][/ROW]
[ROW][C]Raw Output[/C][C]view raw output of R engine [/C][/ROW]
[ROW][C]Computing time[/C][C]2 seconds[/C][/ROW]
[ROW][C]R Server[/C][C]'Gwilym Jenkins' @ jenkins.wessa.net[/C][/ROW]
[/TABLE]
Source: https://freestatistics.org/blog/index.php?pk=235208&T=0

Globally Unique Identifier (entire table): ba.freestatistics.org/blog/index.php?pk=235208&T=0

As an alternative you can also use a QR Code:  

The GUIDs for individual cells are displayed in the table below:

Summary of computational transaction
Raw Inputview raw input (R code)
Raw Outputview raw output of R engine
Computing time2 seconds
R Server'Gwilym Jenkins' @ jenkins.wessa.net


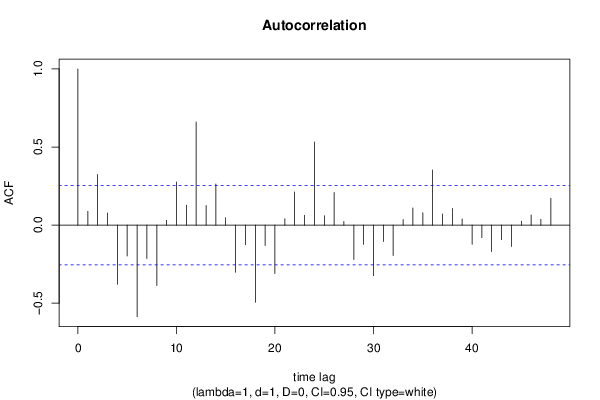
Autocorrelation Function
Time lag kACF(k)T-STATP-value
10.0879180.67530.251058
20.3240462.4890.007824
30.0774620.5950.277062
4-0.37869-2.90880.002554
5-0.197596-1.51780.067207
6-0.586207-4.50271.6e-05
7-0.214378-1.64670.052471
8-0.387302-2.97490.002121
90.0312550.24010.405551
100.2758062.11850.019177
110.1272090.97710.166251
120.6608695.07622e-06
130.1250970.96090.170264
140.2630822.02080.023925
150.0469850.36090.359732
16-0.301806-2.31820.011962
17-0.126093-0.96850.168365
18-0.494286-3.79670.000174
19-0.130384-1.00150.160338
20-0.309671-2.37860.010316
210.0412390.31680.37627
220.2119681.62820.05441
230.0634640.48750.313863
240.5327264.09196.6e-05
250.0596830.45840.324163
260.2091491.60650.056752
270.0234040.17980.428975
28-0.220181-1.69120.048033
29-0.123612-0.94950.173125
30-0.324169-2.490.007806
31-0.105112-0.80740.211345
32-0.194929-1.49730.069826
330.035410.2720.393289
340.1101140.84580.20054
350.0794760.61050.271949
360.3528262.71010.004396
370.0708770.54440.294103
380.1063130.81660.20872
390.0390250.29980.382709
40-0.122733-0.94270.174832
41-0.080436-0.61780.269528
42-0.169272-1.30020.099294
43-0.093008-0.71440.238896
44-0.13746-1.05580.147671
450.0246550.18940.425223
460.0648810.49840.31004
470.0370940.28490.388349
480.1722941.32340.095402

\begin{tabular}{lllllllll}
\hline
Autocorrelation Function \tabularnewline
Time lag k & ACF(k) & T-STAT & P-value \tabularnewline
1 & 0.087918 & 0.6753 & 0.251058 \tabularnewline
2 & 0.324046 & 2.489 & 0.007824 \tabularnewline
3 & 0.077462 & 0.595 & 0.277062 \tabularnewline
4 & -0.37869 & -2.9088 & 0.002554 \tabularnewline
5 & -0.197596 & -1.5178 & 0.067207 \tabularnewline
6 & -0.586207 & -4.5027 & 1.6e-05 \tabularnewline
7 & -0.214378 & -1.6467 & 0.052471 \tabularnewline
8 & -0.387302 & -2.9749 & 0.002121 \tabularnewline
9 & 0.031255 & 0.2401 & 0.405551 \tabularnewline
10 & 0.275806 & 2.1185 & 0.019177 \tabularnewline
11 & 0.127209 & 0.9771 & 0.166251 \tabularnewline
12 & 0.660869 & 5.0762 & 2e-06 \tabularnewline
13 & 0.125097 & 0.9609 & 0.170264 \tabularnewline
14 & 0.263082 & 2.0208 & 0.023925 \tabularnewline
15 & 0.046985 & 0.3609 & 0.359732 \tabularnewline
16 & -0.301806 & -2.3182 & 0.011962 \tabularnewline
17 & -0.126093 & -0.9685 & 0.168365 \tabularnewline
18 & -0.494286 & -3.7967 & 0.000174 \tabularnewline
19 & -0.130384 & -1.0015 & 0.160338 \tabularnewline
20 & -0.309671 & -2.3786 & 0.010316 \tabularnewline
21 & 0.041239 & 0.3168 & 0.37627 \tabularnewline
22 & 0.211968 & 1.6282 & 0.05441 \tabularnewline
23 & 0.063464 & 0.4875 & 0.313863 \tabularnewline
24 & 0.532726 & 4.0919 & 6.6e-05 \tabularnewline
25 & 0.059683 & 0.4584 & 0.324163 \tabularnewline
26 & 0.209149 & 1.6065 & 0.056752 \tabularnewline
27 & 0.023404 & 0.1798 & 0.428975 \tabularnewline
28 & -0.220181 & -1.6912 & 0.048033 \tabularnewline
29 & -0.123612 & -0.9495 & 0.173125 \tabularnewline
30 & -0.324169 & -2.49 & 0.007806 \tabularnewline
31 & -0.105112 & -0.8074 & 0.211345 \tabularnewline
32 & -0.194929 & -1.4973 & 0.069826 \tabularnewline
33 & 0.03541 & 0.272 & 0.393289 \tabularnewline
34 & 0.110114 & 0.8458 & 0.20054 \tabularnewline
35 & 0.079476 & 0.6105 & 0.271949 \tabularnewline
36 & 0.352826 & 2.7101 & 0.004396 \tabularnewline
37 & 0.070877 & 0.5444 & 0.294103 \tabularnewline
38 & 0.106313 & 0.8166 & 0.20872 \tabularnewline
39 & 0.039025 & 0.2998 & 0.382709 \tabularnewline
40 & -0.122733 & -0.9427 & 0.174832 \tabularnewline
41 & -0.080436 & -0.6178 & 0.269528 \tabularnewline
42 & -0.169272 & -1.3002 & 0.099294 \tabularnewline
43 & -0.093008 & -0.7144 & 0.238896 \tabularnewline
44 & -0.13746 & -1.0558 & 0.147671 \tabularnewline
45 & 0.024655 & 0.1894 & 0.425223 \tabularnewline
46 & 0.064881 & 0.4984 & 0.31004 \tabularnewline
47 & 0.037094 & 0.2849 & 0.388349 \tabularnewline
48 & 0.172294 & 1.3234 & 0.095402 \tabularnewline
\hline
\end{tabular}
%Source: https://freestatistics.org/blog/index.php?pk=235208&T=1

[TABLE]
[ROW][C]Autocorrelation Function[/C][/ROW]
[ROW][C]Time lag k[/C][C]ACF(k)[/C][C]T-STAT[/C][C]P-value[/C][/ROW]
[ROW][C]1[/C][C]0.087918[/C][C]0.6753[/C][C]0.251058[/C][/ROW]
[ROW][C]2[/C][C]0.324046[/C][C]2.489[/C][C]0.007824[/C][/ROW]
[ROW][C]3[/C][C]0.077462[/C][C]0.595[/C][C]0.277062[/C][/ROW]
[ROW][C]4[/C][C]-0.37869[/C][C]-2.9088[/C][C]0.002554[/C][/ROW]
[ROW][C]5[/C][C]-0.197596[/C][C]-1.5178[/C][C]0.067207[/C][/ROW]
[ROW][C]6[/C][C]-0.586207[/C][C]-4.5027[/C][C]1.6e-05[/C][/ROW]
[ROW][C]7[/C][C]-0.214378[/C][C]-1.6467[/C][C]0.052471[/C][/ROW]
[ROW][C]8[/C][C]-0.387302[/C][C]-2.9749[/C][C]0.002121[/C][/ROW]
[ROW][C]9[/C][C]0.031255[/C][C]0.2401[/C][C]0.405551[/C][/ROW]
[ROW][C]10[/C][C]0.275806[/C][C]2.1185[/C][C]0.019177[/C][/ROW]
[ROW][C]11[/C][C]0.127209[/C][C]0.9771[/C][C]0.166251[/C][/ROW]
[ROW][C]12[/C][C]0.660869[/C][C]5.0762[/C][C]2e-06[/C][/ROW]
[ROW][C]13[/C][C]0.125097[/C][C]0.9609[/C][C]0.170264[/C][/ROW]
[ROW][C]14[/C][C]0.263082[/C][C]2.0208[/C][C]0.023925[/C][/ROW]
[ROW][C]15[/C][C]0.046985[/C][C]0.3609[/C][C]0.359732[/C][/ROW]
[ROW][C]16[/C][C]-0.301806[/C][C]-2.3182[/C][C]0.011962[/C][/ROW]
[ROW][C]17[/C][C]-0.126093[/C][C]-0.9685[/C][C]0.168365[/C][/ROW]
[ROW][C]18[/C][C]-0.494286[/C][C]-3.7967[/C][C]0.000174[/C][/ROW]
[ROW][C]19[/C][C]-0.130384[/C][C]-1.0015[/C][C]0.160338[/C][/ROW]
[ROW][C]20[/C][C]-0.309671[/C][C]-2.3786[/C][C]0.010316[/C][/ROW]
[ROW][C]21[/C][C]0.041239[/C][C]0.3168[/C][C]0.37627[/C][/ROW]
[ROW][C]22[/C][C]0.211968[/C][C]1.6282[/C][C]0.05441[/C][/ROW]
[ROW][C]23[/C][C]0.063464[/C][C]0.4875[/C][C]0.313863[/C][/ROW]
[ROW][C]24[/C][C]0.532726[/C][C]4.0919[/C][C]6.6e-05[/C][/ROW]
[ROW][C]25[/C][C]0.059683[/C][C]0.4584[/C][C]0.324163[/C][/ROW]
[ROW][C]26[/C][C]0.209149[/C][C]1.6065[/C][C]0.056752[/C][/ROW]
[ROW][C]27[/C][C]0.023404[/C][C]0.1798[/C][C]0.428975[/C][/ROW]
[ROW][C]28[/C][C]-0.220181[/C][C]-1.6912[/C][C]0.048033[/C][/ROW]
[ROW][C]29[/C][C]-0.123612[/C][C]-0.9495[/C][C]0.173125[/C][/ROW]
[ROW][C]30[/C][C]-0.324169[/C][C]-2.49[/C][C]0.007806[/C][/ROW]
[ROW][C]31[/C][C]-0.105112[/C][C]-0.8074[/C][C]0.211345[/C][/ROW]
[ROW][C]32[/C][C]-0.194929[/C][C]-1.4973[/C][C]0.069826[/C][/ROW]
[ROW][C]33[/C][C]0.03541[/C][C]0.272[/C][C]0.393289[/C][/ROW]
[ROW][C]34[/C][C]0.110114[/C][C]0.8458[/C][C]0.20054[/C][/ROW]
[ROW][C]35[/C][C]0.079476[/C][C]0.6105[/C][C]0.271949[/C][/ROW]
[ROW][C]36[/C][C]0.352826[/C][C]2.7101[/C][C]0.004396[/C][/ROW]
[ROW][C]37[/C][C]0.070877[/C][C]0.5444[/C][C]0.294103[/C][/ROW]
[ROW][C]38[/C][C]0.106313[/C][C]0.8166[/C][C]0.20872[/C][/ROW]
[ROW][C]39[/C][C]0.039025[/C][C]0.2998[/C][C]0.382709[/C][/ROW]
[ROW][C]40[/C][C]-0.122733[/C][C]-0.9427[/C][C]0.174832[/C][/ROW]
[ROW][C]41[/C][C]-0.080436[/C][C]-0.6178[/C][C]0.269528[/C][/ROW]
[ROW][C]42[/C][C]-0.169272[/C][C]-1.3002[/C][C]0.099294[/C][/ROW]
[ROW][C]43[/C][C]-0.093008[/C][C]-0.7144[/C][C]0.238896[/C][/ROW]
[ROW][C]44[/C][C]-0.13746[/C][C]-1.0558[/C][C]0.147671[/C][/ROW]
[ROW][C]45[/C][C]0.024655[/C][C]0.1894[/C][C]0.425223[/C][/ROW]
[ROW][C]46[/C][C]0.064881[/C][C]0.4984[/C][C]0.31004[/C][/ROW]
[ROW][C]47[/C][C]0.037094[/C][C]0.2849[/C][C]0.388349[/C][/ROW]
[ROW][C]48[/C][C]0.172294[/C][C]1.3234[/C][C]0.095402[/C][/ROW]
[/TABLE]
Source: https://freestatistics.org/blog/index.php?pk=235208&T=1

Globally Unique Identifier (entire table): ba.freestatistics.org/blog/index.php?pk=235208&T=1

As an alternative you can also use a QR Code:  

The GUIDs for individual cells are displayed in the table below:

Autocorrelation Function
Time lag kACF(k)T-STATP-value
10.0879180.67530.251058
20.3240462.4890.007824
30.0774620.5950.277062
4-0.37869-2.90880.002554
5-0.197596-1.51780.067207
6-0.586207-4.50271.6e-05
7-0.214378-1.64670.052471
8-0.387302-2.97490.002121
90.0312550.24010.405551
100.2758062.11850.019177
110.1272090.97710.166251
120.6608695.07622e-06
130.1250970.96090.170264
140.2630822.02080.023925
150.0469850.36090.359732
16-0.301806-2.31820.011962
17-0.126093-0.96850.168365
18-0.494286-3.79670.000174
19-0.130384-1.00150.160338
20-0.309671-2.37860.010316
210.0412390.31680.37627
220.2119681.62820.05441
230.0634640.48750.313863
240.5327264.09196.6e-05
250.0596830.45840.324163
260.2091491.60650.056752
270.0234040.17980.428975
28-0.220181-1.69120.048033
29-0.123612-0.94950.173125
30-0.324169-2.490.007806
31-0.105112-0.80740.211345
32-0.194929-1.49730.069826
330.035410.2720.393289
340.1101140.84580.20054
350.0794760.61050.271949
360.3528262.71010.004396
370.0708770.54440.294103
380.1063130.81660.20872
390.0390250.29980.382709
40-0.122733-0.94270.174832
41-0.080436-0.61780.269528
42-0.169272-1.30020.099294
43-0.093008-0.71440.238896
44-0.13746-1.05580.147671
450.0246550.18940.425223
460.0648810.49840.31004
470.0370940.28490.388349
480.1722941.32340.095402


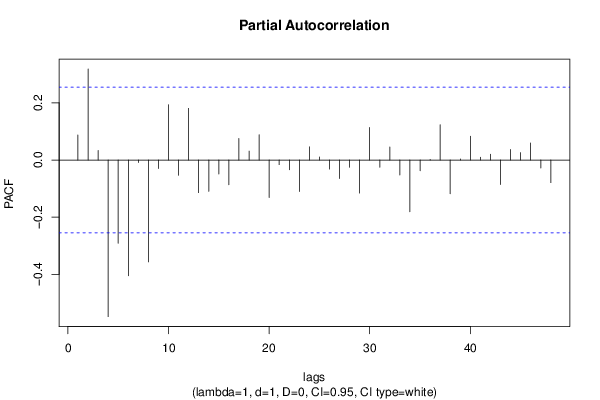
Partial Autocorrelation Function
Time lag kPACF(k)T-STATP-value
10.0879180.67530.251058
20.3187812.44860.008666
30.0336840.25870.398371
4-0.548172-4.21064.4e-05
5-0.291285-2.23740.014525
6-0.40508-3.11150.001434
7-0.008542-0.06560.473954
8-0.356485-2.73820.004077
9-0.02953-0.22680.410674
100.1933641.48530.0714
11-0.053452-0.41060.341436
120.1807481.38840.085125
13-0.114187-0.87710.191999
14-0.109606-0.84190.201621
15-0.048757-0.37450.354683
16-0.08646-0.66410.254603
170.0755420.58020.281978
180.0313120.24050.405383
190.0884440.67930.249787
20-0.131307-1.00860.158646
21-0.016053-0.12330.451142
22-0.034091-0.26190.397172
23-0.110253-0.84690.200245
240.045980.35320.362606
250.0103850.07980.468344
26-0.031747-0.24390.404096
27-0.064644-0.49650.310679
28-0.025594-0.19660.422412
29-0.115755-0.88910.188772
300.1137610.87380.19288
31-0.02547-0.19560.422782
320.0459090.35260.362809
33-0.052258-0.40140.344789
34-0.180934-1.38980.084909
35-0.037336-0.28680.387643
360.0016330.01250.495019
370.1232140.94640.173895
38-0.118014-0.90650.184183
390.0037770.0290.488477
400.0830580.6380.262977
410.0099290.07630.469732
420.0204650.15720.437814
43-0.085701-0.65830.256458
440.0369380.28370.388807
450.0258210.19830.421732
460.0595260.45720.324593
47-0.027939-0.21460.415408
48-0.07923-0.60860.27257

\begin{tabular}{lllllllll}
\hline
Partial Autocorrelation Function \tabularnewline
Time lag k & PACF(k) & T-STAT & P-value \tabularnewline
1 & 0.087918 & 0.6753 & 0.251058 \tabularnewline
2 & 0.318781 & 2.4486 & 0.008666 \tabularnewline
3 & 0.033684 & 0.2587 & 0.398371 \tabularnewline
4 & -0.548172 & -4.2106 & 4.4e-05 \tabularnewline
5 & -0.291285 & -2.2374 & 0.014525 \tabularnewline
6 & -0.40508 & -3.1115 & 0.001434 \tabularnewline
7 & -0.008542 & -0.0656 & 0.473954 \tabularnewline
8 & -0.356485 & -2.7382 & 0.004077 \tabularnewline
9 & -0.02953 & -0.2268 & 0.410674 \tabularnewline
10 & 0.193364 & 1.4853 & 0.0714 \tabularnewline
11 & -0.053452 & -0.4106 & 0.341436 \tabularnewline
12 & 0.180748 & 1.3884 & 0.085125 \tabularnewline
13 & -0.114187 & -0.8771 & 0.191999 \tabularnewline
14 & -0.109606 & -0.8419 & 0.201621 \tabularnewline
15 & -0.048757 & -0.3745 & 0.354683 \tabularnewline
16 & -0.08646 & -0.6641 & 0.254603 \tabularnewline
17 & 0.075542 & 0.5802 & 0.281978 \tabularnewline
18 & 0.031312 & 0.2405 & 0.405383 \tabularnewline
19 & 0.088444 & 0.6793 & 0.249787 \tabularnewline
20 & -0.131307 & -1.0086 & 0.158646 \tabularnewline
21 & -0.016053 & -0.1233 & 0.451142 \tabularnewline
22 & -0.034091 & -0.2619 & 0.397172 \tabularnewline
23 & -0.110253 & -0.8469 & 0.200245 \tabularnewline
24 & 0.04598 & 0.3532 & 0.362606 \tabularnewline
25 & 0.010385 & 0.0798 & 0.468344 \tabularnewline
26 & -0.031747 & -0.2439 & 0.404096 \tabularnewline
27 & -0.064644 & -0.4965 & 0.310679 \tabularnewline
28 & -0.025594 & -0.1966 & 0.422412 \tabularnewline
29 & -0.115755 & -0.8891 & 0.188772 \tabularnewline
30 & 0.113761 & 0.8738 & 0.19288 \tabularnewline
31 & -0.02547 & -0.1956 & 0.422782 \tabularnewline
32 & 0.045909 & 0.3526 & 0.362809 \tabularnewline
33 & -0.052258 & -0.4014 & 0.344789 \tabularnewline
34 & -0.180934 & -1.3898 & 0.084909 \tabularnewline
35 & -0.037336 & -0.2868 & 0.387643 \tabularnewline
36 & 0.001633 & 0.0125 & 0.495019 \tabularnewline
37 & 0.123214 & 0.9464 & 0.173895 \tabularnewline
38 & -0.118014 & -0.9065 & 0.184183 \tabularnewline
39 & 0.003777 & 0.029 & 0.488477 \tabularnewline
40 & 0.083058 & 0.638 & 0.262977 \tabularnewline
41 & 0.009929 & 0.0763 & 0.469732 \tabularnewline
42 & 0.020465 & 0.1572 & 0.437814 \tabularnewline
43 & -0.085701 & -0.6583 & 0.256458 \tabularnewline
44 & 0.036938 & 0.2837 & 0.388807 \tabularnewline
45 & 0.025821 & 0.1983 & 0.421732 \tabularnewline
46 & 0.059526 & 0.4572 & 0.324593 \tabularnewline
47 & -0.027939 & -0.2146 & 0.415408 \tabularnewline
48 & -0.07923 & -0.6086 & 0.27257 \tabularnewline
\hline
\end{tabular}
%Source: https://freestatistics.org/blog/index.php?pk=235208&T=2

[TABLE]
[ROW][C]Partial Autocorrelation Function[/C][/ROW]
[ROW][C]Time lag k[/C][C]PACF(k)[/C][C]T-STAT[/C][C]P-value[/C][/ROW]
[ROW][C]1[/C][C]0.087918[/C][C]0.6753[/C][C]0.251058[/C][/ROW]
[ROW][C]2[/C][C]0.318781[/C][C]2.4486[/C][C]0.008666[/C][/ROW]
[ROW][C]3[/C][C]0.033684[/C][C]0.2587[/C][C]0.398371[/C][/ROW]
[ROW][C]4[/C][C]-0.548172[/C][C]-4.2106[/C][C]4.4e-05[/C][/ROW]
[ROW][C]5[/C][C]-0.291285[/C][C]-2.2374[/C][C]0.014525[/C][/ROW]
[ROW][C]6[/C][C]-0.40508[/C][C]-3.1115[/C][C]0.001434[/C][/ROW]
[ROW][C]7[/C][C]-0.008542[/C][C]-0.0656[/C][C]0.473954[/C][/ROW]
[ROW][C]8[/C][C]-0.356485[/C][C]-2.7382[/C][C]0.004077[/C][/ROW]
[ROW][C]9[/C][C]-0.02953[/C][C]-0.2268[/C][C]0.410674[/C][/ROW]
[ROW][C]10[/C][C]0.193364[/C][C]1.4853[/C][C]0.0714[/C][/ROW]
[ROW][C]11[/C][C]-0.053452[/C][C]-0.4106[/C][C]0.341436[/C][/ROW]
[ROW][C]12[/C][C]0.180748[/C][C]1.3884[/C][C]0.085125[/C][/ROW]
[ROW][C]13[/C][C]-0.114187[/C][C]-0.8771[/C][C]0.191999[/C][/ROW]
[ROW][C]14[/C][C]-0.109606[/C][C]-0.8419[/C][C]0.201621[/C][/ROW]
[ROW][C]15[/C][C]-0.048757[/C][C]-0.3745[/C][C]0.354683[/C][/ROW]
[ROW][C]16[/C][C]-0.08646[/C][C]-0.6641[/C][C]0.254603[/C][/ROW]
[ROW][C]17[/C][C]0.075542[/C][C]0.5802[/C][C]0.281978[/C][/ROW]
[ROW][C]18[/C][C]0.031312[/C][C]0.2405[/C][C]0.405383[/C][/ROW]
[ROW][C]19[/C][C]0.088444[/C][C]0.6793[/C][C]0.249787[/C][/ROW]
[ROW][C]20[/C][C]-0.131307[/C][C]-1.0086[/C][C]0.158646[/C][/ROW]
[ROW][C]21[/C][C]-0.016053[/C][C]-0.1233[/C][C]0.451142[/C][/ROW]
[ROW][C]22[/C][C]-0.034091[/C][C]-0.2619[/C][C]0.397172[/C][/ROW]
[ROW][C]23[/C][C]-0.110253[/C][C]-0.8469[/C][C]0.200245[/C][/ROW]
[ROW][C]24[/C][C]0.04598[/C][C]0.3532[/C][C]0.362606[/C][/ROW]
[ROW][C]25[/C][C]0.010385[/C][C]0.0798[/C][C]0.468344[/C][/ROW]
[ROW][C]26[/C][C]-0.031747[/C][C]-0.2439[/C][C]0.404096[/C][/ROW]
[ROW][C]27[/C][C]-0.064644[/C][C]-0.4965[/C][C]0.310679[/C][/ROW]
[ROW][C]28[/C][C]-0.025594[/C][C]-0.1966[/C][C]0.422412[/C][/ROW]
[ROW][C]29[/C][C]-0.115755[/C][C]-0.8891[/C][C]0.188772[/C][/ROW]
[ROW][C]30[/C][C]0.113761[/C][C]0.8738[/C][C]0.19288[/C][/ROW]
[ROW][C]31[/C][C]-0.02547[/C][C]-0.1956[/C][C]0.422782[/C][/ROW]
[ROW][C]32[/C][C]0.045909[/C][C]0.3526[/C][C]0.362809[/C][/ROW]
[ROW][C]33[/C][C]-0.052258[/C][C]-0.4014[/C][C]0.344789[/C][/ROW]
[ROW][C]34[/C][C]-0.180934[/C][C]-1.3898[/C][C]0.084909[/C][/ROW]
[ROW][C]35[/C][C]-0.037336[/C][C]-0.2868[/C][C]0.387643[/C][/ROW]
[ROW][C]36[/C][C]0.001633[/C][C]0.0125[/C][C]0.495019[/C][/ROW]
[ROW][C]37[/C][C]0.123214[/C][C]0.9464[/C][C]0.173895[/C][/ROW]
[ROW][C]38[/C][C]-0.118014[/C][C]-0.9065[/C][C]0.184183[/C][/ROW]
[ROW][C]39[/C][C]0.003777[/C][C]0.029[/C][C]0.488477[/C][/ROW]
[ROW][C]40[/C][C]0.083058[/C][C]0.638[/C][C]0.262977[/C][/ROW]
[ROW][C]41[/C][C]0.009929[/C][C]0.0763[/C][C]0.469732[/C][/ROW]
[ROW][C]42[/C][C]0.020465[/C][C]0.1572[/C][C]0.437814[/C][/ROW]
[ROW][C]43[/C][C]-0.085701[/C][C]-0.6583[/C][C]0.256458[/C][/ROW]
[ROW][C]44[/C][C]0.036938[/C][C]0.2837[/C][C]0.388807[/C][/ROW]
[ROW][C]45[/C][C]0.025821[/C][C]0.1983[/C][C]0.421732[/C][/ROW]
[ROW][C]46[/C][C]0.059526[/C][C]0.4572[/C][C]0.324593[/C][/ROW]
[ROW][C]47[/C][C]-0.027939[/C][C]-0.2146[/C][C]0.415408[/C][/ROW]
[ROW][C]48[/C][C]-0.07923[/C][C]-0.6086[/C][C]0.27257[/C][/ROW]
[/TABLE]
Source: https://freestatistics.org/blog/index.php?pk=235208&T=2

Globally Unique Identifier (entire table): ba.freestatistics.org/blog/index.php?pk=235208&T=2

As an alternative you can also use a QR Code:  

The GUIDs for individual cells are displayed in the table below:

Partial Autocorrelation Function
Time lag kPACF(k)T-STATP-value
10.0879180.67530.251058
20.3187812.44860.008666
30.0336840.25870.398371
4-0.548172-4.21064.4e-05
5-0.291285-2.23740.014525
6-0.40508-3.11150.001434
7-0.008542-0.06560.473954
8-0.356485-2.73820.004077
9-0.02953-0.22680.410674
100.1933641.48530.0714
11-0.053452-0.41060.341436
120.1807481.38840.085125
13-0.114187-0.87710.191999
14-0.109606-0.84190.201621
15-0.048757-0.37450.354683
16-0.08646-0.66410.254603
170.0755420.58020.281978
180.0313120.24050.405383
190.0884440.67930.249787
20-0.131307-1.00860.158646
21-0.016053-0.12330.451142
22-0.034091-0.26190.397172
23-0.110253-0.84690.200245
240.045980.35320.362606
250.0103850.07980.468344
26-0.031747-0.24390.404096
27-0.064644-0.49650.310679
28-0.025594-0.19660.422412
29-0.115755-0.88910.188772
300.1137610.87380.19288
31-0.02547-0.19560.422782
320.0459090.35260.362809
33-0.052258-0.40140.344789
34-0.180934-1.38980.084909
35-0.037336-0.28680.387643
360.0016330.01250.495019
370.1232140.94640.173895
38-0.118014-0.90650.184183
390.0037770.0290.488477
400.0830580.6380.262977
410.0099290.07630.469732
420.0204650.15720.437814
43-0.085701-0.65830.256458
440.0369380.28370.388807
450.0258210.19830.421732
460.0595260.45720.324593
47-0.027939-0.21460.415408
48-0.07923-0.60860.27257


Parameters (Session):
par1 = 48 ; par2 = 1 ; par3 = 1 ; par4 = 0 ; par5 = 12 ; par6 = White Noise ; par7 = 0.95 ;
Parameters (R input):
par1 = 48 ; par2 = 1 ; par3 = 1 ; par4 = 0 ; par5 = 12 ; par6 = White Noise ; par7 = 0.95 ; par8 = ;
R code (references can be found in the software module):
if (par1 == 'Default') {
par1 = 10*log10(length(x))
} else {
par1 <- as.numeric(par1)
}
par2 <- as.numeric(par2)
par3 <- as.numeric(par3)
par4 <- as.numeric(par4)
par5 <- as.numeric(par5)
if (par6 == 'White Noise') par6 <- 'white' else par6 <- 'ma'
par7 <- as.numeric(par7)
if (par8 != '') par8 <- as.numeric(par8)
ox <- x
if (par8 == '') {
if (par2 == 0) {
x <- log(x)
} else {
x <- (x ^ par2 - 1) / par2
}
} else {
x <- log(x,base=par8)
}
if (par3 > 0) x <- diff(x,lag=1,difference=par3)
if (par4 > 0) x <- diff(x,lag=par5,difference=par4)
bitmap(file='picts.png')
op <- par(mfrow=c(2,1))
plot(ox,type='l',main='Original Time Series',xlab='time',ylab='value')
if (par8=='') {
mytitle <- paste('Working Time Series (lambda=',par2,', d=',par3,', D=',par4,')',sep='')
mysub <- paste('(lambda=',par2,', d=',par3,', D=',par4,', CI=', par7, ', CI type=',par6,')',sep='')
} else {
mytitle <- paste('Working Time Series (base=',par8,', d=',par3,', D=',par4,')',sep='')
mysub <- paste('(base=',par8,', d=',par3,', D=',par4,', CI=', par7, ', CI type=',par6,')',sep='')
}
plot(x,type='l', main=mytitle,xlab='time',ylab='value')
par(op)
dev.off()
bitmap(file='pic1.png')
racf <- acf(x, par1, main='Autocorrelation', xlab='time lag', ylab='ACF', ci.type=par6, ci=par7, sub=mysub)
dev.off()
bitmap(file='pic2.png')
rpacf <- pacf(x,par1,main='Partial Autocorrelation',xlab='lags',ylab='PACF',sub=mysub)
dev.off()
(myacf <- c(racf$acf))
(mypacf <- c(rpacf$acf))
lengthx <- length(x)
sqrtn <- sqrt(lengthx)
load(file='createtable')
a<-table.start()
a<-table.row.start(a)
a<-table.element(a,'Autocorrelation Function',4,TRUE)
a<-table.row.end(a)
a<-table.row.start(a)
a<-table.element(a,'Time lag k',header=TRUE)
a<-table.element(a,hyperlink('basics.htm','ACF(k)','click here for more information about the Autocorrelation Function'),header=TRUE)
a<-table.element(a,'T-STAT',header=TRUE)
a<-table.element(a,'P-value',header=TRUE)
a<-table.row.end(a)
for (i in 2:(par1+1)) {
a<-table.row.start(a)
a<-table.element(a,i-1,header=TRUE)
a<-table.element(a,round(myacf[i],6))
mytstat <- myacf[i]*sqrtn
a<-table.element(a,round(mytstat,4))
a<-table.element(a,round(1-pt(abs(mytstat),lengthx),6))
a<-table.row.end(a)
}
a<-table.end(a)
table.save(a,file='mytable.tab')
a<-table.start()
a<-table.row.start(a)
a<-table.element(a,'Partial Autocorrelation Function',4,TRUE)
a<-table.row.end(a)
a<-table.row.start(a)
a<-table.element(a,'Time lag k',header=TRUE)
a<-table.element(a,hyperlink('basics.htm','PACF(k)','click here for more information about the Partial Autocorrelation Function'),header=TRUE)
a<-table.element(a,'T-STAT',header=TRUE)
a<-table.element(a,'P-value',header=TRUE)
a<-table.row.end(a)
for (i in 1:par1) {
a<-table.row.start(a)
a<-table.element(a,i,header=TRUE)
a<-table.element(a,round(mypacf[i],6))
mytstat <- mypacf[i]*sqrtn
a<-table.element(a,round(mytstat,4))
a<-table.element(a,round(1-pt(abs(mytstat),lengthx),6))
a<-table.row.end(a)
}
a<-table.end(a)
table.save(a,file='mytable1.tab')