Free Statistics

of Irreproducible Research!

Author's title

Author*The author of this computation has been verified*
R Software Modulerwasp_multipleregression.wasp
Title produced by softwareMultiple Regression
Date of computationThu, 13 Nov 2014 16:29:34 +0000
Cite this page as followsStatistical Computations at FreeStatistics.org, Office for Research Development and Education, URL https://freestatistics.org/blog/index.php?v=date/2014/Nov/13/t14158962018d3qjlvv5y1ixq3.htm/, Retrieved Wed, 15 May 2024 19:26:04 +0000
Statistical Computations at FreeStatistics.org, Office for Research Development and Education, URL https://freestatistics.org/blog/index.php?pk=254468, Retrieved Wed, 15 May 2024 19:26:04 +0000
QR Codes:

Original text written by user:
IsPrivate?No (this computation is public)
User-defined keywords
Estimated Impact61
Family? (F = Feedback message, R = changed R code, M = changed R Module, P = changed Parameters, D = changed Data)
-     [Multiple Regression] [] [2013-11-04 07:18:26] [0307e7a6407eb638caabc417e3a6b260]
- RMPD    [Multiple Regression] [] [2014-11-13 16:29:34] [4bf1efda48b6e8e35beb7b429a900cbb] [Current]
Feedback Forum

Post a new message
Dataseries X:
56.676	1,12	39
34.870	1,22	57
35.117	1,23	52
30.169	1,28	56
30.936	1,29	77
35.699	1,4	64
33.228	1,38	60
27.733	1,39	63
33.666	1,4	72
35.429	1,33	68
27.438	1,39	60
8.170	1,39	52
63.410	1,41	42
38.040	1,41	31
45.389	1,47	40
37.353	1,51	57
37.024	1,51	56
50.957	1,47	73
37.994	1,51	55
36.454	1,48	62
46.080	1,46	59
43.373	1,47	75
37.395	1,47	51
10.963	1,52	39
76.058	1,57	42
50.179	1,57	35
57.452	1,62	41
47.568	1,66	64
50.050	1,68	55
50.856	1,68	59
41.992	1,61	51
39.284	1,68	54
44.521	1,65	72
43.832	1,63	54
41.153	1,61	53
17.100	1,61	81
70.487	1,64	49
43.982	1,69	44
52.169	1,73	55
40.661	1,81	69
47.725	1,76	57
76.489	1,76	54
30.251	1,68	47
33.041	1,74	65
31.570	1,82	48
27.000	1,78	54
30.129	1,69	48
18.394	1,7	60
48.081	1,67	27
32.295	1,72	30
35.890	1,77	52
30.538	1,78	37
30.089	1,71	54
35.285	1,71	52
30.666	1,68	44
28.623	1,73	60
31.504	1,76	49
36.784	1,66	71
40.659	1,63	44
39.163	1,67	50
41.258	1,65	61


Summary of computational transaction
Raw Inputview raw input (R code)
Raw Outputview raw output of R engine
Computing time5 seconds
R Server'Gwilym Jenkins' @ jenkins.wessa.net

\begin{tabular}{lllllllll}
\hline
Summary of computational transaction \tabularnewline
Raw Input & view raw input (R code)  \tabularnewline
Raw Output & view raw output of R engine  \tabularnewline
Computing time & 5 seconds \tabularnewline
R Server & 'Gwilym Jenkins' @ jenkins.wessa.net \tabularnewline
\hline
\end{tabular}
%Source: https://freestatistics.org/blog/index.php?pk=254468&T=0

[TABLE]
[ROW][C]Summary of computational transaction[/C][/ROW]
[ROW][C]Raw Input[/C][C]view raw input (R code) [/C][/ROW]
[ROW][C]Raw Output[/C][C]view raw output of R engine [/C][/ROW]
[ROW][C]Computing time[/C][C]5 seconds[/C][/ROW]
[ROW][C]R Server[/C][C]'Gwilym Jenkins' @ jenkins.wessa.net[/C][/ROW]
[/TABLE]
Source: https://freestatistics.org/blog/index.php?pk=254468&T=0

Globally Unique Identifier (entire table): ba.freestatistics.org/blog/index.php?pk=254468&T=0

As an alternative you can also use a QR Code:  

The GUIDs for individual cells are displayed in the table below:

Summary of computational transaction
Raw Inputview raw input (R code)
Raw Outputview raw output of R engine
Computing time5 seconds
R Server'Gwilym Jenkins' @ jenkins.wessa.net


Multiple Linear Regression - Estimated Regression Equation
Aantal_verkopen[t] = + 45.5208 + 3.05574Brandstofprijs[t] -0.20407Aantal_verkeersdoden[t] + e[t]

\begin{tabular}{lllllllll}
\hline
Multiple Linear Regression - Estimated Regression Equation \tabularnewline
Aantal_verkopen[t] =  +  45.5208 +  3.05574Brandstofprijs[t] -0.20407Aantal_verkeersdoden[t]  + e[t] \tabularnewline
\hline
\end{tabular}
%Source: https://freestatistics.org/blog/index.php?pk=254468&T=1

[TABLE]
[ROW][C]Multiple Linear Regression - Estimated Regression Equation[/C][/ROW]
[ROW][C]Aantal_verkopen[t] =  +  45.5208 +  3.05574Brandstofprijs[t] -0.20407Aantal_verkeersdoden[t]  + e[t][/C][/ROW]
[/TABLE]
Source: https://freestatistics.org/blog/index.php?pk=254468&T=1

Globally Unique Identifier (entire table): ba.freestatistics.org/blog/index.php?pk=254468&T=1

As an alternative you can also use a QR Code:  

The GUIDs for individual cells are displayed in the table below:

Multiple Linear Regression - Estimated Regression Equation
Aantal_verkopen[t] = + 45.5208 + 3.05574Brandstofprijs[t] -0.20407Aantal_verkeersdoden[t] + e[t]


Multiple Linear Regression - Ordinary Least Squares
VariableParameterS.D.T-STATH0: parameter = 02-tail p-value1-tail p-value
(Intercept)45.520818.80392.4210.01863630.00931814
Brandstofprijs3.0557410.21150.29920.7658220.382911
Aantal_verkeersdoden-0.204070.144145-1.4160.1622020.0811012

\begin{tabular}{lllllllll}
\hline
Multiple Linear Regression - Ordinary Least Squares \tabularnewline
Variable & Parameter & S.D. & T-STATH0: parameter = 0 & 2-tail p-value & 1-tail p-value \tabularnewline
(Intercept) & 45.5208 & 18.8039 & 2.421 & 0.0186363 & 0.00931814 \tabularnewline
Brandstofprijs & 3.05574 & 10.2115 & 0.2992 & 0.765822 & 0.382911 \tabularnewline
Aantal_verkeersdoden & -0.20407 & 0.144145 & -1.416 & 0.162202 & 0.0811012 \tabularnewline
\hline
\end{tabular}
%Source: https://freestatistics.org/blog/index.php?pk=254468&T=2

[TABLE]
[ROW][C]Multiple Linear Regression - Ordinary Least Squares[/C][/ROW]
[ROW][C]Variable[/C][C]Parameter[/C][C]S.D.[/C][C]T-STATH0: parameter = 0[/C][C]2-tail p-value[/C][C]1-tail p-value[/C][/ROW]
[ROW][C](Intercept)[/C][C]45.5208[/C][C]18.8039[/C][C]2.421[/C][C]0.0186363[/C][C]0.00931814[/C][/ROW]
[ROW][C]Brandstofprijs[/C][C]3.05574[/C][C]10.2115[/C][C]0.2992[/C][C]0.765822[/C][C]0.382911[/C][/ROW]
[ROW][C]Aantal_verkeersdoden[/C][C]-0.20407[/C][C]0.144145[/C][C]-1.416[/C][C]0.162202[/C][C]0.0811012[/C][/ROW]
[/TABLE]
Source: https://freestatistics.org/blog/index.php?pk=254468&T=2

Globally Unique Identifier (entire table): ba.freestatistics.org/blog/index.php?pk=254468&T=2

As an alternative you can also use a QR Code:  

The GUIDs for individual cells are displayed in the table below:

Multiple Linear Regression - Ordinary Least Squares
VariableParameterS.D.T-STATH0: parameter = 02-tail p-value1-tail p-value
(Intercept)45.520818.80392.4210.01863630.00931814
Brandstofprijs3.0557410.21150.29920.7658220.382911
Aantal_verkeersdoden-0.204070.144145-1.4160.1622020.0811012


Multiple Linear Regression - Regression Statistics
Multiple R0.19266
R-squared0.037118
Adjusted R-squared0.00391516
F-TEST (value)1.11792
F-TEST (DF numerator)2
F-TEST (DF denominator)58
p-value0.333902
Multiple Linear Regression - Residual Statistics
Residual Standard Deviation13.0066
Sum Squared Residuals9812.01

\begin{tabular}{lllllllll}
\hline
Multiple Linear Regression - Regression Statistics \tabularnewline
Multiple R & 0.19266 \tabularnewline
R-squared & 0.037118 \tabularnewline
Adjusted R-squared & 0.00391516 \tabularnewline
F-TEST (value) & 1.11792 \tabularnewline
F-TEST (DF numerator) & 2 \tabularnewline
F-TEST (DF denominator) & 58 \tabularnewline
p-value & 0.333902 \tabularnewline
Multiple Linear Regression - Residual Statistics \tabularnewline
Residual Standard Deviation & 13.0066 \tabularnewline
Sum Squared Residuals & 9812.01 \tabularnewline
\hline
\end{tabular}
%Source: https://freestatistics.org/blog/index.php?pk=254468&T=3

[TABLE]
[ROW][C]Multiple Linear Regression - Regression Statistics[/C][/ROW]
[ROW][C]Multiple R[/C][C]0.19266[/C][/ROW]
[ROW][C]R-squared[/C][C]0.037118[/C][/ROW]
[ROW][C]Adjusted R-squared[/C][C]0.00391516[/C][/ROW]
[ROW][C]F-TEST (value)[/C][C]1.11792[/C][/ROW]
[ROW][C]F-TEST (DF numerator)[/C][C]2[/C][/ROW]
[ROW][C]F-TEST (DF denominator)[/C][C]58[/C][/ROW]
[ROW][C]p-value[/C][C]0.333902[/C][/ROW]
[ROW][C]Multiple Linear Regression - Residual Statistics[/C][/ROW]
[ROW][C]Residual Standard Deviation[/C][C]13.0066[/C][/ROW]
[ROW][C]Sum Squared Residuals[/C][C]9812.01[/C][/ROW]
[/TABLE]
Source: https://freestatistics.org/blog/index.php?pk=254468&T=3

Globally Unique Identifier (entire table): ba.freestatistics.org/blog/index.php?pk=254468&T=3

As an alternative you can also use a QR Code:  

The GUIDs for individual cells are displayed in the table below:

Multiple Linear Regression - Regression Statistics
Multiple R0.19266
R-squared0.037118
Adjusted R-squared0.00391516
F-TEST (value)1.11792
F-TEST (DF numerator)2
F-TEST (DF denominator)58
p-value0.333902
Multiple Linear Regression - Residual Statistics
Residual Standard Deviation13.0066
Sum Squared Residuals9812.01


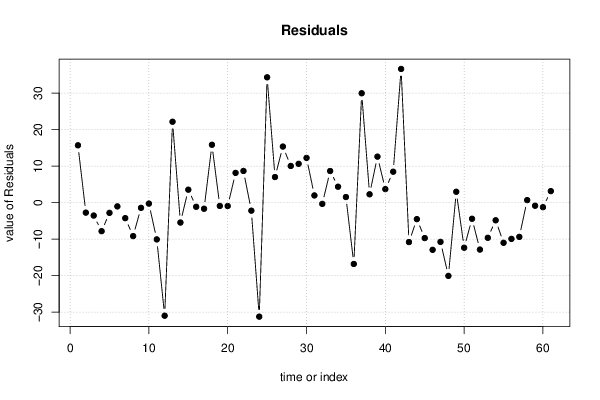
Multiple Linear Regression - Actuals, Interpolation, and Residuals
Time or IndexActualsInterpolationForecastResidualsPrediction Error
156.67640.984515.6915
234.8737.6168-2.7468
335.11738.6677-3.55071
430.16938.0042-7.83521
530.93633.7493-2.81329
635.69936.7383-1.03934
733.22837.4935-4.26551
827.73336.9119-9.17885
933.66635.1058-1.43978
1035.42935.7082-0.279155
1127.43837.5241-10.0861
128.1739.1566-30.9866
1363.4141.258422.1516
1438.0443.5032-5.46322
1545.38941.84993.53907
1637.35338.503-1.14996
1737.02438.707-1.68303
1850.95735.115615.8414
1937.99438.9111-0.917104
2036.45437.3909-0.936939
2146.0837.9428.13797
2243.37334.70758.66553
2337.39539.6052-2.21016
2410.96342.2068-31.2438
2576.05841.747434.3106
2650.17943.17597.00315
2757.45242.104215.3478
2847.56837.532810.0352
2950.0539.430610.6194
3050.85638.614312.2417
3141.99240.0331.95904
3239.28439.6347-0.35065
3344.52135.86978.65129
3443.83239.48194.35014
3541.15339.62481.52818
3617.133.9108-16.8108
3770.48740.532829.9542
3843.98241.70592.27609
3952.16939.583412.5856
4040.66136.97083.69016
4147.72539.26698.4581
4276.48939.879136.6099
4330.25141.0631-10.8121
4433.04137.5732-4.53222
4531.5741.2869-9.71688
462739.9402-12.9402
4730.12940.8896-10.7606
4818.39438.4713-20.0773
4948.08145.1142.96701
5032.29544.6546-12.3596
5135.8940.3178-4.42781
5230.53843.4094-12.8714
5330.08939.7263-9.63732
5435.28540.1345-4.84946
5530.66641.6754-11.0094
5628.62338.563-9.94002
5731.50440.8995-9.39546
5836.78436.10430.67966
5940.65941.5226-0.863566
6039.16340.4204-1.25737
6141.25838.11453.14351

\begin{tabular}{lllllllll}
\hline
Multiple Linear Regression - Actuals, Interpolation, and Residuals \tabularnewline
Time or Index & Actuals & InterpolationForecast & ResidualsPrediction Error \tabularnewline
1 & 56.676 & 40.9845 & 15.6915 \tabularnewline
2 & 34.87 & 37.6168 & -2.7468 \tabularnewline
3 & 35.117 & 38.6677 & -3.55071 \tabularnewline
4 & 30.169 & 38.0042 & -7.83521 \tabularnewline
5 & 30.936 & 33.7493 & -2.81329 \tabularnewline
6 & 35.699 & 36.7383 & -1.03934 \tabularnewline
7 & 33.228 & 37.4935 & -4.26551 \tabularnewline
8 & 27.733 & 36.9119 & -9.17885 \tabularnewline
9 & 33.666 & 35.1058 & -1.43978 \tabularnewline
10 & 35.429 & 35.7082 & -0.279155 \tabularnewline
11 & 27.438 & 37.5241 & -10.0861 \tabularnewline
12 & 8.17 & 39.1566 & -30.9866 \tabularnewline
13 & 63.41 & 41.2584 & 22.1516 \tabularnewline
14 & 38.04 & 43.5032 & -5.46322 \tabularnewline
15 & 45.389 & 41.8499 & 3.53907 \tabularnewline
16 & 37.353 & 38.503 & -1.14996 \tabularnewline
17 & 37.024 & 38.707 & -1.68303 \tabularnewline
18 & 50.957 & 35.1156 & 15.8414 \tabularnewline
19 & 37.994 & 38.9111 & -0.917104 \tabularnewline
20 & 36.454 & 37.3909 & -0.936939 \tabularnewline
21 & 46.08 & 37.942 & 8.13797 \tabularnewline
22 & 43.373 & 34.7075 & 8.66553 \tabularnewline
23 & 37.395 & 39.6052 & -2.21016 \tabularnewline
24 & 10.963 & 42.2068 & -31.2438 \tabularnewline
25 & 76.058 & 41.7474 & 34.3106 \tabularnewline
26 & 50.179 & 43.1759 & 7.00315 \tabularnewline
27 & 57.452 & 42.1042 & 15.3478 \tabularnewline
28 & 47.568 & 37.5328 & 10.0352 \tabularnewline
29 & 50.05 & 39.4306 & 10.6194 \tabularnewline
30 & 50.856 & 38.6143 & 12.2417 \tabularnewline
31 & 41.992 & 40.033 & 1.95904 \tabularnewline
32 & 39.284 & 39.6347 & -0.35065 \tabularnewline
33 & 44.521 & 35.8697 & 8.65129 \tabularnewline
34 & 43.832 & 39.4819 & 4.35014 \tabularnewline
35 & 41.153 & 39.6248 & 1.52818 \tabularnewline
36 & 17.1 & 33.9108 & -16.8108 \tabularnewline
37 & 70.487 & 40.5328 & 29.9542 \tabularnewline
38 & 43.982 & 41.7059 & 2.27609 \tabularnewline
39 & 52.169 & 39.5834 & 12.5856 \tabularnewline
40 & 40.661 & 36.9708 & 3.69016 \tabularnewline
41 & 47.725 & 39.2669 & 8.4581 \tabularnewline
42 & 76.489 & 39.8791 & 36.6099 \tabularnewline
43 & 30.251 & 41.0631 & -10.8121 \tabularnewline
44 & 33.041 & 37.5732 & -4.53222 \tabularnewline
45 & 31.57 & 41.2869 & -9.71688 \tabularnewline
46 & 27 & 39.9402 & -12.9402 \tabularnewline
47 & 30.129 & 40.8896 & -10.7606 \tabularnewline
48 & 18.394 & 38.4713 & -20.0773 \tabularnewline
49 & 48.081 & 45.114 & 2.96701 \tabularnewline
50 & 32.295 & 44.6546 & -12.3596 \tabularnewline
51 & 35.89 & 40.3178 & -4.42781 \tabularnewline
52 & 30.538 & 43.4094 & -12.8714 \tabularnewline
53 & 30.089 & 39.7263 & -9.63732 \tabularnewline
54 & 35.285 & 40.1345 & -4.84946 \tabularnewline
55 & 30.666 & 41.6754 & -11.0094 \tabularnewline
56 & 28.623 & 38.563 & -9.94002 \tabularnewline
57 & 31.504 & 40.8995 & -9.39546 \tabularnewline
58 & 36.784 & 36.1043 & 0.67966 \tabularnewline
59 & 40.659 & 41.5226 & -0.863566 \tabularnewline
60 & 39.163 & 40.4204 & -1.25737 \tabularnewline
61 & 41.258 & 38.1145 & 3.14351 \tabularnewline
\hline
\end{tabular}
%Source: https://freestatistics.org/blog/index.php?pk=254468&T=4

[TABLE]
[ROW][C]Multiple Linear Regression - Actuals, Interpolation, and Residuals[/C][/ROW]
[ROW][C]Time or Index[/C][C]Actuals[/C][C]InterpolationForecast[/C][C]ResidualsPrediction Error[/C][/ROW]
[ROW][C]1[/C][C]56.676[/C][C]40.9845[/C][C]15.6915[/C][/ROW]
[ROW][C]2[/C][C]34.87[/C][C]37.6168[/C][C]-2.7468[/C][/ROW]
[ROW][C]3[/C][C]35.117[/C][C]38.6677[/C][C]-3.55071[/C][/ROW]
[ROW][C]4[/C][C]30.169[/C][C]38.0042[/C][C]-7.83521[/C][/ROW]
[ROW][C]5[/C][C]30.936[/C][C]33.7493[/C][C]-2.81329[/C][/ROW]
[ROW][C]6[/C][C]35.699[/C][C]36.7383[/C][C]-1.03934[/C][/ROW]
[ROW][C]7[/C][C]33.228[/C][C]37.4935[/C][C]-4.26551[/C][/ROW]
[ROW][C]8[/C][C]27.733[/C][C]36.9119[/C][C]-9.17885[/C][/ROW]
[ROW][C]9[/C][C]33.666[/C][C]35.1058[/C][C]-1.43978[/C][/ROW]
[ROW][C]10[/C][C]35.429[/C][C]35.7082[/C][C]-0.279155[/C][/ROW]
[ROW][C]11[/C][C]27.438[/C][C]37.5241[/C][C]-10.0861[/C][/ROW]
[ROW][C]12[/C][C]8.17[/C][C]39.1566[/C][C]-30.9866[/C][/ROW]
[ROW][C]13[/C][C]63.41[/C][C]41.2584[/C][C]22.1516[/C][/ROW]
[ROW][C]14[/C][C]38.04[/C][C]43.5032[/C][C]-5.46322[/C][/ROW]
[ROW][C]15[/C][C]45.389[/C][C]41.8499[/C][C]3.53907[/C][/ROW]
[ROW][C]16[/C][C]37.353[/C][C]38.503[/C][C]-1.14996[/C][/ROW]
[ROW][C]17[/C][C]37.024[/C][C]38.707[/C][C]-1.68303[/C][/ROW]
[ROW][C]18[/C][C]50.957[/C][C]35.1156[/C][C]15.8414[/C][/ROW]
[ROW][C]19[/C][C]37.994[/C][C]38.9111[/C][C]-0.917104[/C][/ROW]
[ROW][C]20[/C][C]36.454[/C][C]37.3909[/C][C]-0.936939[/C][/ROW]
[ROW][C]21[/C][C]46.08[/C][C]37.942[/C][C]8.13797[/C][/ROW]
[ROW][C]22[/C][C]43.373[/C][C]34.7075[/C][C]8.66553[/C][/ROW]
[ROW][C]23[/C][C]37.395[/C][C]39.6052[/C][C]-2.21016[/C][/ROW]
[ROW][C]24[/C][C]10.963[/C][C]42.2068[/C][C]-31.2438[/C][/ROW]
[ROW][C]25[/C][C]76.058[/C][C]41.7474[/C][C]34.3106[/C][/ROW]
[ROW][C]26[/C][C]50.179[/C][C]43.1759[/C][C]7.00315[/C][/ROW]
[ROW][C]27[/C][C]57.452[/C][C]42.1042[/C][C]15.3478[/C][/ROW]
[ROW][C]28[/C][C]47.568[/C][C]37.5328[/C][C]10.0352[/C][/ROW]
[ROW][C]29[/C][C]50.05[/C][C]39.4306[/C][C]10.6194[/C][/ROW]
[ROW][C]30[/C][C]50.856[/C][C]38.6143[/C][C]12.2417[/C][/ROW]
[ROW][C]31[/C][C]41.992[/C][C]40.033[/C][C]1.95904[/C][/ROW]
[ROW][C]32[/C][C]39.284[/C][C]39.6347[/C][C]-0.35065[/C][/ROW]
[ROW][C]33[/C][C]44.521[/C][C]35.8697[/C][C]8.65129[/C][/ROW]
[ROW][C]34[/C][C]43.832[/C][C]39.4819[/C][C]4.35014[/C][/ROW]
[ROW][C]35[/C][C]41.153[/C][C]39.6248[/C][C]1.52818[/C][/ROW]
[ROW][C]36[/C][C]17.1[/C][C]33.9108[/C][C]-16.8108[/C][/ROW]
[ROW][C]37[/C][C]70.487[/C][C]40.5328[/C][C]29.9542[/C][/ROW]
[ROW][C]38[/C][C]43.982[/C][C]41.7059[/C][C]2.27609[/C][/ROW]
[ROW][C]39[/C][C]52.169[/C][C]39.5834[/C][C]12.5856[/C][/ROW]
[ROW][C]40[/C][C]40.661[/C][C]36.9708[/C][C]3.69016[/C][/ROW]
[ROW][C]41[/C][C]47.725[/C][C]39.2669[/C][C]8.4581[/C][/ROW]
[ROW][C]42[/C][C]76.489[/C][C]39.8791[/C][C]36.6099[/C][/ROW]
[ROW][C]43[/C][C]30.251[/C][C]41.0631[/C][C]-10.8121[/C][/ROW]
[ROW][C]44[/C][C]33.041[/C][C]37.5732[/C][C]-4.53222[/C][/ROW]
[ROW][C]45[/C][C]31.57[/C][C]41.2869[/C][C]-9.71688[/C][/ROW]
[ROW][C]46[/C][C]27[/C][C]39.9402[/C][C]-12.9402[/C][/ROW]
[ROW][C]47[/C][C]30.129[/C][C]40.8896[/C][C]-10.7606[/C][/ROW]
[ROW][C]48[/C][C]18.394[/C][C]38.4713[/C][C]-20.0773[/C][/ROW]
[ROW][C]49[/C][C]48.081[/C][C]45.114[/C][C]2.96701[/C][/ROW]
[ROW][C]50[/C][C]32.295[/C][C]44.6546[/C][C]-12.3596[/C][/ROW]
[ROW][C]51[/C][C]35.89[/C][C]40.3178[/C][C]-4.42781[/C][/ROW]
[ROW][C]52[/C][C]30.538[/C][C]43.4094[/C][C]-12.8714[/C][/ROW]
[ROW][C]53[/C][C]30.089[/C][C]39.7263[/C][C]-9.63732[/C][/ROW]
[ROW][C]54[/C][C]35.285[/C][C]40.1345[/C][C]-4.84946[/C][/ROW]
[ROW][C]55[/C][C]30.666[/C][C]41.6754[/C][C]-11.0094[/C][/ROW]
[ROW][C]56[/C][C]28.623[/C][C]38.563[/C][C]-9.94002[/C][/ROW]
[ROW][C]57[/C][C]31.504[/C][C]40.8995[/C][C]-9.39546[/C][/ROW]
[ROW][C]58[/C][C]36.784[/C][C]36.1043[/C][C]0.67966[/C][/ROW]
[ROW][C]59[/C][C]40.659[/C][C]41.5226[/C][C]-0.863566[/C][/ROW]
[ROW][C]60[/C][C]39.163[/C][C]40.4204[/C][C]-1.25737[/C][/ROW]
[ROW][C]61[/C][C]41.258[/C][C]38.1145[/C][C]3.14351[/C][/ROW]
[/TABLE]
Source: https://freestatistics.org/blog/index.php?pk=254468&T=4

Globally Unique Identifier (entire table): ba.freestatistics.org/blog/index.php?pk=254468&T=4

As an alternative you can also use a QR Code:  

The GUIDs for individual cells are displayed in the table below:

Multiple Linear Regression - Actuals, Interpolation, and Residuals
Time or IndexActualsInterpolationForecastResidualsPrediction Error
156.67640.984515.6915
234.8737.6168-2.7468
335.11738.6677-3.55071
430.16938.0042-7.83521
530.93633.7493-2.81329
635.69936.7383-1.03934
733.22837.4935-4.26551
827.73336.9119-9.17885
933.66635.1058-1.43978
1035.42935.7082-0.279155
1127.43837.5241-10.0861
128.1739.1566-30.9866
1363.4141.258422.1516
1438.0443.5032-5.46322
1545.38941.84993.53907
1637.35338.503-1.14996
1737.02438.707-1.68303
1850.95735.115615.8414
1937.99438.9111-0.917104
2036.45437.3909-0.936939
2146.0837.9428.13797
2243.37334.70758.66553
2337.39539.6052-2.21016
2410.96342.2068-31.2438
2576.05841.747434.3106
2650.17943.17597.00315
2757.45242.104215.3478
2847.56837.532810.0352
2950.0539.430610.6194
3050.85638.614312.2417
3141.99240.0331.95904
3239.28439.6347-0.35065
3344.52135.86978.65129
3443.83239.48194.35014
3541.15339.62481.52818
3617.133.9108-16.8108
3770.48740.532829.9542
3843.98241.70592.27609
3952.16939.583412.5856
4040.66136.97083.69016
4147.72539.26698.4581
4276.48939.879136.6099
4330.25141.0631-10.8121
4433.04137.5732-4.53222
4531.5741.2869-9.71688
462739.9402-12.9402
4730.12940.8896-10.7606
4818.39438.4713-20.0773
4948.08145.1142.96701
5032.29544.6546-12.3596
5135.8940.3178-4.42781
5230.53843.4094-12.8714
5330.08939.7263-9.63732
5435.28540.1345-4.84946
5530.66641.6754-11.0094
5628.62338.563-9.94002
5731.50440.8995-9.39546
5836.78436.10430.67966
5940.65941.5226-0.863566
6039.16340.4204-1.25737
6141.25838.11453.14351


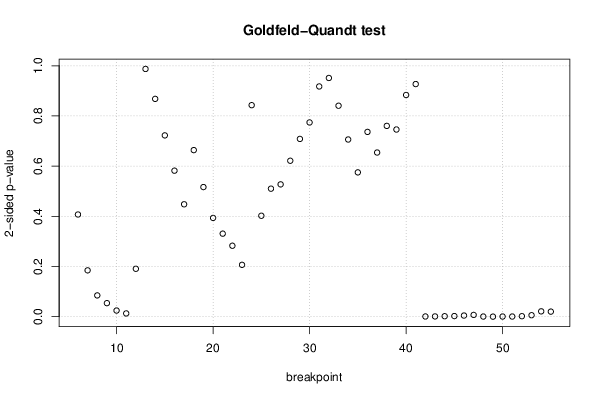
Goldfeld-Quandt test for Heteroskedasticity
p-valuesAlternative Hypothesis
breakpoint indexgreater2-sidedless
60.2036610.4073210.796339
70.09236450.1847290.907635
80.0424430.0848860.957557
90.02701530.05403060.972985
100.01229190.02458380.987708
110.006519820.01303960.99348
120.09549420.1909880.904506
130.5062680.9874630.493732
140.4341060.8682130.565894
150.3613140.7226280.638686
160.290990.5819790.70901
170.2240380.4480750.775962
180.3319840.6639690.668016
190.2583370.5166730.741663
200.1968180.3936360.803182
210.1654890.3309790.834511
220.1414130.2828250.858587
230.1033430.2066860.896657
240.4215270.8430550.578473
250.7988460.4023070.201154
260.7448740.5102530.255126
270.7362640.5274730.263736
280.6891860.6216280.310814
290.645740.7085210.35426
300.6128490.7743030.387151
310.5411710.9176580.458829
320.4757220.9514440.524278
330.4204240.8408480.579576
340.3531240.7062480.646876
350.2876240.5752480.712376
360.3682940.7365880.631706
370.6728190.6543610.327181
380.6197520.7604950.380248
390.6269630.7460750.373037
400.5581870.8836260.441813
410.5363870.9272250.463613
420.9995410.0009175450.000458773
430.999460.001079110.000539553
440.9990450.001909220.000954609
450.9987640.002471370.00123568
460.9976780.004644010.002322
470.9964140.007172240.00358612
480.9997060.0005877760.000293888
490.9999020.0001962439.81217e-05
500.9996690.0006622580.000331129
510.9996510.0006976810.00034884
520.9989920.002015930.00100796
530.9970630.005873680.00293684
540.9893120.02137540.0106877
550.9898920.02021530.0101077

\begin{tabular}{lllllllll}
\hline
Goldfeld-Quandt test for Heteroskedasticity \tabularnewline
p-values & Alternative Hypothesis \tabularnewline
breakpoint index & greater & 2-sided & less \tabularnewline
6 & 0.203661 & 0.407321 & 0.796339 \tabularnewline
7 & 0.0923645 & 0.184729 & 0.907635 \tabularnewline
8 & 0.042443 & 0.084886 & 0.957557 \tabularnewline
9 & 0.0270153 & 0.0540306 & 0.972985 \tabularnewline
10 & 0.0122919 & 0.0245838 & 0.987708 \tabularnewline
11 & 0.00651982 & 0.0130396 & 0.99348 \tabularnewline
12 & 0.0954942 & 0.190988 & 0.904506 \tabularnewline
13 & 0.506268 & 0.987463 & 0.493732 \tabularnewline
14 & 0.434106 & 0.868213 & 0.565894 \tabularnewline
15 & 0.361314 & 0.722628 & 0.638686 \tabularnewline
16 & 0.29099 & 0.581979 & 0.70901 \tabularnewline
17 & 0.224038 & 0.448075 & 0.775962 \tabularnewline
18 & 0.331984 & 0.663969 & 0.668016 \tabularnewline
19 & 0.258337 & 0.516673 & 0.741663 \tabularnewline
20 & 0.196818 & 0.393636 & 0.803182 \tabularnewline
21 & 0.165489 & 0.330979 & 0.834511 \tabularnewline
22 & 0.141413 & 0.282825 & 0.858587 \tabularnewline
23 & 0.103343 & 0.206686 & 0.896657 \tabularnewline
24 & 0.421527 & 0.843055 & 0.578473 \tabularnewline
25 & 0.798846 & 0.402307 & 0.201154 \tabularnewline
26 & 0.744874 & 0.510253 & 0.255126 \tabularnewline
27 & 0.736264 & 0.527473 & 0.263736 \tabularnewline
28 & 0.689186 & 0.621628 & 0.310814 \tabularnewline
29 & 0.64574 & 0.708521 & 0.35426 \tabularnewline
30 & 0.612849 & 0.774303 & 0.387151 \tabularnewline
31 & 0.541171 & 0.917658 & 0.458829 \tabularnewline
32 & 0.475722 & 0.951444 & 0.524278 \tabularnewline
33 & 0.420424 & 0.840848 & 0.579576 \tabularnewline
34 & 0.353124 & 0.706248 & 0.646876 \tabularnewline
35 & 0.287624 & 0.575248 & 0.712376 \tabularnewline
36 & 0.368294 & 0.736588 & 0.631706 \tabularnewline
37 & 0.672819 & 0.654361 & 0.327181 \tabularnewline
38 & 0.619752 & 0.760495 & 0.380248 \tabularnewline
39 & 0.626963 & 0.746075 & 0.373037 \tabularnewline
40 & 0.558187 & 0.883626 & 0.441813 \tabularnewline
41 & 0.536387 & 0.927225 & 0.463613 \tabularnewline
42 & 0.999541 & 0.000917545 & 0.000458773 \tabularnewline
43 & 0.99946 & 0.00107911 & 0.000539553 \tabularnewline
44 & 0.999045 & 0.00190922 & 0.000954609 \tabularnewline
45 & 0.998764 & 0.00247137 & 0.00123568 \tabularnewline
46 & 0.997678 & 0.00464401 & 0.002322 \tabularnewline
47 & 0.996414 & 0.00717224 & 0.00358612 \tabularnewline
48 & 0.999706 & 0.000587776 & 0.000293888 \tabularnewline
49 & 0.999902 & 0.000196243 & 9.81217e-05 \tabularnewline
50 & 0.999669 & 0.000662258 & 0.000331129 \tabularnewline
51 & 0.999651 & 0.000697681 & 0.00034884 \tabularnewline
52 & 0.998992 & 0.00201593 & 0.00100796 \tabularnewline
53 & 0.997063 & 0.00587368 & 0.00293684 \tabularnewline
54 & 0.989312 & 0.0213754 & 0.0106877 \tabularnewline
55 & 0.989892 & 0.0202153 & 0.0101077 \tabularnewline
\hline
\end{tabular}
%Source: https://freestatistics.org/blog/index.php?pk=254468&T=5

[TABLE]
[ROW][C]Goldfeld-Quandt test for Heteroskedasticity[/C][/ROW]
[ROW][C]p-values[/C][C]Alternative Hypothesis[/C][/ROW]
[ROW][C]breakpoint index[/C][C]greater[/C][C]2-sided[/C][C]less[/C][/ROW]
[ROW][C]6[/C][C]0.203661[/C][C]0.407321[/C][C]0.796339[/C][/ROW]
[ROW][C]7[/C][C]0.0923645[/C][C]0.184729[/C][C]0.907635[/C][/ROW]
[ROW][C]8[/C][C]0.042443[/C][C]0.084886[/C][C]0.957557[/C][/ROW]
[ROW][C]9[/C][C]0.0270153[/C][C]0.0540306[/C][C]0.972985[/C][/ROW]
[ROW][C]10[/C][C]0.0122919[/C][C]0.0245838[/C][C]0.987708[/C][/ROW]
[ROW][C]11[/C][C]0.00651982[/C][C]0.0130396[/C][C]0.99348[/C][/ROW]
[ROW][C]12[/C][C]0.0954942[/C][C]0.190988[/C][C]0.904506[/C][/ROW]
[ROW][C]13[/C][C]0.506268[/C][C]0.987463[/C][C]0.493732[/C][/ROW]
[ROW][C]14[/C][C]0.434106[/C][C]0.868213[/C][C]0.565894[/C][/ROW]
[ROW][C]15[/C][C]0.361314[/C][C]0.722628[/C][C]0.638686[/C][/ROW]
[ROW][C]16[/C][C]0.29099[/C][C]0.581979[/C][C]0.70901[/C][/ROW]
[ROW][C]17[/C][C]0.224038[/C][C]0.448075[/C][C]0.775962[/C][/ROW]
[ROW][C]18[/C][C]0.331984[/C][C]0.663969[/C][C]0.668016[/C][/ROW]
[ROW][C]19[/C][C]0.258337[/C][C]0.516673[/C][C]0.741663[/C][/ROW]
[ROW][C]20[/C][C]0.196818[/C][C]0.393636[/C][C]0.803182[/C][/ROW]
[ROW][C]21[/C][C]0.165489[/C][C]0.330979[/C][C]0.834511[/C][/ROW]
[ROW][C]22[/C][C]0.141413[/C][C]0.282825[/C][C]0.858587[/C][/ROW]
[ROW][C]23[/C][C]0.103343[/C][C]0.206686[/C][C]0.896657[/C][/ROW]
[ROW][C]24[/C][C]0.421527[/C][C]0.843055[/C][C]0.578473[/C][/ROW]
[ROW][C]25[/C][C]0.798846[/C][C]0.402307[/C][C]0.201154[/C][/ROW]
[ROW][C]26[/C][C]0.744874[/C][C]0.510253[/C][C]0.255126[/C][/ROW]
[ROW][C]27[/C][C]0.736264[/C][C]0.527473[/C][C]0.263736[/C][/ROW]
[ROW][C]28[/C][C]0.689186[/C][C]0.621628[/C][C]0.310814[/C][/ROW]
[ROW][C]29[/C][C]0.64574[/C][C]0.708521[/C][C]0.35426[/C][/ROW]
[ROW][C]30[/C][C]0.612849[/C][C]0.774303[/C][C]0.387151[/C][/ROW]
[ROW][C]31[/C][C]0.541171[/C][C]0.917658[/C][C]0.458829[/C][/ROW]
[ROW][C]32[/C][C]0.475722[/C][C]0.951444[/C][C]0.524278[/C][/ROW]
[ROW][C]33[/C][C]0.420424[/C][C]0.840848[/C][C]0.579576[/C][/ROW]
[ROW][C]34[/C][C]0.353124[/C][C]0.706248[/C][C]0.646876[/C][/ROW]
[ROW][C]35[/C][C]0.287624[/C][C]0.575248[/C][C]0.712376[/C][/ROW]
[ROW][C]36[/C][C]0.368294[/C][C]0.736588[/C][C]0.631706[/C][/ROW]
[ROW][C]37[/C][C]0.672819[/C][C]0.654361[/C][C]0.327181[/C][/ROW]
[ROW][C]38[/C][C]0.619752[/C][C]0.760495[/C][C]0.380248[/C][/ROW]
[ROW][C]39[/C][C]0.626963[/C][C]0.746075[/C][C]0.373037[/C][/ROW]
[ROW][C]40[/C][C]0.558187[/C][C]0.883626[/C][C]0.441813[/C][/ROW]
[ROW][C]41[/C][C]0.536387[/C][C]0.927225[/C][C]0.463613[/C][/ROW]
[ROW][C]42[/C][C]0.999541[/C][C]0.000917545[/C][C]0.000458773[/C][/ROW]
[ROW][C]43[/C][C]0.99946[/C][C]0.00107911[/C][C]0.000539553[/C][/ROW]
[ROW][C]44[/C][C]0.999045[/C][C]0.00190922[/C][C]0.000954609[/C][/ROW]
[ROW][C]45[/C][C]0.998764[/C][C]0.00247137[/C][C]0.00123568[/C][/ROW]
[ROW][C]46[/C][C]0.997678[/C][C]0.00464401[/C][C]0.002322[/C][/ROW]
[ROW][C]47[/C][C]0.996414[/C][C]0.00717224[/C][C]0.00358612[/C][/ROW]
[ROW][C]48[/C][C]0.999706[/C][C]0.000587776[/C][C]0.000293888[/C][/ROW]
[ROW][C]49[/C][C]0.999902[/C][C]0.000196243[/C][C]9.81217e-05[/C][/ROW]
[ROW][C]50[/C][C]0.999669[/C][C]0.000662258[/C][C]0.000331129[/C][/ROW]
[ROW][C]51[/C][C]0.999651[/C][C]0.000697681[/C][C]0.00034884[/C][/ROW]
[ROW][C]52[/C][C]0.998992[/C][C]0.00201593[/C][C]0.00100796[/C][/ROW]
[ROW][C]53[/C][C]0.997063[/C][C]0.00587368[/C][C]0.00293684[/C][/ROW]
[ROW][C]54[/C][C]0.989312[/C][C]0.0213754[/C][C]0.0106877[/C][/ROW]
[ROW][C]55[/C][C]0.989892[/C][C]0.0202153[/C][C]0.0101077[/C][/ROW]
[/TABLE]
Source: https://freestatistics.org/blog/index.php?pk=254468&T=5

Globally Unique Identifier (entire table): ba.freestatistics.org/blog/index.php?pk=254468&T=5

As an alternative you can also use a QR Code:  

The GUIDs for individual cells are displayed in the table below:

Goldfeld-Quandt test for Heteroskedasticity
p-valuesAlternative Hypothesis
breakpoint indexgreater2-sidedless
60.2036610.4073210.796339
70.09236450.1847290.907635
80.0424430.0848860.957557
90.02701530.05403060.972985
100.01229190.02458380.987708
110.006519820.01303960.99348
120.09549420.1909880.904506
130.5062680.9874630.493732
140.4341060.8682130.565894
150.3613140.7226280.638686
160.290990.5819790.70901
170.2240380.4480750.775962
180.3319840.6639690.668016
190.2583370.5166730.741663
200.1968180.3936360.803182
210.1654890.3309790.834511
220.1414130.2828250.858587
230.1033430.2066860.896657
240.4215270.8430550.578473
250.7988460.4023070.201154
260.7448740.5102530.255126
270.7362640.5274730.263736
280.6891860.6216280.310814
290.645740.7085210.35426
300.6128490.7743030.387151
310.5411710.9176580.458829
320.4757220.9514440.524278
330.4204240.8408480.579576
340.3531240.7062480.646876
350.2876240.5752480.712376
360.3682940.7365880.631706
370.6728190.6543610.327181
380.6197520.7604950.380248
390.6269630.7460750.373037
400.5581870.8836260.441813
410.5363870.9272250.463613
420.9995410.0009175450.000458773
430.999460.001079110.000539553
440.9990450.001909220.000954609
450.9987640.002471370.00123568
460.9976780.004644010.002322
470.9964140.007172240.00358612
480.9997060.0005877760.000293888
490.9999020.0001962439.81217e-05
500.9996690.0006622580.000331129
510.9996510.0006976810.00034884
520.9989920.002015930.00100796
530.9970630.005873680.00293684
540.9893120.02137540.0106877
550.9898920.02021530.0101077


Meta Analysis of Goldfeld-Quandt test for Heteroskedasticity
Description# significant tests% significant testsOK/NOK
1% type I error level120.24NOK
5% type I error level160.32NOK
10% type I error level180.36NOK

\begin{tabular}{lllllllll}
\hline
Meta Analysis of Goldfeld-Quandt test for Heteroskedasticity \tabularnewline
Description & # significant tests & % significant tests & OK/NOK \tabularnewline
1% type I error level & 12 & 0.24 & NOK \tabularnewline
5% type I error level & 16 & 0.32 & NOK \tabularnewline
10% type I error level & 18 & 0.36 & NOK \tabularnewline
\hline
\end{tabular}
%Source: https://freestatistics.org/blog/index.php?pk=254468&T=6

[TABLE]
[ROW][C]Meta Analysis of Goldfeld-Quandt test for Heteroskedasticity[/C][/ROW]
[ROW][C]Description[/C][C]# significant tests[/C][C]% significant tests[/C][C]OK/NOK[/C][/ROW]
[ROW][C]1% type I error level[/C][C]12[/C][C]0.24[/C][C]NOK[/C][/ROW]
[ROW][C]5% type I error level[/C][C]16[/C][C]0.32[/C][C]NOK[/C][/ROW]
[ROW][C]10% type I error level[/C][C]18[/C][C]0.36[/C][C]NOK[/C][/ROW]
[/TABLE]
Source: https://freestatistics.org/blog/index.php?pk=254468&T=6

Globally Unique Identifier (entire table): ba.freestatistics.org/blog/index.php?pk=254468&T=6

As an alternative you can also use a QR Code:  

The GUIDs for individual cells are displayed in the table below:

Meta Analysis of Goldfeld-Quandt test for Heteroskedasticity
Description# significant tests% significant testsOK/NOK
1% type I error level120.24NOK
5% type I error level160.32NOK
10% type I error level180.36NOK


Parameters (Session):
par1 = 1 ; par2 = Do not include Seasonal Dummies ; par3 = No Linear Trend ;
Parameters (R input):
par1 = 1 ; par2 = Do not include Seasonal Dummies ; par3 = No Linear Trend ;
R code (references can be found in the software module):
library(lattice)
library(lmtest)
n25 <- 25 #minimum number of obs. for Goldfeld-Quandt test
par1 <- as.numeric(par1)
x <- t(y)
k <- length(x[1,])
n <- length(x[,1])
x1 <- cbind(x[,par1], x[,1:k!=par1])
mycolnames <- c(colnames(x)[par1], colnames(x)[1:k!=par1])
colnames(x1) <- mycolnames #colnames(x)[par1]
x <- x1
if (par3 == 'First Differences'){
x2 <- array(0, dim=c(n-1,k), dimnames=list(1:(n-1), paste('(1-B)',colnames(x),sep='')))
for (i in 1:n-1) {
for (j in 1:k) {
x2[i,j] <- x[i+1,j] - x[i,j]
}
}
x <- x2
}
if (par2 == 'Include Monthly Dummies'){
x2 <- array(0, dim=c(n,11), dimnames=list(1:n, paste('M', seq(1:11), sep ='')))
for (i in 1:11){
x2[seq(i,n,12),i] <- 1
}
x <- cbind(x, x2)
}
if (par2 == 'Include Quarterly Dummies'){
x2 <- array(0, dim=c(n,3), dimnames=list(1:n, paste('Q', seq(1:3), sep ='')))
for (i in 1:3){
x2[seq(i,n,4),i] <- 1
}
x <- cbind(x, x2)
}
k <- length(x[1,])
if (par3 == 'Linear Trend'){
x <- cbind(x, c(1:n))
colnames(x)[k+1] <- 't'
}
x
k <- length(x[1,])
df <- as.data.frame(x)
(mylm <- lm(df))
(mysum <- summary(mylm))
if (n > n25) {
kp3 <- k + 3
nmkm3 <- n - k - 3
gqarr <- array(NA, dim=c(nmkm3-kp3+1,3))
numgqtests <- 0
numsignificant1 <- 0
numsignificant5 <- 0
numsignificant10 <- 0
for (mypoint in kp3:nmkm3) {
j <- 0
numgqtests <- numgqtests + 1
for (myalt in c('greater', 'two.sided', 'less')) {
j <- j + 1
gqarr[mypoint-kp3+1,j] <- gqtest(mylm, point=mypoint, alternative=myalt)$p.value
}
if (gqarr[mypoint-kp3+1,2] < 0.01) numsignificant1 <- numsignificant1 + 1
if (gqarr[mypoint-kp3+1,2] < 0.05) numsignificant5 <- numsignificant5 + 1
if (gqarr[mypoint-kp3+1,2] < 0.10) numsignificant10 <- numsignificant10 + 1
}
gqarr
}
bitmap(file='test0.png')
plot(x[,1], type='l', main='Actuals and Interpolation', ylab='value of Actuals and Interpolation (dots)', xlab='time or index')
points(x[,1]-mysum$resid)
grid()
dev.off()
bitmap(file='test1.png')
plot(mysum$resid, type='b', pch=19, main='Residuals', ylab='value of Residuals', xlab='time or index')
grid()
dev.off()
bitmap(file='test2.png')
hist(mysum$resid, main='Residual Histogram', xlab='values of Residuals')
grid()
dev.off()
bitmap(file='test3.png')
densityplot(~mysum$resid,col='black',main='Residual Density Plot', xlab='values of Residuals')
dev.off()
bitmap(file='test4.png')
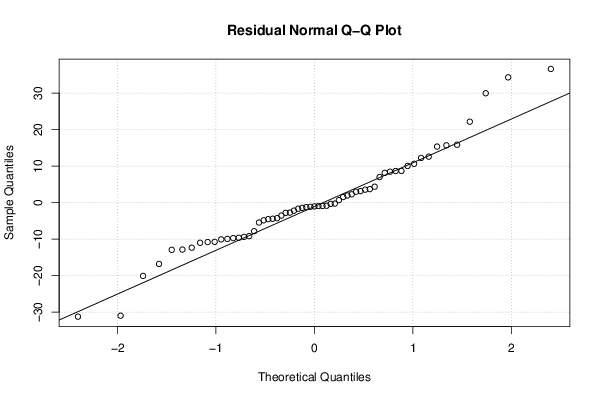
qqnorm(mysum$resid, main='Residual Normal Q-Q Plot')
qqline(mysum$resid)
grid()
dev.off()
(myerror <- as.ts(mysum$resid))
bitmap(file='test5.png')
dum <- cbind(lag(myerror,k=1),myerror)
dum
dum1 <- dum[2:length(myerror),]
dum1
z <- as.data.frame(dum1)
z
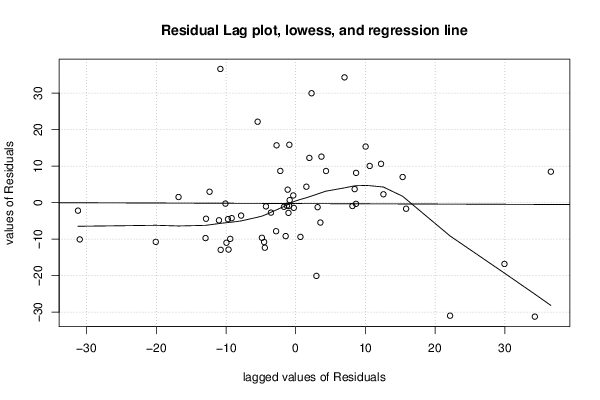
plot(z,main=paste('Residual Lag plot, lowess, and regression line'), ylab='values of Residuals', xlab='lagged values of Residuals')
lines(lowess(z))
abline(lm(z))
grid()
dev.off()
bitmap(file='test6.png')
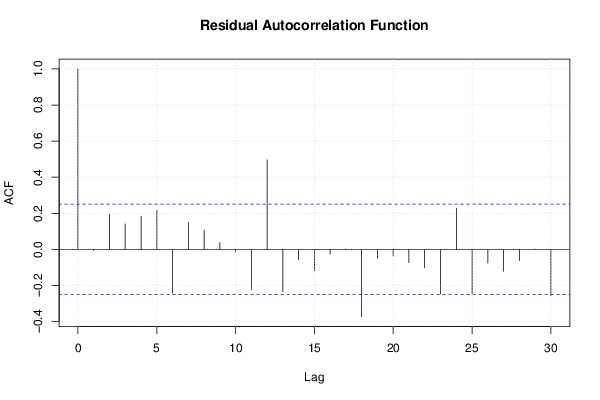
acf(mysum$resid, lag.max=length(mysum$resid)/2, main='Residual Autocorrelation Function')
grid()
dev.off()
bitmap(file='test7.png')
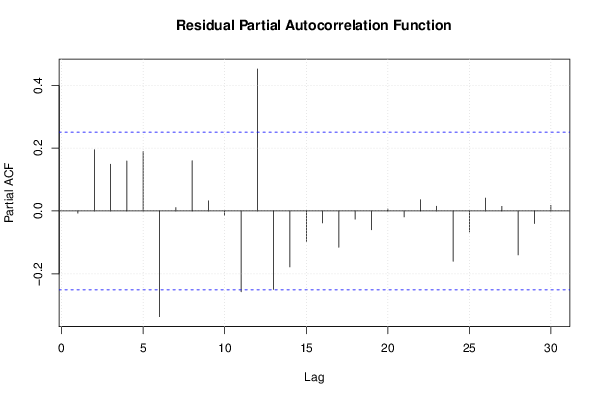
pacf(mysum$resid, lag.max=length(mysum$resid)/2, main='Residual Partial Autocorrelation Function')
grid()
dev.off()
bitmap(file='test8.png')
opar <- par(mfrow = c(2,2), oma = c(0, 0, 1.1, 0))
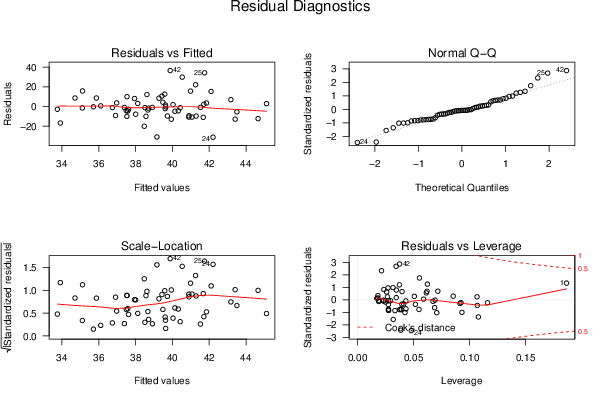
plot(mylm, las = 1, sub='Residual Diagnostics')
par(opar)
dev.off()
if (n > n25) {
bitmap(file='test9.png')
plot(kp3:nmkm3,gqarr[,2], main='Goldfeld-Quandt test',ylab='2-sided p-value',xlab='breakpoint')
grid()
dev.off()
}
load(file='createtable')
a<-table.start()
a<-table.row.start(a)
a<-table.element(a, 'Multiple Linear Regression - Estimated Regression Equation', 1, TRUE)
a<-table.row.end(a)
myeq <- colnames(x)[1]
myeq <- paste(myeq, '[t] = ', sep='')
for (i in 1:k){
if (mysum$coefficients[i,1] > 0) myeq <- paste(myeq, '+', '')
myeq <- paste(myeq, signif(mysum$coefficients[i,1],6), sep=' ')
if (rownames(mysum$coefficients)[i] != '(Intercept)') {
myeq <- paste(myeq, rownames(mysum$coefficients)[i], sep='')
if (rownames(mysum$coefficients)[i] != 't') myeq <- paste(myeq, '[t]', sep='')
}
}
myeq <- paste(myeq, ' + e[t]')
a<-table.row.start(a)
a<-table.element(a, myeq)
a<-table.row.end(a)
a<-table.end(a)
table.save(a,file='mytable1.tab')
a<-table.start()
a<-table.row.start(a)
a<-table.element(a,hyperlink('ols1.htm','Multiple Linear Regression - Ordinary Least Squares',''), 6, TRUE)
a<-table.row.end(a)
a<-table.row.start(a)
a<-table.element(a,'Variable',header=TRUE)
a<-table.element(a,'Parameter',header=TRUE)
a<-table.element(a,'S.D.',header=TRUE)
a<-table.element(a,'T-STAT
H0: parameter = 0',header=TRUE)
a<-table.element(a,'2-tail p-value',header=TRUE)
a<-table.element(a,'1-tail p-value',header=TRUE)
a<-table.row.end(a)
for (i in 1:k){
a<-table.row.start(a)
a<-table.element(a,rownames(mysum$coefficients)[i],header=TRUE)
a<-table.element(a,signif(mysum$coefficients[i,1],6))
a<-table.element(a, signif(mysum$coefficients[i,2],6))
a<-table.element(a, signif(mysum$coefficients[i,3],4))
a<-table.element(a, signif(mysum$coefficients[i,4],6))
a<-table.element(a, signif(mysum$coefficients[i,4]/2,6))
a<-table.row.end(a)
}
a<-table.end(a)
table.save(a,file='mytable2.tab')
a<-table.start()
a<-table.row.start(a)
a<-table.element(a, 'Multiple Linear Regression - Regression Statistics', 2, TRUE)
a<-table.row.end(a)
a<-table.row.start(a)
a<-table.element(a, 'Multiple R',1,TRUE)
a<-table.element(a, signif(sqrt(mysum$r.squared),6))
a<-table.row.end(a)
a<-table.row.start(a)
a<-table.element(a, 'R-squared',1,TRUE)
a<-table.element(a, signif(mysum$r.squared,6))
a<-table.row.end(a)
a<-table.row.start(a)
a<-table.element(a, 'Adjusted R-squared',1,TRUE)
a<-table.element(a, signif(mysum$adj.r.squared,6))
a<-table.row.end(a)
a<-table.row.start(a)
a<-table.element(a, 'F-TEST (value)',1,TRUE)
a<-table.element(a, signif(mysum$fstatistic[1],6))
a<-table.row.end(a)
a<-table.row.start(a)
a<-table.element(a, 'F-TEST (DF numerator)',1,TRUE)
a<-table.element(a, signif(mysum$fstatistic[2],6))
a<-table.row.end(a)
a<-table.row.start(a)
a<-table.element(a, 'F-TEST (DF denominator)',1,TRUE)
a<-table.element(a, signif(mysum$fstatistic[3],6))
a<-table.row.end(a)
a<-table.row.start(a)
a<-table.element(a, 'p-value',1,TRUE)
a<-table.element(a, signif(1-pf(mysum$fstatistic[1],mysum$fstatistic[2],mysum$fstatistic[3]),6))
a<-table.row.end(a)
a<-table.row.start(a)
a<-table.element(a, 'Multiple Linear Regression - Residual Statistics', 2, TRUE)
a<-table.row.end(a)
a<-table.row.start(a)
a<-table.element(a, 'Residual Standard Deviation',1,TRUE)
a<-table.element(a, signif(mysum$sigma,6))
a<-table.row.end(a)
a<-table.row.start(a)
a<-table.element(a, 'Sum Squared Residuals',1,TRUE)
a<-table.element(a, signif(sum(myerror*myerror),6))
a<-table.row.end(a)
a<-table.end(a)
table.save(a,file='mytable3.tab')
a<-table.start()
a<-table.row.start(a)
a<-table.element(a, 'Multiple Linear Regression - Actuals, Interpolation, and Residuals', 4, TRUE)
a<-table.row.end(a)
a<-table.row.start(a)
a<-table.element(a, 'Time or Index', 1, TRUE)
a<-table.element(a, 'Actuals', 1, TRUE)
a<-table.element(a, 'Interpolation
Forecast', 1, TRUE)
a<-table.element(a, 'Residuals
Prediction Error', 1, TRUE)
a<-table.row.end(a)
for (i in 1:n) {
a<-table.row.start(a)
a<-table.element(a,i, 1, TRUE)
a<-table.element(a,signif(x[i],6))
a<-table.element(a,signif(x[i]-mysum$resid[i],6))
a<-table.element(a,signif(mysum$resid[i],6))
a<-table.row.end(a)
}
a<-table.end(a)
table.save(a,file='mytable4.tab')
if (n > n25) {
a<-table.start()
a<-table.row.start(a)
a<-table.element(a,'Goldfeld-Quandt test for Heteroskedasticity',4,TRUE)
a<-table.row.end(a)
a<-table.row.start(a)
a<-table.element(a,'p-values',header=TRUE)
a<-table.element(a,'Alternative Hypothesis',3,header=TRUE)
a<-table.row.end(a)
a<-table.row.start(a)
a<-table.element(a,'breakpoint index',header=TRUE)
a<-table.element(a,'greater',header=TRUE)
a<-table.element(a,'2-sided',header=TRUE)
a<-table.element(a,'less',header=TRUE)
a<-table.row.end(a)
for (mypoint in kp3:nmkm3) {
a<-table.row.start(a)
a<-table.element(a,mypoint,header=TRUE)
a<-table.element(a,signif(gqarr[mypoint-kp3+1,1],6))
a<-table.element(a,signif(gqarr[mypoint-kp3+1,2],6))
a<-table.element(a,signif(gqarr[mypoint-kp3+1,3],6))
a<-table.row.end(a)
}
a<-table.end(a)
table.save(a,file='mytable5.tab')
a<-table.start()
a<-table.row.start(a)
a<-table.element(a,'Meta Analysis of Goldfeld-Quandt test for Heteroskedasticity',4,TRUE)
a<-table.row.end(a)
a<-table.row.start(a)
a<-table.element(a,'Description',header=TRUE)
a<-table.element(a,'# significant tests',header=TRUE)
a<-table.element(a,'% significant tests',header=TRUE)
a<-table.element(a,'OK/NOK',header=TRUE)
a<-table.row.end(a)
a<-table.row.start(a)
a<-table.element(a,'1% type I error level',header=TRUE)
a<-table.element(a,signif(numsignificant1,6))
a<-table.element(a,signif(numsignificant1/numgqtests,6))
if (numsignificant1/numgqtests < 0.01) dum <- 'OK' else dum <- 'NOK'
a<-table.element(a,dum)
a<-table.row.end(a)
a<-table.row.start(a)
a<-table.element(a,'5% type I error level',header=TRUE)
a<-table.element(a,signif(numsignificant5,6))
a<-table.element(a,signif(numsignificant5/numgqtests,6))
if (numsignificant5/numgqtests < 0.05) dum <- 'OK' else dum <- 'NOK'
a<-table.element(a,dum)
a<-table.row.end(a)
a<-table.row.start(a)
a<-table.element(a,'10% type I error level',header=TRUE)
a<-table.element(a,signif(numsignificant10,6))
a<-table.element(a,signif(numsignificant10/numgqtests,6))
if (numsignificant10/numgqtests < 0.1) dum <- 'OK' else dum <- 'NOK'
a<-table.element(a,dum)
a<-table.row.end(a)
a<-table.end(a)
table.save(a,file='mytable6.tab')
}