Free Statistics

of Irreproducible Research!

Author's title

Author*Unverified author*
R Software Modulerwasp_autocorrelation.wasp
Title produced by software(Partial) Autocorrelation Function
Date of computationSun, 16 Nov 2014 22:44:46 +0000
Cite this page as followsStatistical Computations at FreeStatistics.org, Office for Research Development and Education, URL https://freestatistics.org/blog/index.php?v=date/2014/Nov/16/t1416177921egwr8fvdf3lgsf7.htm/, Retrieved Fri, 17 May 2024 04:50:13 +0000
Statistical Computations at FreeStatistics.org, Office for Research Development and Education, URL https://freestatistics.org/blog/index.php?pk=255373, Retrieved Fri, 17 May 2024 04:50:13 +0000
QR Codes:

Original text written by user:
IsPrivate?No (this computation is public)
User-defined keywords
Estimated Impact94
Family? (F = Feedback message, R = changed R code, M = changed R Module, P = changed Parameters, D = changed Data)
-       [(Partial) Autocorrelation Function] [Partial autocorre...] [2014-11-16 22:44:46] [5bf76c10641fca8e28dadcb3ba7a941a] [Current]
Feedback Forum

Post a new message
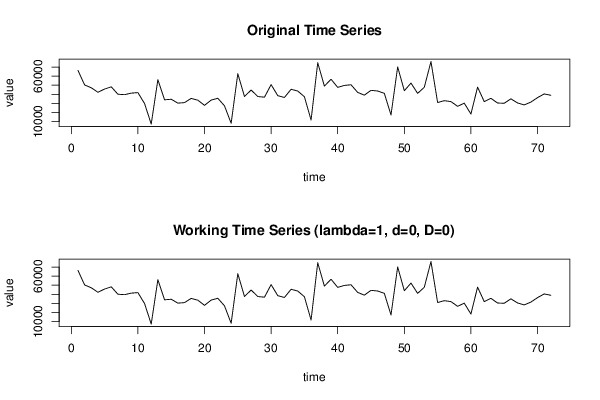
Dataseries X:
66329
50326
47182
42247
45796
48233
40079
39596
41275
41875
29784
7199
56166
33936
34532
30261
30857
35461
33525
27825
33624
35618
27329
8081
62751
37565
44749
37537
36825
50679
38488
36522
45545
43571
37343
11593
74784
49019
56601
47634
49807
50499
42092
39064
44376
43616
41059
17226
70170
43949
52333
41034
47760
76115
30918
32994
31947
26763
30251
18211
47957
31901
35560
30408
30083
35044
30475
28308
31395
36311
40426
38948


Summary of computational transaction
Raw Inputview raw input (R code)
Raw Outputview raw output of R engine
Computing time1 seconds
R Server'George Udny Yule' @ yule.wessa.net

\begin{tabular}{lllllllll}
\hline
Summary of computational transaction \tabularnewline
Raw Input & view raw input (R code)  \tabularnewline
Raw Output & view raw output of R engine  \tabularnewline
Computing time & 1 seconds \tabularnewline
R Server & 'George Udny Yule' @ yule.wessa.net \tabularnewline
\hline
\end{tabular}
%Source: https://freestatistics.org/blog/index.php?pk=255373&T=0

[TABLE]
[ROW][C]Summary of computational transaction[/C][/ROW]
[ROW][C]Raw Input[/C][C]view raw input (R code) [/C][/ROW]
[ROW][C]Raw Output[/C][C]view raw output of R engine [/C][/ROW]
[ROW][C]Computing time[/C][C]1 seconds[/C][/ROW]
[ROW][C]R Server[/C][C]'George Udny Yule' @ yule.wessa.net[/C][/ROW]
[/TABLE]
Source: https://freestatistics.org/blog/index.php?pk=255373&T=0

Globally Unique Identifier (entire table): ba.freestatistics.org/blog/index.php?pk=255373&T=0

As an alternative you can also use a QR Code:  

The GUIDs for individual cells are displayed in the table below:

Summary of computational transaction
Raw Inputview raw input (R code)
Raw Outputview raw output of R engine
Computing time1 seconds
R Server'George Udny Yule' @ yule.wessa.net


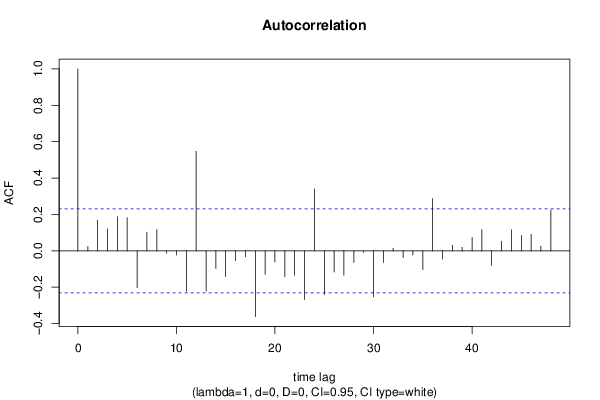
Autocorrelation Function
Time lag kACF(k)T-STATP-value
10.0237090.20120.420565
20.16811.42640.079041
30.1199761.0180.156035
40.1874581.59060.058037
50.1819861.54420.063462
6-0.202198-1.71570.045258
70.1026860.87130.193238
80.1169120.9920.162252
9-0.014634-0.12420.450762
10-0.023285-0.19760.421967
11-0.222179-1.88530.031715
120.5467854.63968e-06
13-0.220501-1.8710.032704
14-0.096294-0.81710.208289
15-0.141092-1.19720.117577
16-0.053902-0.45740.324389
17-0.032247-0.27360.392579
18-0.361684-3.0690.001514
19-0.128795-1.09290.139048
20-0.060567-0.51390.304439
21-0.142352-1.20790.115521
22-0.134046-1.13740.129567
23-0.267143-2.26680.013204
240.3399232.88430.002585
25-0.239974-2.03620.022702
26-0.116667-0.990.162756
27-0.134116-1.1380.129444
28-0.063254-0.53670.296555
29-0.008501-0.07210.471348
30-0.252821-2.14530.017653
31-0.063499-0.53880.295841
320.0145490.12350.451046
33-0.036281-0.30790.379542
34-0.022581-0.19160.424296
35-0.103038-0.87430.19243
360.2861412.4280.008842
37-0.044486-0.37750.353464
380.0313540.2660.395483
390.0193620.16430.434982
400.0738980.6270.266307
410.1169570.99240.162161
42-0.079089-0.67110.252155
430.0532410.45180.326398
440.1154310.97950.165314
450.084520.71720.237794
460.0907140.76970.221988
470.0261260.22170.412591
480.2244411.90440.030424

\begin{tabular}{lllllllll}
\hline
Autocorrelation Function \tabularnewline
Time lag k & ACF(k) & T-STAT & P-value \tabularnewline
1 & 0.023709 & 0.2012 & 0.420565 \tabularnewline
2 & 0.1681 & 1.4264 & 0.079041 \tabularnewline
3 & 0.119976 & 1.018 & 0.156035 \tabularnewline
4 & 0.187458 & 1.5906 & 0.058037 \tabularnewline
5 & 0.181986 & 1.5442 & 0.063462 \tabularnewline
6 & -0.202198 & -1.7157 & 0.045258 \tabularnewline
7 & 0.102686 & 0.8713 & 0.193238 \tabularnewline
8 & 0.116912 & 0.992 & 0.162252 \tabularnewline
9 & -0.014634 & -0.1242 & 0.450762 \tabularnewline
10 & -0.023285 & -0.1976 & 0.421967 \tabularnewline
11 & -0.222179 & -1.8853 & 0.031715 \tabularnewline
12 & 0.546785 & 4.6396 & 8e-06 \tabularnewline
13 & -0.220501 & -1.871 & 0.032704 \tabularnewline
14 & -0.096294 & -0.8171 & 0.208289 \tabularnewline
15 & -0.141092 & -1.1972 & 0.117577 \tabularnewline
16 & -0.053902 & -0.4574 & 0.324389 \tabularnewline
17 & -0.032247 & -0.2736 & 0.392579 \tabularnewline
18 & -0.361684 & -3.069 & 0.001514 \tabularnewline
19 & -0.128795 & -1.0929 & 0.139048 \tabularnewline
20 & -0.060567 & -0.5139 & 0.304439 \tabularnewline
21 & -0.142352 & -1.2079 & 0.115521 \tabularnewline
22 & -0.134046 & -1.1374 & 0.129567 \tabularnewline
23 & -0.267143 & -2.2668 & 0.013204 \tabularnewline
24 & 0.339923 & 2.8843 & 0.002585 \tabularnewline
25 & -0.239974 & -2.0362 & 0.022702 \tabularnewline
26 & -0.116667 & -0.99 & 0.162756 \tabularnewline
27 & -0.134116 & -1.138 & 0.129444 \tabularnewline
28 & -0.063254 & -0.5367 & 0.296555 \tabularnewline
29 & -0.008501 & -0.0721 & 0.471348 \tabularnewline
30 & -0.252821 & -2.1453 & 0.017653 \tabularnewline
31 & -0.063499 & -0.5388 & 0.295841 \tabularnewline
32 & 0.014549 & 0.1235 & 0.451046 \tabularnewline
33 & -0.036281 & -0.3079 & 0.379542 \tabularnewline
34 & -0.022581 & -0.1916 & 0.424296 \tabularnewline
35 & -0.103038 & -0.8743 & 0.19243 \tabularnewline
36 & 0.286141 & 2.428 & 0.008842 \tabularnewline
37 & -0.044486 & -0.3775 & 0.353464 \tabularnewline
38 & 0.031354 & 0.266 & 0.395483 \tabularnewline
39 & 0.019362 & 0.1643 & 0.434982 \tabularnewline
40 & 0.073898 & 0.627 & 0.266307 \tabularnewline
41 & 0.116957 & 0.9924 & 0.162161 \tabularnewline
42 & -0.079089 & -0.6711 & 0.252155 \tabularnewline
43 & 0.053241 & 0.4518 & 0.326398 \tabularnewline
44 & 0.115431 & 0.9795 & 0.165314 \tabularnewline
45 & 0.08452 & 0.7172 & 0.237794 \tabularnewline
46 & 0.090714 & 0.7697 & 0.221988 \tabularnewline
47 & 0.026126 & 0.2217 & 0.412591 \tabularnewline
48 & 0.224441 & 1.9044 & 0.030424 \tabularnewline
\hline
\end{tabular}
%Source: https://freestatistics.org/blog/index.php?pk=255373&T=1

[TABLE]
[ROW][C]Autocorrelation Function[/C][/ROW]
[ROW][C]Time lag k[/C][C]ACF(k)[/C][C]T-STAT[/C][C]P-value[/C][/ROW]
[ROW][C]1[/C][C]0.023709[/C][C]0.2012[/C][C]0.420565[/C][/ROW]
[ROW][C]2[/C][C]0.1681[/C][C]1.4264[/C][C]0.079041[/C][/ROW]
[ROW][C]3[/C][C]0.119976[/C][C]1.018[/C][C]0.156035[/C][/ROW]
[ROW][C]4[/C][C]0.187458[/C][C]1.5906[/C][C]0.058037[/C][/ROW]
[ROW][C]5[/C][C]0.181986[/C][C]1.5442[/C][C]0.063462[/C][/ROW]
[ROW][C]6[/C][C]-0.202198[/C][C]-1.7157[/C][C]0.045258[/C][/ROW]
[ROW][C]7[/C][C]0.102686[/C][C]0.8713[/C][C]0.193238[/C][/ROW]
[ROW][C]8[/C][C]0.116912[/C][C]0.992[/C][C]0.162252[/C][/ROW]
[ROW][C]9[/C][C]-0.014634[/C][C]-0.1242[/C][C]0.450762[/C][/ROW]
[ROW][C]10[/C][C]-0.023285[/C][C]-0.1976[/C][C]0.421967[/C][/ROW]
[ROW][C]11[/C][C]-0.222179[/C][C]-1.8853[/C][C]0.031715[/C][/ROW]
[ROW][C]12[/C][C]0.546785[/C][C]4.6396[/C][C]8e-06[/C][/ROW]
[ROW][C]13[/C][C]-0.220501[/C][C]-1.871[/C][C]0.032704[/C][/ROW]
[ROW][C]14[/C][C]-0.096294[/C][C]-0.8171[/C][C]0.208289[/C][/ROW]
[ROW][C]15[/C][C]-0.141092[/C][C]-1.1972[/C][C]0.117577[/C][/ROW]
[ROW][C]16[/C][C]-0.053902[/C][C]-0.4574[/C][C]0.324389[/C][/ROW]
[ROW][C]17[/C][C]-0.032247[/C][C]-0.2736[/C][C]0.392579[/C][/ROW]
[ROW][C]18[/C][C]-0.361684[/C][C]-3.069[/C][C]0.001514[/C][/ROW]
[ROW][C]19[/C][C]-0.128795[/C][C]-1.0929[/C][C]0.139048[/C][/ROW]
[ROW][C]20[/C][C]-0.060567[/C][C]-0.5139[/C][C]0.304439[/C][/ROW]
[ROW][C]21[/C][C]-0.142352[/C][C]-1.2079[/C][C]0.115521[/C][/ROW]
[ROW][C]22[/C][C]-0.134046[/C][C]-1.1374[/C][C]0.129567[/C][/ROW]
[ROW][C]23[/C][C]-0.267143[/C][C]-2.2668[/C][C]0.013204[/C][/ROW]
[ROW][C]24[/C][C]0.339923[/C][C]2.8843[/C][C]0.002585[/C][/ROW]
[ROW][C]25[/C][C]-0.239974[/C][C]-2.0362[/C][C]0.022702[/C][/ROW]
[ROW][C]26[/C][C]-0.116667[/C][C]-0.99[/C][C]0.162756[/C][/ROW]
[ROW][C]27[/C][C]-0.134116[/C][C]-1.138[/C][C]0.129444[/C][/ROW]
[ROW][C]28[/C][C]-0.063254[/C][C]-0.5367[/C][C]0.296555[/C][/ROW]
[ROW][C]29[/C][C]-0.008501[/C][C]-0.0721[/C][C]0.471348[/C][/ROW]
[ROW][C]30[/C][C]-0.252821[/C][C]-2.1453[/C][C]0.017653[/C][/ROW]
[ROW][C]31[/C][C]-0.063499[/C][C]-0.5388[/C][C]0.295841[/C][/ROW]
[ROW][C]32[/C][C]0.014549[/C][C]0.1235[/C][C]0.451046[/C][/ROW]
[ROW][C]33[/C][C]-0.036281[/C][C]-0.3079[/C][C]0.379542[/C][/ROW]
[ROW][C]34[/C][C]-0.022581[/C][C]-0.1916[/C][C]0.424296[/C][/ROW]
[ROW][C]35[/C][C]-0.103038[/C][C]-0.8743[/C][C]0.19243[/C][/ROW]
[ROW][C]36[/C][C]0.286141[/C][C]2.428[/C][C]0.008842[/C][/ROW]
[ROW][C]37[/C][C]-0.044486[/C][C]-0.3775[/C][C]0.353464[/C][/ROW]
[ROW][C]38[/C][C]0.031354[/C][C]0.266[/C][C]0.395483[/C][/ROW]
[ROW][C]39[/C][C]0.019362[/C][C]0.1643[/C][C]0.434982[/C][/ROW]
[ROW][C]40[/C][C]0.073898[/C][C]0.627[/C][C]0.266307[/C][/ROW]
[ROW][C]41[/C][C]0.116957[/C][C]0.9924[/C][C]0.162161[/C][/ROW]
[ROW][C]42[/C][C]-0.079089[/C][C]-0.6711[/C][C]0.252155[/C][/ROW]
[ROW][C]43[/C][C]0.053241[/C][C]0.4518[/C][C]0.326398[/C][/ROW]
[ROW][C]44[/C][C]0.115431[/C][C]0.9795[/C][C]0.165314[/C][/ROW]
[ROW][C]45[/C][C]0.08452[/C][C]0.7172[/C][C]0.237794[/C][/ROW]
[ROW][C]46[/C][C]0.090714[/C][C]0.7697[/C][C]0.221988[/C][/ROW]
[ROW][C]47[/C][C]0.026126[/C][C]0.2217[/C][C]0.412591[/C][/ROW]
[ROW][C]48[/C][C]0.224441[/C][C]1.9044[/C][C]0.030424[/C][/ROW]
[/TABLE]
Source: https://freestatistics.org/blog/index.php?pk=255373&T=1

Globally Unique Identifier (entire table): ba.freestatistics.org/blog/index.php?pk=255373&T=1

As an alternative you can also use a QR Code:  

The GUIDs for individual cells are displayed in the table below:

Autocorrelation Function
Time lag kACF(k)T-STATP-value
10.0237090.20120.420565
20.16811.42640.079041
30.1199761.0180.156035
40.1874581.59060.058037
50.1819861.54420.063462
6-0.202198-1.71570.045258
70.1026860.87130.193238
80.1169120.9920.162252
9-0.014634-0.12420.450762
10-0.023285-0.19760.421967
11-0.222179-1.88530.031715
120.5467854.63968e-06
13-0.220501-1.8710.032704
14-0.096294-0.81710.208289
15-0.141092-1.19720.117577
16-0.053902-0.45740.324389
17-0.032247-0.27360.392579
18-0.361684-3.0690.001514
19-0.128795-1.09290.139048
20-0.060567-0.51390.304439
21-0.142352-1.20790.115521
22-0.134046-1.13740.129567
23-0.267143-2.26680.013204
240.3399232.88430.002585
25-0.239974-2.03620.022702
26-0.116667-0.990.162756
27-0.134116-1.1380.129444
28-0.063254-0.53670.296555
29-0.008501-0.07210.471348
30-0.252821-2.14530.017653
31-0.063499-0.53880.295841
320.0145490.12350.451046
33-0.036281-0.30790.379542
34-0.022581-0.19160.424296
35-0.103038-0.87430.19243
360.2861412.4280.008842
37-0.044486-0.37750.353464
380.0313540.2660.395483
390.0193620.16430.434982
400.0738980.6270.266307
410.1169570.99240.162161
42-0.079089-0.67110.252155
430.0532410.45180.326398
440.1154310.97950.165314
450.084520.71720.237794
460.0907140.76970.221988
470.0261260.22170.412591
480.2244411.90440.030424


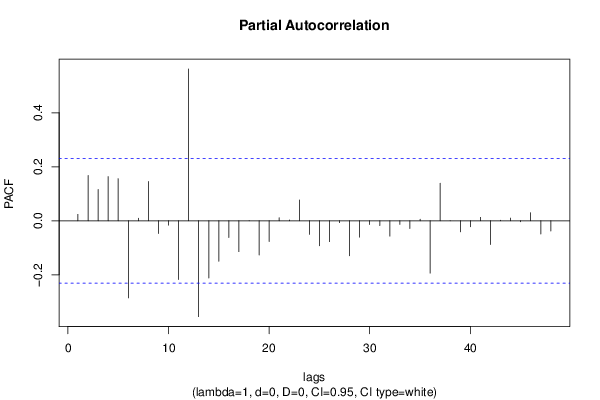
Partial Autocorrelation Function
Time lag kPACF(k)T-STATP-value
10.0237090.20120.420565
20.1676321.42240.079613
30.1160080.98440.164117
40.1637091.38910.08454
50.1560461.32410.094831
6-0.285427-2.42190.008979
70.0096050.08150.467635
80.1457531.23680.110098
9-0.046991-0.39870.345636
10-0.016014-0.13590.446146
11-0.217736-1.84750.034388
120.5623434.77165e-06
13-0.355034-3.01260.001787
14-0.212217-1.80070.037967
15-0.150119-1.27380.103416
16-0.06191-0.52530.300485
17-0.114177-0.96880.167939
18-0.000122-0.0010.49959
19-0.127052-1.07810.142301
20-0.076944-0.65290.257952
210.0110750.0940.462694
220.0031720.02690.489301
230.0768710.65230.258152
24-0.050306-0.42690.335378
25-0.092367-0.78380.217875
26-0.077312-0.6560.256953
27-0.006833-0.0580.476964
28-0.129439-1.09830.137861
29-0.060588-0.51410.304376
30-0.013902-0.1180.453213
31-0.017809-0.15110.440153
32-0.056956-0.48330.315179
33-0.013296-0.11280.455243
34-0.028409-0.24110.405098
350.0056330.04780.481006
36-0.193943-1.64570.052096
370.1391181.18050.120852
380.0001260.00110.499576
39-0.040978-0.34770.364536
40-0.022033-0.1870.426111
410.0127340.10810.457128
42-0.087984-0.74660.228877
430.0017820.01510.493989
440.009830.08340.466879
45-0.003755-0.03190.487336
460.0295180.25050.401468
47-0.048842-0.41440.339891
48-0.037852-0.32120.3745

\begin{tabular}{lllllllll}
\hline
Partial Autocorrelation Function \tabularnewline
Time lag k & PACF(k) & T-STAT & P-value \tabularnewline
1 & 0.023709 & 0.2012 & 0.420565 \tabularnewline
2 & 0.167632 & 1.4224 & 0.079613 \tabularnewline
3 & 0.116008 & 0.9844 & 0.164117 \tabularnewline
4 & 0.163709 & 1.3891 & 0.08454 \tabularnewline
5 & 0.156046 & 1.3241 & 0.094831 \tabularnewline
6 & -0.285427 & -2.4219 & 0.008979 \tabularnewline
7 & 0.009605 & 0.0815 & 0.467635 \tabularnewline
8 & 0.145753 & 1.2368 & 0.110098 \tabularnewline
9 & -0.046991 & -0.3987 & 0.345636 \tabularnewline
10 & -0.016014 & -0.1359 & 0.446146 \tabularnewline
11 & -0.217736 & -1.8475 & 0.034388 \tabularnewline
12 & 0.562343 & 4.7716 & 5e-06 \tabularnewline
13 & -0.355034 & -3.0126 & 0.001787 \tabularnewline
14 & -0.212217 & -1.8007 & 0.037967 \tabularnewline
15 & -0.150119 & -1.2738 & 0.103416 \tabularnewline
16 & -0.06191 & -0.5253 & 0.300485 \tabularnewline
17 & -0.114177 & -0.9688 & 0.167939 \tabularnewline
18 & -0.000122 & -0.001 & 0.49959 \tabularnewline
19 & -0.127052 & -1.0781 & 0.142301 \tabularnewline
20 & -0.076944 & -0.6529 & 0.257952 \tabularnewline
21 & 0.011075 & 0.094 & 0.462694 \tabularnewline
22 & 0.003172 & 0.0269 & 0.489301 \tabularnewline
23 & 0.076871 & 0.6523 & 0.258152 \tabularnewline
24 & -0.050306 & -0.4269 & 0.335378 \tabularnewline
25 & -0.092367 & -0.7838 & 0.217875 \tabularnewline
26 & -0.077312 & -0.656 & 0.256953 \tabularnewline
27 & -0.006833 & -0.058 & 0.476964 \tabularnewline
28 & -0.129439 & -1.0983 & 0.137861 \tabularnewline
29 & -0.060588 & -0.5141 & 0.304376 \tabularnewline
30 & -0.013902 & -0.118 & 0.453213 \tabularnewline
31 & -0.017809 & -0.1511 & 0.440153 \tabularnewline
32 & -0.056956 & -0.4833 & 0.315179 \tabularnewline
33 & -0.013296 & -0.1128 & 0.455243 \tabularnewline
34 & -0.028409 & -0.2411 & 0.405098 \tabularnewline
35 & 0.005633 & 0.0478 & 0.481006 \tabularnewline
36 & -0.193943 & -1.6457 & 0.052096 \tabularnewline
37 & 0.139118 & 1.1805 & 0.120852 \tabularnewline
38 & 0.000126 & 0.0011 & 0.499576 \tabularnewline
39 & -0.040978 & -0.3477 & 0.364536 \tabularnewline
40 & -0.022033 & -0.187 & 0.426111 \tabularnewline
41 & 0.012734 & 0.1081 & 0.457128 \tabularnewline
42 & -0.087984 & -0.7466 & 0.228877 \tabularnewline
43 & 0.001782 & 0.0151 & 0.493989 \tabularnewline
44 & 0.00983 & 0.0834 & 0.466879 \tabularnewline
45 & -0.003755 & -0.0319 & 0.487336 \tabularnewline
46 & 0.029518 & 0.2505 & 0.401468 \tabularnewline
47 & -0.048842 & -0.4144 & 0.339891 \tabularnewline
48 & -0.037852 & -0.3212 & 0.3745 \tabularnewline
\hline
\end{tabular}
%Source: https://freestatistics.org/blog/index.php?pk=255373&T=2

[TABLE]
[ROW][C]Partial Autocorrelation Function[/C][/ROW]
[ROW][C]Time lag k[/C][C]PACF(k)[/C][C]T-STAT[/C][C]P-value[/C][/ROW]
[ROW][C]1[/C][C]0.023709[/C][C]0.2012[/C][C]0.420565[/C][/ROW]
[ROW][C]2[/C][C]0.167632[/C][C]1.4224[/C][C]0.079613[/C][/ROW]
[ROW][C]3[/C][C]0.116008[/C][C]0.9844[/C][C]0.164117[/C][/ROW]
[ROW][C]4[/C][C]0.163709[/C][C]1.3891[/C][C]0.08454[/C][/ROW]
[ROW][C]5[/C][C]0.156046[/C][C]1.3241[/C][C]0.094831[/C][/ROW]
[ROW][C]6[/C][C]-0.285427[/C][C]-2.4219[/C][C]0.008979[/C][/ROW]
[ROW][C]7[/C][C]0.009605[/C][C]0.0815[/C][C]0.467635[/C][/ROW]
[ROW][C]8[/C][C]0.145753[/C][C]1.2368[/C][C]0.110098[/C][/ROW]
[ROW][C]9[/C][C]-0.046991[/C][C]-0.3987[/C][C]0.345636[/C][/ROW]
[ROW][C]10[/C][C]-0.016014[/C][C]-0.1359[/C][C]0.446146[/C][/ROW]
[ROW][C]11[/C][C]-0.217736[/C][C]-1.8475[/C][C]0.034388[/C][/ROW]
[ROW][C]12[/C][C]0.562343[/C][C]4.7716[/C][C]5e-06[/C][/ROW]
[ROW][C]13[/C][C]-0.355034[/C][C]-3.0126[/C][C]0.001787[/C][/ROW]
[ROW][C]14[/C][C]-0.212217[/C][C]-1.8007[/C][C]0.037967[/C][/ROW]
[ROW][C]15[/C][C]-0.150119[/C][C]-1.2738[/C][C]0.103416[/C][/ROW]
[ROW][C]16[/C][C]-0.06191[/C][C]-0.5253[/C][C]0.300485[/C][/ROW]
[ROW][C]17[/C][C]-0.114177[/C][C]-0.9688[/C][C]0.167939[/C][/ROW]
[ROW][C]18[/C][C]-0.000122[/C][C]-0.001[/C][C]0.49959[/C][/ROW]
[ROW][C]19[/C][C]-0.127052[/C][C]-1.0781[/C][C]0.142301[/C][/ROW]
[ROW][C]20[/C][C]-0.076944[/C][C]-0.6529[/C][C]0.257952[/C][/ROW]
[ROW][C]21[/C][C]0.011075[/C][C]0.094[/C][C]0.462694[/C][/ROW]
[ROW][C]22[/C][C]0.003172[/C][C]0.0269[/C][C]0.489301[/C][/ROW]
[ROW][C]23[/C][C]0.076871[/C][C]0.6523[/C][C]0.258152[/C][/ROW]
[ROW][C]24[/C][C]-0.050306[/C][C]-0.4269[/C][C]0.335378[/C][/ROW]
[ROW][C]25[/C][C]-0.092367[/C][C]-0.7838[/C][C]0.217875[/C][/ROW]
[ROW][C]26[/C][C]-0.077312[/C][C]-0.656[/C][C]0.256953[/C][/ROW]
[ROW][C]27[/C][C]-0.006833[/C][C]-0.058[/C][C]0.476964[/C][/ROW]
[ROW][C]28[/C][C]-0.129439[/C][C]-1.0983[/C][C]0.137861[/C][/ROW]
[ROW][C]29[/C][C]-0.060588[/C][C]-0.5141[/C][C]0.304376[/C][/ROW]
[ROW][C]30[/C][C]-0.013902[/C][C]-0.118[/C][C]0.453213[/C][/ROW]
[ROW][C]31[/C][C]-0.017809[/C][C]-0.1511[/C][C]0.440153[/C][/ROW]
[ROW][C]32[/C][C]-0.056956[/C][C]-0.4833[/C][C]0.315179[/C][/ROW]
[ROW][C]33[/C][C]-0.013296[/C][C]-0.1128[/C][C]0.455243[/C][/ROW]
[ROW][C]34[/C][C]-0.028409[/C][C]-0.2411[/C][C]0.405098[/C][/ROW]
[ROW][C]35[/C][C]0.005633[/C][C]0.0478[/C][C]0.481006[/C][/ROW]
[ROW][C]36[/C][C]-0.193943[/C][C]-1.6457[/C][C]0.052096[/C][/ROW]
[ROW][C]37[/C][C]0.139118[/C][C]1.1805[/C][C]0.120852[/C][/ROW]
[ROW][C]38[/C][C]0.000126[/C][C]0.0011[/C][C]0.499576[/C][/ROW]
[ROW][C]39[/C][C]-0.040978[/C][C]-0.3477[/C][C]0.364536[/C][/ROW]
[ROW][C]40[/C][C]-0.022033[/C][C]-0.187[/C][C]0.426111[/C][/ROW]
[ROW][C]41[/C][C]0.012734[/C][C]0.1081[/C][C]0.457128[/C][/ROW]
[ROW][C]42[/C][C]-0.087984[/C][C]-0.7466[/C][C]0.228877[/C][/ROW]
[ROW][C]43[/C][C]0.001782[/C][C]0.0151[/C][C]0.493989[/C][/ROW]
[ROW][C]44[/C][C]0.00983[/C][C]0.0834[/C][C]0.466879[/C][/ROW]
[ROW][C]45[/C][C]-0.003755[/C][C]-0.0319[/C][C]0.487336[/C][/ROW]
[ROW][C]46[/C][C]0.029518[/C][C]0.2505[/C][C]0.401468[/C][/ROW]
[ROW][C]47[/C][C]-0.048842[/C][C]-0.4144[/C][C]0.339891[/C][/ROW]
[ROW][C]48[/C][C]-0.037852[/C][C]-0.3212[/C][C]0.3745[/C][/ROW]
[/TABLE]
Source: https://freestatistics.org/blog/index.php?pk=255373&T=2

Globally Unique Identifier (entire table): ba.freestatistics.org/blog/index.php?pk=255373&T=2

As an alternative you can also use a QR Code:  

The GUIDs for individual cells are displayed in the table below:

Partial Autocorrelation Function
Time lag kPACF(k)T-STATP-value
10.0237090.20120.420565
20.1676321.42240.079613
30.1160080.98440.164117
40.1637091.38910.08454
50.1560461.32410.094831
6-0.285427-2.42190.008979
70.0096050.08150.467635
80.1457531.23680.110098
9-0.046991-0.39870.345636
10-0.016014-0.13590.446146
11-0.217736-1.84750.034388
120.5623434.77165e-06
13-0.355034-3.01260.001787
14-0.212217-1.80070.037967
15-0.150119-1.27380.103416
16-0.06191-0.52530.300485
17-0.114177-0.96880.167939
18-0.000122-0.0010.49959
19-0.127052-1.07810.142301
20-0.076944-0.65290.257952
210.0110750.0940.462694
220.0031720.02690.489301
230.0768710.65230.258152
24-0.050306-0.42690.335378
25-0.092367-0.78380.217875
26-0.077312-0.6560.256953
27-0.006833-0.0580.476964
28-0.129439-1.09830.137861
29-0.060588-0.51410.304376
30-0.013902-0.1180.453213
31-0.017809-0.15110.440153
32-0.056956-0.48330.315179
33-0.013296-0.11280.455243
34-0.028409-0.24110.405098
350.0056330.04780.481006
36-0.193943-1.64570.052096
370.1391181.18050.120852
380.0001260.00110.499576
39-0.040978-0.34770.364536
40-0.022033-0.1870.426111
410.0127340.10810.457128
42-0.087984-0.74660.228877
430.0017820.01510.493989
440.009830.08340.466879
45-0.003755-0.03190.487336
460.0295180.25050.401468
47-0.048842-0.41440.339891
48-0.037852-0.32120.3745


Parameters (Session):
par1 = 48 ; par2 = 1 ; par3 = 0 ; par4 = 0 ; par5 = 12 ; par6 = White Noise ; par7 = 0.95 ;
Parameters (R input):
par1 = 48 ; par2 = 1 ; par3 = 0 ; par4 = 0 ; par5 = 12 ; par6 = White Noise ; par7 = 0.95 ; par8 = ;
R code (references can be found in the software module):
if (par1 == 'Default') {
par1 = 10*log10(length(x))
} else {
par1 <- as.numeric(par1)
}
par2 <- as.numeric(par2)
par3 <- as.numeric(par3)
par4 <- as.numeric(par4)
par5 <- as.numeric(par5)
if (par6 == 'White Noise') par6 <- 'white' else par6 <- 'ma'
par7 <- as.numeric(par7)
if (par8 != '') par8 <- as.numeric(par8)
ox <- x
if (par8 == '') {
if (par2 == 0) {
x <- log(x)
} else {
x <- (x ^ par2 - 1) / par2
}
} else {
x <- log(x,base=par8)
}
if (par3 > 0) x <- diff(x,lag=1,difference=par3)
if (par4 > 0) x <- diff(x,lag=par5,difference=par4)
bitmap(file='picts.png')
op <- par(mfrow=c(2,1))
plot(ox,type='l',main='Original Time Series',xlab='time',ylab='value')
if (par8=='') {
mytitle <- paste('Working Time Series (lambda=',par2,', d=',par3,', D=',par4,')',sep='')
mysub <- paste('(lambda=',par2,', d=',par3,', D=',par4,', CI=', par7, ', CI type=',par6,')',sep='')
} else {
mytitle <- paste('Working Time Series (base=',par8,', d=',par3,', D=',par4,')',sep='')
mysub <- paste('(base=',par8,', d=',par3,', D=',par4,', CI=', par7, ', CI type=',par6,')',sep='')
}
plot(x,type='l', main=mytitle,xlab='time',ylab='value')
par(op)
dev.off()
bitmap(file='pic1.png')
racf <- acf(x, par1, main='Autocorrelation', xlab='time lag', ylab='ACF', ci.type=par6, ci=par7, sub=mysub)
dev.off()
bitmap(file='pic2.png')
rpacf <- pacf(x,par1,main='Partial Autocorrelation',xlab='lags',ylab='PACF',sub=mysub)
dev.off()
(myacf <- c(racf$acf))
(mypacf <- c(rpacf$acf))
lengthx <- length(x)
sqrtn <- sqrt(lengthx)
load(file='createtable')
a<-table.start()
a<-table.row.start(a)
a<-table.element(a,'Autocorrelation Function',4,TRUE)
a<-table.row.end(a)
a<-table.row.start(a)
a<-table.element(a,'Time lag k',header=TRUE)
a<-table.element(a,hyperlink('basics.htm','ACF(k)','click here for more information about the Autocorrelation Function'),header=TRUE)
a<-table.element(a,'T-STAT',header=TRUE)
a<-table.element(a,'P-value',header=TRUE)
a<-table.row.end(a)
for (i in 2:(par1+1)) {
a<-table.row.start(a)
a<-table.element(a,i-1,header=TRUE)
a<-table.element(a,round(myacf[i],6))
mytstat <- myacf[i]*sqrtn
a<-table.element(a,round(mytstat,4))
a<-table.element(a,round(1-pt(abs(mytstat),lengthx),6))
a<-table.row.end(a)
}
a<-table.end(a)
table.save(a,file='mytable.tab')
a<-table.start()
a<-table.row.start(a)
a<-table.element(a,'Partial Autocorrelation Function',4,TRUE)
a<-table.row.end(a)
a<-table.row.start(a)
a<-table.element(a,'Time lag k',header=TRUE)
a<-table.element(a,hyperlink('basics.htm','PACF(k)','click here for more information about the Partial Autocorrelation Function'),header=TRUE)
a<-table.element(a,'T-STAT',header=TRUE)
a<-table.element(a,'P-value',header=TRUE)
a<-table.row.end(a)
for (i in 1:par1) {
a<-table.row.start(a)
a<-table.element(a,i,header=TRUE)
a<-table.element(a,round(mypacf[i],6))
mytstat <- mypacf[i]*sqrtn
a<-table.element(a,round(mytstat,4))
a<-table.element(a,round(1-pt(abs(mytstat),lengthx),6))
a<-table.row.end(a)
}
a<-table.end(a)
table.save(a,file='mytable1.tab')