Free Statistics
of Irreproducible Research!
Description of Statistical Computation | ||||||||||||||||||||||||||||||
|---|---|---|---|---|---|---|---|---|---|---|---|---|---|---|---|---|---|---|---|---|---|---|---|---|---|---|---|---|---|---|
| Author's title | ||||||||||||||||||||||||||||||
| Author | *The author of this computation has been verified* | |||||||||||||||||||||||||||||
| R Software Module | rwasp_Distributional Plots.wasp | |||||||||||||||||||||||||||||
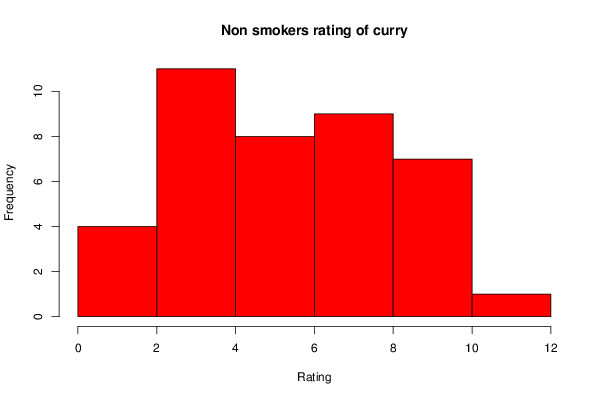
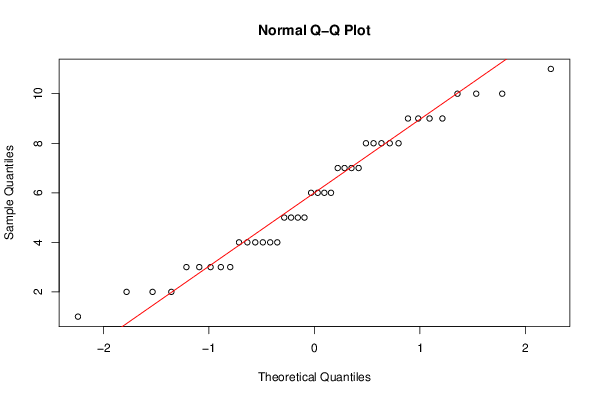
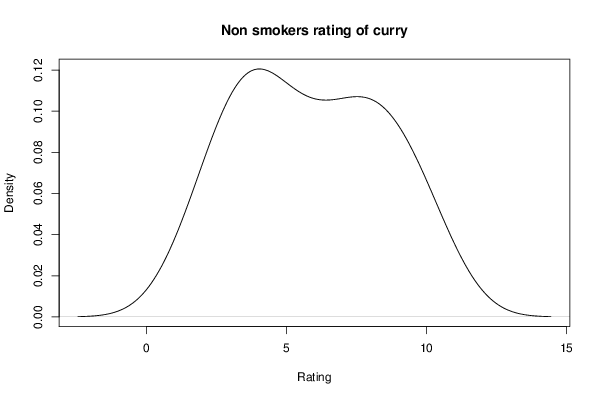
| Title produced by software | Histogram, QQplot and Density | |||||||||||||||||||||||||||||
| Date of computation | Thu, 20 Nov 2014 11:45:46 +0000 | |||||||||||||||||||||||||||||
| Cite this page as follows | Statistical Computations at FreeStatistics.org, Office for Research Development and Education, URL https://freestatistics.org/blog/index.php?v=date/2014/Nov/20/t1416483967laigxr63pgr3art.htm/, Retrieved Fri, 17 May 2024 03:03:47 +0000 | |||||||||||||||||||||||||||||
| Statistical Computations at FreeStatistics.org, Office for Research Development and Education, URL https://freestatistics.org/blog/index.php?pk=256867, Retrieved Fri, 17 May 2024 03:03:47 +0000 | ||||||||||||||||||||||||||||||
| QR Codes: | ||||||||||||||||||||||||||||||
|
| ||||||||||||||||||||||||||||||
| Original text written by user: | ||||||||||||||||||||||||||||||
| IsPrivate? | No (this computation is public) | |||||||||||||||||||||||||||||
| User-defined keywords | ||||||||||||||||||||||||||||||
| Estimated Impact | 245 | |||||||||||||||||||||||||||||
Tree of Dependent Computations | ||||||||||||||||||||||||||||||
| Family? (F = Feedback message, R = changed R code, M = changed R Module, P = changed Parameters, D = changed Data) | ||||||||||||||||||||||||||||||
| - [Histogram, QQplot and Density] [] [2014-10-11 09:05:01] [32b17a345b130fdf5cc88718ed94a974] - R PD [Histogram, QQplot and Density] [] [2014-11-20 11:43:29] [1623cb6a7da2ab006b6e736b8a35c23a] - [Histogram, QQplot and Density] [] [2014-11-20 11:44:59] [1623cb6a7da2ab006b6e736b8a35c23a] - D [Histogram, QQplot and Density] [] [2014-11-20 11:45:46] [57ec79185935c82cc872f3c7a0a6d7ea] [Current] - R D [Histogram, QQplot and Density] [workshop 6 histog...] [2014-11-22 18:06:21] [d83283e7c42ef05cd3465b9a9fb48224] - R D [Histogram, QQplot and Density] [week 6 smokers ha...] [2014-11-23 16:14:10] [d83283e7c42ef05cd3465b9a9fb48224] - D [Histogram, QQplot and Density] [week 6 NON smoker...] [2014-11-23 16:26:27] [d83283e7c42ef05cd3465b9a9fb48224] - [Histogram, QQplot and Density] [week 6 NON smoker...] [2014-11-23 16:28:50] [d83283e7c42ef05cd3465b9a9fb48224] - D [Histogram, QQplot and Density] [week 6 non smoker...] [2014-11-23 16:32:56] [d83283e7c42ef05cd3465b9a9fb48224] - R D [Histogram, QQplot and Density] [WORKSHOP 6 SMOKER...] [2014-11-22 18:10:56] [d83283e7c42ef05cd3465b9a9fb48224] - D [Histogram, QQplot and Density] [SMOKER - HOT CURR...] [2014-11-24 10:19:02] [6656361aa4da5489a6a45e803df0211c] - P [Histogram, QQplot and Density] [SMOKER - HOT CURR...] [2014-11-24 10:41:19] [6656361aa4da5489a6a45e803df0211c] - RMPD [Two-Way ANOVA] [] [2014-11-24 10:49:02] [6656361aa4da5489a6a45e803df0211c] - RMPD [Histogram, QQplot and Density] [SMOKER - HOT CURR...] [2014-11-24 13:47:58] [6656361aa4da5489a6a45e803df0211c] - R PD [Histogram, QQplot and Density] [SMOKER - MILD CUR...] [2014-11-24 14:31:10] [6656361aa4da5489a6a45e803df0211c] - R P [Histogram, QQplot and Density] [SMOKER - HOT CURR...] [2014-11-24 14:37:17] [6656361aa4da5489a6a45e803df0211c] - R PD [Histogram, QQplot and Density] [Non Smoker - Hot ...] [2014-11-24 14:55:58] [6656361aa4da5489a6a45e803df0211c] - R PD [Histogram, QQplot and Density] [Non Smoker - Mild...] [2014-11-24 14:58:59] [6656361aa4da5489a6a45e803df0211c] - M [Histogram, QQplot and Density] [] [2014-11-24 12:05:20] [9e78a33cfd0d318245c909bb3241df60] - P [Histogram, QQplot and Density] [] [2014-11-24 12:09:29] [9e78a33cfd0d318245c909bb3241df60] - D [Histogram, QQplot and Density] [Smokers Rating of...] [2014-11-24 12:10:50] [e643f6f9b1cb49e4bd6b31415fe20a88] - D [Histogram, QQplot and Density] [Smokers Rating of...] [2014-11-24 13:58:28] [e643f6f9b1cb49e4bd6b31415fe20a88] - D [Histogram, QQplot and Density] [Smokers Rating of...] [2014-11-24 14:09:09] [e643f6f9b1cb49e4bd6b31415fe20a88] - D [Histogram, QQplot and Density] [Non-Smokers Ratin...] [2014-11-24 14:34:47] [e643f6f9b1cb49e4bd6b31415fe20a88] - D [Histogram, QQplot and Density] [Non-Smokers Ratin...] [2014-11-24 14:43:23] [e643f6f9b1cb49e4bd6b31415fe20a88] - R D [Histogram, QQplot and Density] [] [2014-11-24 15:56:01] [065f2ce24b7242ee706ada6599db10c1] - D [Histogram, QQplot and Density] [] [2014-11-24 15:56:19] [4ebde75f4b131559f0dbc4c474190771] - PD [Histogram, QQplot and Density] [] [2014-12-01 13:16:39] [4ebde75f4b131559f0dbc4c474190771] - D [Histogram, QQplot and Density] [] [2014-12-01 13:19:42] [4ebde75f4b131559f0dbc4c474190771] - D [Histogram, QQplot and Density] [] [2014-12-01 15:42:48] [4ebde75f4b131559f0dbc4c474190771] - R D [Histogram, QQplot and Density] [] [2014-11-24 15:57:17] [065f2ce24b7242ee706ada6599db10c1] - R [Histogram, QQplot and Density] [] [2014-11-24 19:08:49] [065f2ce24b7242ee706ada6599db10c1] - R D [Histogram, QQplot and Density] [] [2014-11-24 15:59:20] [065f2ce24b7242ee706ada6599db10c1] - R D [Histogram, QQplot and Density] [] [2014-11-24 16:01:09] [065f2ce24b7242ee706ada6599db10c1] - D [Histogram, QQplot and Density] [] [2014-11-24 16:03:12] [4ebde75f4b131559f0dbc4c474190771] - D [Histogram, QQplot and Density] [] [2014-11-24 16:07:45] [4ebde75f4b131559f0dbc4c474190771] - D [Histogram, QQplot and Density] [] [2014-11-24 16:11:21] [4ebde75f4b131559f0dbc4c474190771] - D [Histogram, QQplot and Density] [] [2014-11-24 18:08:47] [55390d930ddef326252ef8d720837dd8] - M [Histogram, QQplot and Density] [] [2014-11-24 18:26:49] [55390d930ddef326252ef8d720837dd8] - M [Histogram, QQplot and Density] [] [2014-11-24 18:29:16] [55390d930ddef326252ef8d720837dd8] - D [Histogram, QQplot and Density] [Smokers rating of...] [2014-11-24 20:00:32] [a30ebaf79f34e9d2b1bcdd5006125d11] - D [Histogram, QQplot and Density] [Rating for vindaloo] [2014-11-24 20:14:51] [a30ebaf79f34e9d2b1bcdd5006125d11] - D [Histogram, QQplot and Density] [Rating for korma] [2014-11-24 20:16:50] [a30ebaf79f34e9d2b1bcdd5006125d11] - P [Histogram, QQplot and Density] [] [2014-11-24 20:08:58] [9e78a33cfd0d318245c909bb3241df60] - P [Histogram, QQplot and Density] [] [2014-11-24 20:30:50] [9e78a33cfd0d318245c909bb3241df60] - D [Histogram, QQplot and Density] [NS Hot] [2014-11-24 20:56:39] [a30ebaf79f34e9d2b1bcdd5006125d11] - R PD [Histogram, QQplot and Density] [SMK Hot] [2014-11-24 20:59:22] [a30ebaf79f34e9d2b1bcdd5006125d11] - D [Histogram, QQplot and Density] [NS Mild] [2014-11-24 21:00:45] [a30ebaf79f34e9d2b1bcdd5006125d11] - D [Histogram, QQplot and Density] [SMK Mild] [2014-11-24 21:01:48] [a30ebaf79f34e9d2b1bcdd5006125d11] - M [Histogram, QQplot and Density] [Non smokers curry...] [2014-11-24 21:33:20] [4c83486c224a1afaff7c2345853f7269] - D [Histogram, QQplot and Density] [Histogram, Spicy ...] [2014-11-24 22:13:43] [6364ae91f0429f232727db7a674b7e85] - M [Histogram, QQplot and Density] [Histogram] [2014-11-24 22:45:51] [c55b6d1de341389e613137950ff051f5] [Truncated] | ||||||||||||||||||||||||||||||
| Feedback Forum | ||||||||||||||||||||||||||||||
Post a new message | ||||||||||||||||||||||||||||||
Dataset | ||||||||||||||||||||||||||||||
| Dataseries X: | ||||||||||||||||||||||||||||||
8 9 10 7 8 9 10 6 6 7 8 9 8 7 5 11 7 8 10 9 3 5 4 2 6 1 4 4 5 4 3 3 4 3 2 5 4 3 6 2 | ||||||||||||||||||||||||||||||
Tables (Output of Computation) | ||||||||||||||||||||||||||||||
| ||||||||||||||||||||||||||||||
Figures (Output of Computation) | ||||||||||||||||||||||||||||||
Input Parameters & R Code | ||||||||||||||||||||||||||||||
| Parameters (Session): | ||||||||||||||||||||||||||||||
| par1 = 5 ; | ||||||||||||||||||||||||||||||
| Parameters (R input): | ||||||||||||||||||||||||||||||
| par1 = 5 ; | ||||||||||||||||||||||||||||||
| R code (references can be found in the software module): | ||||||||||||||||||||||||||||||
x <- x[!is.na(x)] | ||||||||||||||||||||||||||||||