Free Statistics

of Irreproducible Research!

Author's title

Author*Unverified author*
R Software Modulerwasp_correlation.wasp
Title produced by softwarePearson Correlation
Date of computationTue, 16 Sep 2014 02:19:01 +0100
Cite this page as followsStatistical Computations at FreeStatistics.org, Office for Research Development and Education, URL https://freestatistics.org/blog/index.php?v=date/2014/Sep/16/t1410830406apzsepn651qq4ne.htm/, Retrieved Mon, 13 May 2024 20:16:12 +0000
Statistical Computations at FreeStatistics.org, Office for Research Development and Education, URL https://freestatistics.org/blog/index.php?pk=235801, Retrieved Mon, 13 May 2024 20:16:12 +0000
QR Codes:

Original text written by user:
IsPrivate?No (this computation is public)
User-defined keywords
Estimated Impact249
Family? (F = Feedback message, R = changed R code, M = changed R Module, P = changed Parameters, D = changed Data)
-       [Pearson Correlation] [Senate Republcans...] [2014-09-16 01:19:01] [d41d8cd98f00b204e9800998ecf8427e] [Current]
Feedback Forum

Post a new message
Dataseries X:
24
24
29
29
40
40
40
40
53
53
44
44
49
49
50
50
49
49
49
49
35
35
36
36
33
33
32
32
36
36
42
42
44
44
42
42
37
37
38
38
41
41
53
53
54
54
53
53
45
45
45
45
44
44
43
43
52
52
55
55
55
55
50
49
51
51
55
55
49
49
40
40
47
47
45
45
Dataseries Y:
26617
28070
32723
35174
36395
35646
34332
36962
38440
39385
37637
40001
41490
42205
43733
41933
44088
45179
45369
43219
45153
45799
45534
46775
47542
48887
50957
53501
54552
56286
58633
58222
58329
60608
63262
64291
62285
64697
67746
71590
74068
73687
75456
73434
74116
78810
81223
82787
85246
88126
90126
91156
89741
90047
92184
95596
98215
100698
103475
106592
109203
111400
110802
108975
108592
110291
112615
114659
115742
114595
107864
107933
110024
112336
114783
117221


Summary of computational transaction
Raw Inputview raw input (R code)
Raw Outputview raw output of R engine
Computing time2 seconds
R Server'Sir Maurice George Kendall' @ kendall.wessa.net

\begin{tabular}{lllllllll}
\hline
Summary of computational transaction \tabularnewline
Raw Input & view raw input (R code)  \tabularnewline
Raw Output & view raw output of R engine  \tabularnewline
Computing time & 2 seconds \tabularnewline
R Server & 'Sir Maurice George Kendall' @ kendall.wessa.net \tabularnewline
\hline
\end{tabular}
%Source: https://freestatistics.org/blog/index.php?pk=235801&T=0

[TABLE]
[ROW][C]Summary of computational transaction[/C][/ROW]
[ROW][C]Raw Input[/C][C]view raw input (R code) [/C][/ROW]
[ROW][C]Raw Output[/C][C]view raw output of R engine [/C][/ROW]
[ROW][C]Computing time[/C][C]2 seconds[/C][/ROW]
[ROW][C]R Server[/C][C]'Sir Maurice George Kendall' @ kendall.wessa.net[/C][/ROW]
[/TABLE]
Source: https://freestatistics.org/blog/index.php?pk=235801&T=0

Globally Unique Identifier (entire table): ba.freestatistics.org/blog/index.php?pk=235801&T=0

As an alternative you can also use a QR Code:  

The GUIDs for individual cells are displayed in the table below:

Summary of computational transaction
Raw Inputview raw input (R code)
Raw Outputview raw output of R engine
Computing time2 seconds
R Server'Sir Maurice George Kendall' @ kendall.wessa.net


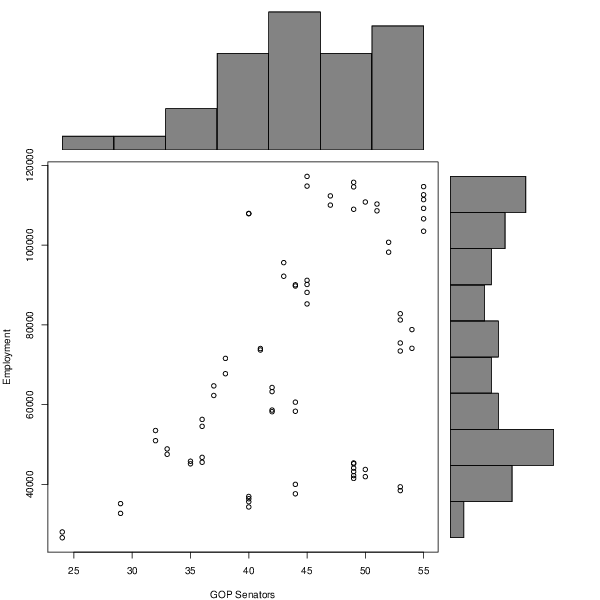
Pearson Product Moment Correlation - Ungrouped Data
StatisticVariable XVariable Y
Mean44.171052631578971382.4342105263
Biased Variance59.1154778393352806465599.640409
Biased Standard Deviation7.6886590403876828398.3379732056
Covariance116854.738070175
Correlation0.528141715400146
Determination0.278933671545809
T-Test5.35030726043365
p-value (2 sided)9.42922304014715e-07
p-value (1 sided)4.71461152007357e-07
Degrees of Freedom74
Number of Observations76

\begin{tabular}{lllllllll}
\hline
Pearson Product Moment Correlation - Ungrouped Data \tabularnewline
Statistic & Variable X & Variable Y \tabularnewline
Mean & 44.1710526315789 & 71382.4342105263 \tabularnewline
Biased Variance & 59.1154778393352 & 806465599.640409 \tabularnewline
Biased Standard Deviation & 7.68865904038768 & 28398.3379732056 \tabularnewline
Covariance & 116854.738070175 \tabularnewline
Correlation & 0.528141715400146 \tabularnewline
Determination & 0.278933671545809 \tabularnewline
T-Test & 5.35030726043365 \tabularnewline
p-value (2 sided) & 9.42922304014715e-07 \tabularnewline
p-value (1 sided) & 4.71461152007357e-07 \tabularnewline
Degrees of Freedom & 74 \tabularnewline
Number of Observations & 76 \tabularnewline
\hline
\end{tabular}
%Source: https://freestatistics.org/blog/index.php?pk=235801&T=1

[TABLE]
[ROW][C]Pearson Product Moment Correlation - Ungrouped Data[/C][/ROW]
[ROW][C]Statistic[/C][C]Variable X[/C][C]Variable Y[/C][/ROW]
[ROW][C]Mean[/C][C]44.1710526315789[/C][C]71382.4342105263[/C][/ROW]
[ROW][C]Biased Variance[/C][C]59.1154778393352[/C][C]806465599.640409[/C][/ROW]
[ROW][C]Biased Standard Deviation[/C][C]7.68865904038768[/C][C]28398.3379732056[/C][/ROW]
[ROW][C]Covariance[/C][C]116854.738070175[/C][/ROW]
[ROW][C]Correlation[/C][C]0.528141715400146[/C][/ROW]
[ROW][C]Determination[/C][C]0.278933671545809[/C][/ROW]
[ROW][C]T-Test[/C][C]5.35030726043365[/C][/ROW]
[ROW][C]p-value (2 sided)[/C][C]9.42922304014715e-07[/C][/ROW]
[ROW][C]p-value (1 sided)[/C][C]4.71461152007357e-07[/C][/ROW]
[ROW][C]Degrees of Freedom[/C][C]74[/C][/ROW]
[ROW][C]Number of Observations[/C][C]76[/C][/ROW]
[/TABLE]
Source: https://freestatistics.org/blog/index.php?pk=235801&T=1

Globally Unique Identifier (entire table): ba.freestatistics.org/blog/index.php?pk=235801&T=1

As an alternative you can also use a QR Code:  

The GUIDs for individual cells are displayed in the table below:

Pearson Product Moment Correlation - Ungrouped Data
StatisticVariable XVariable Y
Mean44.171052631578971382.4342105263
Biased Variance59.1154778393352806465599.640409
Biased Standard Deviation7.6886590403876828398.3379732056
Covariance116854.738070175
Correlation0.528141715400146
Determination0.278933671545809
T-Test5.35030726043365
p-value (2 sided)9.42922304014715e-07
p-value (1 sided)4.71461152007357e-07
Degrees of Freedom74
Number of Observations76


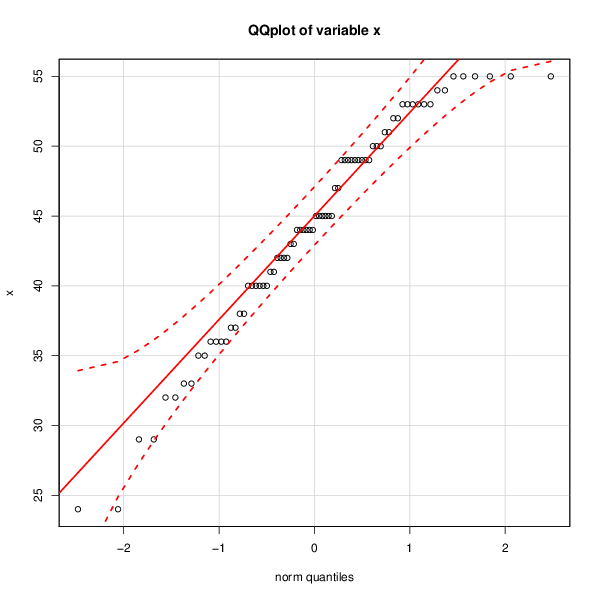
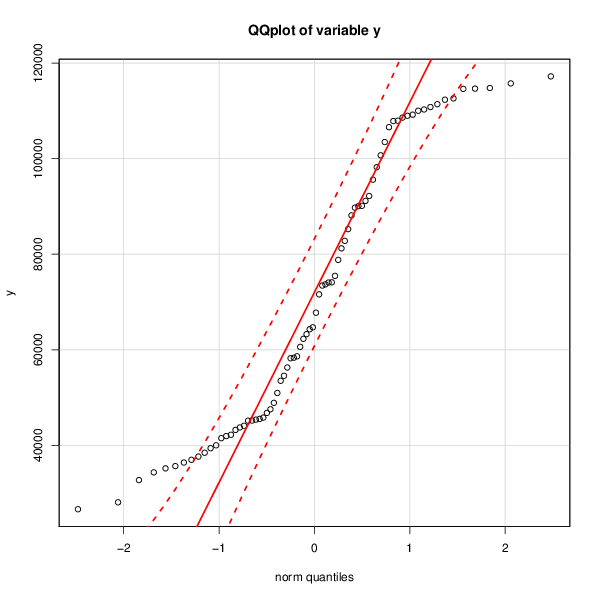
Normality Tests
> jarque.x
	Jarque-Bera Normality Test
data:  x
JB = 3.9011, p-value = 0.1422
alternative hypothesis: greater
> jarque.y
	Jarque-Bera Normality Test
data:  y
JB = 6.7767, p-value = 0.03377
alternative hypothesis: greater
> ad.x
	Anderson-Darling normality test
data:  x
A = 0.8273, p-value = 0.03129
> ad.y
	Anderson-Darling normality test
data:  y
A = 2.2048, p-value = 1.2e-05

\begin{tabular}{lllllllll}
\hline
Normality Tests \tabularnewline
> jarque.x
	Jarque-Bera Normality Test
data:  x
JB = 3.9011, p-value = 0.1422
alternative hypothesis: greater
\tabularnewline
> jarque.y
	Jarque-Bera Normality Test
data:  y
JB = 6.7767, p-value = 0.03377
alternative hypothesis: greater
\tabularnewline
> ad.x
	Anderson-Darling normality test
data:  x
A = 0.8273, p-value = 0.03129
\tabularnewline
> ad.y
	Anderson-Darling normality test
data:  y
A = 2.2048, p-value = 1.2e-05
\tabularnewline \hline \end{tabular} %Source: https://freestatistics.org/blog/index.php?pk=235801&T=2

[TABLE]
[ROW][C]Normality Tests[/C][/ROW]
[ROW][C]
> jarque.x
	Jarque-Bera Normality Test
data:  x
JB = 3.9011, p-value = 0.1422
alternative hypothesis: greater
[/C][/ROW] [ROW][C]
> jarque.y
	Jarque-Bera Normality Test
data:  y
JB = 6.7767, p-value = 0.03377
alternative hypothesis: greater
[/C][/ROW] [ROW][C]
> ad.x
	Anderson-Darling normality test
data:  x
A = 0.8273, p-value = 0.03129
[/C][/ROW] [ROW][C]
> ad.y
	Anderson-Darling normality test
data:  y
A = 2.2048, p-value = 1.2e-05
[/C][/ROW] [/TABLE] Source: https://freestatistics.org/blog/index.php?pk=235801&T=2

Globally Unique Identifier (entire table): ba.freestatistics.org/blog/index.php?pk=235801&T=2

As an alternative you can also use a QR Code:  

The GUIDs for individual cells are displayed in the table below:

Normality Tests
> jarque.x
	Jarque-Bera Normality Test
data:  x
JB = 3.9011, p-value = 0.1422
alternative hypothesis: greater
> jarque.y
	Jarque-Bera Normality Test
data:  y
JB = 6.7767, p-value = 0.03377
alternative hypothesis: greater
> ad.x
	Anderson-Darling normality test
data:  x
A = 0.8273, p-value = 0.03129
> ad.y
	Anderson-Darling normality test
data:  y
A = 2.2048, p-value = 1.2e-05


Parameters (Session):
Parameters (R input):
R code (references can be found in the software module):
x <- x[!is.na(y)]
y <- y[!is.na(y)]
y <- y[!is.na(x)]
x <- x[!is.na(x)]
bitmap(file='test1.png')
histx <- hist(x, plot=FALSE)
histy <- hist(y, plot=FALSE)
maxcounts <- max(c(histx$counts, histx$counts))
xrange <- c(min(x),max(x))
yrange <- c(min(y),max(y))
nf <- layout(matrix(c(2,0,1,3),2,2,byrow=TRUE), c(3,1), c(1,3), TRUE)
par(mar=c(4,4,1,1))
plot(x, y, xlim=xrange, ylim=yrange, xlab=xlab, ylab=ylab, sub=main)
par(mar=c(0,4,1,1))
barplot(histx$counts, axes=FALSE, ylim=c(0, maxcounts), space=0)
par(mar=c(4,0,1,1))
barplot(histy$counts, axes=FALSE, xlim=c(0, maxcounts), space=0, horiz=TRUE)
dev.off()
lx = length(x)
makebiased = (lx-1)/lx
varx = var(x)*makebiased
vary = var(y)*makebiased
corxy <- cor.test(x,y,method='pearson', na.rm = T)
cxy <- as.matrix(corxy$estimate)[1,1]
load(file='createtable')
a<-table.start()
a<-table.row.start(a)
a<-table.element(a,'Pearson Product Moment Correlation - Ungrouped Data',3,TRUE)
a<-table.row.end(a)
a<-table.row.start(a)
a<-table.element(a,'Statistic',1,TRUE)
a<-table.element(a,'Variable X',1,TRUE)
a<-table.element(a,'Variable Y',1,TRUE)
a<-table.row.end(a)
a<-table.row.start(a)
a<-table.element(a,hyperlink('arithmetic_mean.htm','Mean',''),header=TRUE)
a<-table.element(a,mean(x))
a<-table.element(a,mean(y))
a<-table.row.end(a)
a<-table.row.start(a)
a<-table.element(a,hyperlink('biased.htm','Biased Variance',''),header=TRUE)
a<-table.element(a,varx)
a<-table.element(a,vary)
a<-table.row.end(a)
a<-table.row.start(a)
a<-table.element(a,hyperlink('biased1.htm','Biased Standard Deviation',''),header=TRUE)
a<-table.element(a,sqrt(varx))
a<-table.element(a,sqrt(vary))
a<-table.row.end(a)
a<-table.row.start(a)
a<-table.element(a,hyperlink('covariance.htm','Covariance',''),header=TRUE)
a<-table.element(a,cov(x,y),2)
a<-table.row.end(a)
a<-table.row.start(a)
a<-table.element(a,hyperlink('pearson_correlation.htm','Correlation',''),header=TRUE)
a<-table.element(a,cxy,2)
a<-table.row.end(a)
a<-table.row.start(a)
a<-table.element(a,hyperlink('coeff_of_determination.htm','Determination',''),header=TRUE)
a<-table.element(a,cxy*cxy,2)
a<-table.row.end(a)
a<-table.row.start(a)
a<-table.element(a,hyperlink('ttest_statistic.htm','T-Test',''),header=TRUE)
a<-table.element(a,as.matrix(corxy$statistic)[1,1],2)
a<-table.row.end(a)
a<-table.row.start(a)
a<-table.element(a,'p-value (2 sided)',header=TRUE)
a<-table.element(a,(p2 <- as.matrix(corxy$p.value)[1,1]),2)
a<-table.row.end(a)
a<-table.row.start(a)
a<-table.element(a,'p-value (1 sided)',header=TRUE)
a<-table.element(a,p2/2,2)
a<-table.row.end(a)
a<-table.row.start(a)
a<-table.element(a,'Degrees of Freedom',header=TRUE)
a<-table.element(a,lx-2,2)
a<-table.row.end(a)
a<-table.row.start(a)
a<-table.element(a,'Number of Observations',header=TRUE)
a<-table.element(a,lx,2)
a<-table.row.end(a)
a<-table.end(a)
table.save(a,file='mytable.tab')
library(moments)
library(nortest)
jarque.x <- jarque.test(x)
jarque.y <- jarque.test(y)
if(lx>7) {
ad.x <- ad.test(x)
ad.y <- ad.test(y)
}
a<-table.start()
a<-table.row.start(a)
a<-table.element(a,'Normality Tests',1,TRUE)
a<-table.row.end(a)
a<-table.row.start(a)
a<-table.element(a,paste('
',RC.texteval('jarque.x'),'
',sep=''))
a<-table.row.end(a)
a<-table.row.start(a)
a<-table.element(a,paste('
',RC.texteval('jarque.y'),'
',sep=''))
a<-table.row.end(a)
if(lx>7) {
a<-table.row.start(a)
a<-table.element(a,paste('
',RC.texteval('ad.x'),'
',sep=''))
a<-table.row.end(a)
a<-table.row.start(a)
a<-table.element(a,paste('
',RC.texteval('ad.y'),'
',sep=''))
a<-table.row.end(a)
}
a<-table.end(a)
table.save(a,file='mytable1.tab')
library(car)
bitmap(file='test2.png')
qq.plot(x,main='QQplot of variable x')
dev.off()
bitmap(file='test3.png')
qq.plot(y,main='QQplot of variable y')
dev.off()