Free Statistics
of Irreproducible Research!
Description of Statistical Computation | |||||||||||||||||||||||||||||||||||||||||
|---|---|---|---|---|---|---|---|---|---|---|---|---|---|---|---|---|---|---|---|---|---|---|---|---|---|---|---|---|---|---|---|---|---|---|---|---|---|---|---|---|---|
| Author's title | |||||||||||||||||||||||||||||||||||||||||
| Author | *Unverified author* | ||||||||||||||||||||||||||||||||||||||||
| R Software Module | rwasp_univariatedataseries.wasp | ||||||||||||||||||||||||||||||||||||||||
| Title produced by software | Univariate Data Series | ||||||||||||||||||||||||||||||||||||||||
| Date of computation | Thu, 18 Sep 2014 17:54:54 +0100 | ||||||||||||||||||||||||||||||||||||||||
| Cite this page as follows | Statistical Computations at FreeStatistics.org, Office for Research Development and Education, URL https://freestatistics.org/blog/index.php?v=date/2014/Sep/18/t1411065409prx3c73d9evby9c.htm/, Retrieved Mon, 13 May 2024 11:13:10 +0000 | ||||||||||||||||||||||||||||||||||||||||
| Statistical Computations at FreeStatistics.org, Office for Research Development and Education, URL https://freestatistics.org/blog/index.php?pk=235862, Retrieved Mon, 13 May 2024 11:13:10 +0000 | |||||||||||||||||||||||||||||||||||||||||
| QR Codes: | |||||||||||||||||||||||||||||||||||||||||
|
| |||||||||||||||||||||||||||||||||||||||||
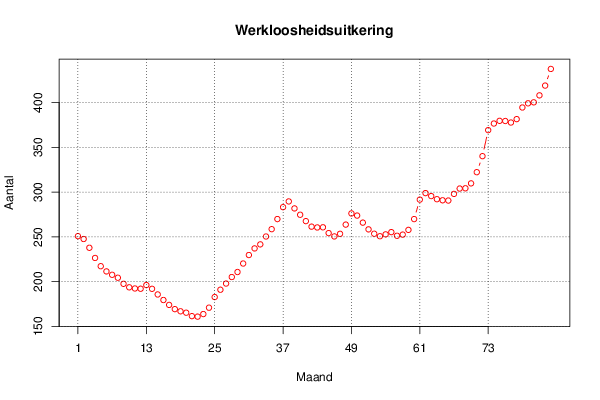
| Original text written by user: | Ik koos voor deze grafiek omdat werkloosheid me kan interesseren. Zelf vraag ik me af waarom iemand werkloos is en hoeveel personen er op een bepaalde moment werkloos zijn. Hierop wilde ik antwoorden dus zocht ik de juiste grafiek. | ||||||||||||||||||||||||||||||||||||||||
| IsPrivate? | No (this computation is public) | ||||||||||||||||||||||||||||||||||||||||
| User-defined keywords | |||||||||||||||||||||||||||||||||||||||||
| Estimated Impact | 127 | ||||||||||||||||||||||||||||||||||||||||
Tree of Dependent Computations | |||||||||||||||||||||||||||||||||||||||||
| Family? (F = Feedback message, R = changed R code, M = changed R Module, P = changed Parameters, D = changed Data) | |||||||||||||||||||||||||||||||||||||||||
| - [Univariate Data Series] [Werkloosheid niet...] [2014-09-18 16:54:54] [d41d8cd98f00b204e9800998ecf8427e] [Current] | |||||||||||||||||||||||||||||||||||||||||
| Feedback Forum | |||||||||||||||||||||||||||||||||||||||||
Post a new message | |||||||||||||||||||||||||||||||||||||||||
Dataset | |||||||||||||||||||||||||||||||||||||||||
| Dataseries X: | |||||||||||||||||||||||||||||||||||||||||
250.8 247.6 237.8 226.4 217.2 211.4 207.6 204.3 197.5 193.6 192.3 192 196.1 191.9 185.6 179.4 173.9 169.2 166.8 165.2 161.4 160.8 163.7 170.8 182.7 190.9 197.8 205.1 210.7 220.2 229.7 237.1 241.6 250.4 258.6 269.9 283.2 289.6 281.8 274.7 267.6 261.4 260.5 260.7 254.2 250.5 253.4 263.7 276.2 273.8 265.9 258.4 253.5 250.7 252.8 255.3 251.2 252.5 257.8 269.9 291.6 298.9 295.6 292.1 290.9 290.6 298 304 304.3 309.8 322.3 340.2 369.3 376.7 379.7 379.5 377.8 381.6 394.6 399.3 400.4 408.2 419.1 437.7 | |||||||||||||||||||||||||||||||||||||||||
Tables (Output of Computation) | |||||||||||||||||||||||||||||||||||||||||
| |||||||||||||||||||||||||||||||||||||||||
Figures (Output of Computation) | |||||||||||||||||||||||||||||||||||||||||
Input Parameters & R Code | |||||||||||||||||||||||||||||||||||||||||
| Parameters (Session): | |||||||||||||||||||||||||||||||||||||||||
| par1 = Werkloosheidsuitkeringen Niet-seizoengecorrigeerd ; par2 = centraal bureau voor de statistiek ; par3 = Sociale zekerheid ; par4 = 12 ; | |||||||||||||||||||||||||||||||||||||||||
| Parameters (R input): | |||||||||||||||||||||||||||||||||||||||||
| par1 = Werkloosheidsuitkeringen Niet-seizoengecorrigeerd ; par2 = centraal bureau voor de statistiek ; par3 = Sociale zekerheid ; par4 = 12 ; | |||||||||||||||||||||||||||||||||||||||||
| R code (references can be found in the software module): | |||||||||||||||||||||||||||||||||||||||||
par4 <- '12' | |||||||||||||||||||||||||||||||||||||||||