Free Statistics
of Irreproducible Research!
Description of Statistical Computation | |||||||||||||||||||||||||||||||||||||||||
|---|---|---|---|---|---|---|---|---|---|---|---|---|---|---|---|---|---|---|---|---|---|---|---|---|---|---|---|---|---|---|---|---|---|---|---|---|---|---|---|---|---|
| Author's title | |||||||||||||||||||||||||||||||||||||||||
| Author | *Unverified author* | ||||||||||||||||||||||||||||||||||||||||
| R Software Module | rwasp_univariatedataseries.wasp | ||||||||||||||||||||||||||||||||||||||||
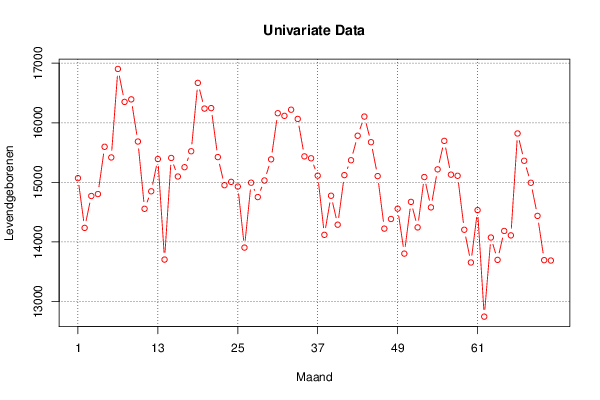
| Title produced by software | Univariate Data Series | ||||||||||||||||||||||||||||||||||||||||
| Date of computation | Fri, 19 Sep 2014 09:35:36 +0100 | ||||||||||||||||||||||||||||||||||||||||
| Cite this page as follows | Statistical Computations at FreeStatistics.org, Office for Research Development and Education, URL https://freestatistics.org/blog/index.php?v=date/2014/Sep/19/t1411115957q889z4iln5c5da9.htm/, Retrieved Sun, 12 May 2024 16:51:19 +0000 | ||||||||||||||||||||||||||||||||||||||||
| Statistical Computations at FreeStatistics.org, Office for Research Development and Education, URL https://freestatistics.org/blog/index.php?pk=235870, Retrieved Sun, 12 May 2024 16:51:19 +0000 | |||||||||||||||||||||||||||||||||||||||||
| QR Codes: | |||||||||||||||||||||||||||||||||||||||||
|
| |||||||||||||||||||||||||||||||||||||||||
| Original text written by user: | |||||||||||||||||||||||||||||||||||||||||
| IsPrivate? | No (this computation is public) | ||||||||||||||||||||||||||||||||||||||||
| User-defined keywords | |||||||||||||||||||||||||||||||||||||||||
| Estimated Impact | 129 | ||||||||||||||||||||||||||||||||||||||||
Tree of Dependent Computations | |||||||||||||||||||||||||||||||||||||||||
| Family? (F = Feedback message, R = changed R code, M = changed R Module, P = changed Parameters, D = changed Data) | |||||||||||||||||||||||||||||||||||||||||
| - [Univariate Data Series] [Datareeks - aanta...] [2014-09-19 08:35:36] [8bdab0fd537d5455eaa21dec7dfb1324] [Current] - RMP [Histogram] [Datareeks - aanta...] [2014-09-26 12:15:08] [8ce78276f6c66aaddbb0f99a7ed09e17] - RMP [Histogram] [Levendgeborenen i...] [2014-09-26 12:38:06] [8ce78276f6c66aaddbb0f99a7ed09e17] - RMP [Histogram] [Levendgeborenen i...] [2014-09-26 12:40:15] [8ce78276f6c66aaddbb0f99a7ed09e17] - RMP [Kernel Density Estimation] [Levendgeborenen i...] [2014-09-26 12:55:15] [8ce78276f6c66aaddbb0f99a7ed09e17] | |||||||||||||||||||||||||||||||||||||||||
| Feedback Forum | |||||||||||||||||||||||||||||||||||||||||
Post a new message | |||||||||||||||||||||||||||||||||||||||||
Dataset | |||||||||||||||||||||||||||||||||||||||||
| Dataseries X: | |||||||||||||||||||||||||||||||||||||||||
15071 14236 14771 14804 15597 15418 16903 16350 16393 15685 14556 14850 15391 13704 15409 15098 15254 15522 16669 16238 16246 15424 14952 15008 14929 13905 14994 14753 15031 15386 16160 16116 16219 16064 15436 15404 15112 14119 14775 14289 15121 15371 15782 16104 15674 15105 14223 14385 14558 13804 14672 14244 15089 14580 15218 15696 15129 15110 14204 13655 14534 12746 14074 13699 14184 14110 15820 15362 14993 14437 13694 13688 | |||||||||||||||||||||||||||||||||||||||||
Tables (Output of Computation) | |||||||||||||||||||||||||||||||||||||||||
| |||||||||||||||||||||||||||||||||||||||||
Figures (Output of Computation) | |||||||||||||||||||||||||||||||||||||||||
Input Parameters & R Code | |||||||||||||||||||||||||||||||||||||||||
| Parameters (Session): | |||||||||||||||||||||||||||||||||||||||||
| par1 = Aantal levendgeborenen in Nederland 2008-2013 ; par3 = Het aantal levendgeborenen in Nederland in de periode 2008-2013 ; par4 = 12 ; | |||||||||||||||||||||||||||||||||||||||||
| Parameters (R input): | |||||||||||||||||||||||||||||||||||||||||
| par1 = Aantal levendgeborenen in Nederland 2008-2013 ; par2 = ; par3 = Het aantal levendgeborenen in Nederland in de periode 2008-2013 ; par4 = 12 ; | |||||||||||||||||||||||||||||||||||||||||
| R code (references can be found in the software module): | |||||||||||||||||||||||||||||||||||||||||
par4 <- '12' | |||||||||||||||||||||||||||||||||||||||||