Free Statistics
of Irreproducible Research!
Description of Statistical Computation | |||||||||||||||||||||||||||||||||||||||||
|---|---|---|---|---|---|---|---|---|---|---|---|---|---|---|---|---|---|---|---|---|---|---|---|---|---|---|---|---|---|---|---|---|---|---|---|---|---|---|---|---|---|
| Author's title | |||||||||||||||||||||||||||||||||||||||||
| Author | *Unverified author* | ||||||||||||||||||||||||||||||||||||||||
| R Software Module | rwasp_univariatedataseries.wasp | ||||||||||||||||||||||||||||||||||||||||
| Title produced by software | Univariate Data Series | ||||||||||||||||||||||||||||||||||||||||
| Date of computation | Sat, 20 Sep 2014 17:06:21 +0100 | ||||||||||||||||||||||||||||||||||||||||
| Cite this page as follows | Statistical Computations at FreeStatistics.org, Office for Research Development and Education, URL https://freestatistics.org/blog/index.php?v=date/2014/Sep/20/t1411229248d69w3yg91johs50.htm/, Retrieved Tue, 14 May 2024 21:24:23 +0000 | ||||||||||||||||||||||||||||||||||||||||
| Statistical Computations at FreeStatistics.org, Office for Research Development and Education, URL https://freestatistics.org/blog/index.php?pk=235958, Retrieved Tue, 14 May 2024 21:24:23 +0000 | |||||||||||||||||||||||||||||||||||||||||
| QR Codes: | |||||||||||||||||||||||||||||||||||||||||
|
| |||||||||||||||||||||||||||||||||||||||||
| Original text written by user: | |||||||||||||||||||||||||||||||||||||||||
| IsPrivate? | No (this computation is public) | ||||||||||||||||||||||||||||||||||||||||
| User-defined keywords | |||||||||||||||||||||||||||||||||||||||||
| Estimated Impact | 169 | ||||||||||||||||||||||||||||||||||||||||
Tree of Dependent Computations | |||||||||||||||||||||||||||||||||||||||||
| Family? (F = Feedback message, R = changed R code, M = changed R Module, P = changed Parameters, D = changed Data) | |||||||||||||||||||||||||||||||||||||||||
| - [Univariate Data Series] [Gemiddelde consum...] [2014-09-20 16:06:21] [1ab96e54865215824aa8065210e49a0c] [Current] - RMP [Histogram] [Gemiddelde consum...] [2014-09-28 09:32:05] [4074bcc0fa614c23b22197ac3940bbd4] - RMP [Histogram] [Gemiddelde consum...] [2014-09-28 10:05:59] [4074bcc0fa614c23b22197ac3940bbd4] - RMP [Histogram] [Gemiddelde consum...] [2014-09-28 10:09:45] [4074bcc0fa614c23b22197ac3940bbd4] - RMP [Kernel Density Estimation] [Gemiddelde consum...] [2014-09-28 10:14:40] [4074bcc0fa614c23b22197ac3940bbd4] | |||||||||||||||||||||||||||||||||||||||||
| Feedback Forum | |||||||||||||||||||||||||||||||||||||||||
Post a new message | |||||||||||||||||||||||||||||||||||||||||
Dataset | |||||||||||||||||||||||||||||||||||||||||
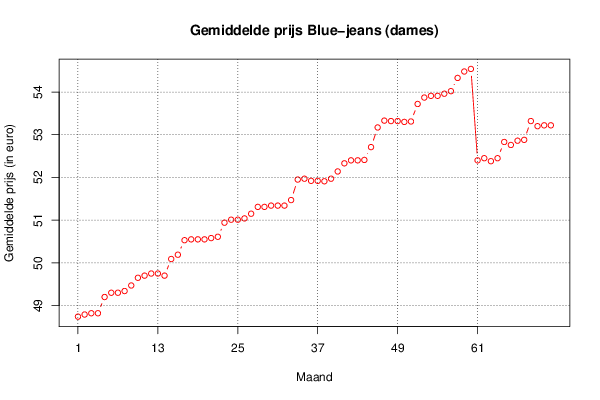
| Dataseries X: | |||||||||||||||||||||||||||||||||||||||||
48.74 48.79 48.82 48.82 49.20 49.30 49.30 49.34 49.47 49.65 49.70 49.75 49.75 49.70 50.09 50.19 50.53 50.55 50.55 50.55 50.58 50.61 50.94 51.01 51.01 51.04 51.15 51.31 51.31 51.34 51.34 51.34 51.47 51.95 51.97 51.92 51.92 51.91 51.97 52.14 52.33 52.40 52.40 52.41 52.71 53.17 53.33 53.32 53.32 53.30 53.31 53.72 53.87 53.91 53.91 53.96 54.02 54.33 54.48 54.54 52.40 52.45 52.38 52.45 52.83 52.76 52.86 52.88 53.32 53.20 53.22 53.22 | |||||||||||||||||||||||||||||||||||||||||
Tables (Output of Computation) | |||||||||||||||||||||||||||||||||||||||||
| |||||||||||||||||||||||||||||||||||||||||
Figures (Output of Computation) | |||||||||||||||||||||||||||||||||||||||||
Input Parameters & R Code | |||||||||||||||||||||||||||||||||||||||||
| Parameters (Session): | |||||||||||||||||||||||||||||||||||||||||
| par1 = Gemiddelde consumptieprijs Blue-jeans (dames) ; par2 = ADSEI ; par3 = Gemiddelde maandelijkse prijs voor een dames jeans ; par4 = 12 ; | |||||||||||||||||||||||||||||||||||||||||
| Parameters (R input): | |||||||||||||||||||||||||||||||||||||||||
| par1 = Gemiddelde consumptieprijs Blue-jeans (dames) ; par2 = ADSEI ; par3 = Gemiddelde maandelijkse prijs voor een dames jeans ; par4 = 12 ; | |||||||||||||||||||||||||||||||||||||||||
| R code (references can be found in the software module): | |||||||||||||||||||||||||||||||||||||||||
par4 <- '12' | |||||||||||||||||||||||||||||||||||||||||