Free Statistics

of Irreproducible Research!

Author's title

Author*Unverified author*
R Software Modulerwasp_univariatedataseries.wasp
Title produced by softwareUnivariate Data Series
Date of computationSat, 20 Sep 2014 18:12:07 +0100
Cite this page as followsStatistical Computations at FreeStatistics.org, Office for Research Development and Education, URL https://freestatistics.org/blog/index.php?v=date/2014/Sep/20/t1411233330a97hlmaacuh3wta.htm/, Retrieved Tue, 14 May 2024 22:16:06 +0000
Statistical Computations at FreeStatistics.org, Office for Research Development and Education, URL https://freestatistics.org/blog/index.php?pk=235961, Retrieved Tue, 14 May 2024 22:16:06 +0000
QR Codes:

Original text written by user:
IsPrivate?No (this computation is public)
User-defined keywords
Estimated Impact147
Family? (F = Feedback message, R = changed R code, M = changed R Module, P = changed Parameters, D = changed Data)
-       [Univariate Data Series] [Aantal ingeschrev...] [2014-09-20 17:12:07] [23f6b347f5ddfa38e8c261c083a091fc] [Current]
- RMP     [Histogram] [] [2014-09-29 12:43:18] [379af119b8c9c9402cda7215f859bbd6]
- RMP     [Kernel Density Estimation] [] [2014-09-29 12:45:16] [379af119b8c9c9402cda7215f859bbd6]
Feedback Forum

Post a new message
Dataseries X:
31566
30111
30019
31934
25826
26835
20205
17789
20520
22518
15572
11509
25447
24090
27786
26195
20516
22759
19028
16971
20036
22485
18730
14538
27561
25985
34670
32066
27186
29586
21359
21553
19573
24256
22380
16167
27297
28287
33474
28229
28785
25597
18130
20198
22849
23118
21925
20801
18785
20659
29367
23992
20645
22356
17902
15879
16963
21035
17988
10437
24470
22237
27053
26419
22311
20624
17336
15586
17733
19231
16102
11770


Summary of computational transaction
Raw Inputview raw input (R code)
Raw Outputview raw output of R engine
Computing time1 seconds
R Server'George Udny Yule' @ yule.wessa.net

\begin{tabular}{lllllllll}
\hline
Summary of computational transaction \tabularnewline
Raw Input & view raw input (R code)  \tabularnewline
Raw Output & view raw output of R engine  \tabularnewline
Computing time & 1 seconds \tabularnewline
R Server & 'George Udny Yule' @ yule.wessa.net \tabularnewline
\hline
\end{tabular}
%Source: https://freestatistics.org/blog/index.php?pk=235961&T=0

[TABLE]
[ROW][C]Summary of computational transaction[/C][/ROW]
[ROW][C]Raw Input[/C][C]view raw input (R code) [/C][/ROW]
[ROW][C]Raw Output[/C][C]view raw output of R engine [/C][/ROW]
[ROW][C]Computing time[/C][C]1 seconds[/C][/ROW]
[ROW][C]R Server[/C][C]'George Udny Yule' @ yule.wessa.net[/C][/ROW]
[/TABLE]
Source: https://freestatistics.org/blog/index.php?pk=235961&T=0

Globally Unique Identifier (entire table): ba.freestatistics.org/blog/index.php?pk=235961&T=0

As an alternative you can also use a QR Code:  

The GUIDs for individual cells are displayed in the table below:

Summary of computational transaction
Raw Inputview raw input (R code)
Raw Outputview raw output of R engine
Computing time1 seconds
R Server'George Udny Yule' @ yule.wessa.net


Univariate Dataseries
Name of dataseriesInschrijving nieuwe personenwagens
SourceBelgoStat
DescriptionHet aantal ingeschreven bedrijfswagens van 01/2008 tot 12/2013
Number of observations72

\begin{tabular}{lllllllll}
\hline
Univariate Dataseries \tabularnewline
Name of dataseries & Inschrijving nieuwe personenwagens \tabularnewline
Source & BelgoStat \tabularnewline
Description & Het aantal ingeschreven bedrijfswagens van 01/2008 tot 12/2013 \tabularnewline
Number of observations & 72 \tabularnewline
\hline
\end{tabular}
%Source: https://freestatistics.org/blog/index.php?pk=235961&T=1

[TABLE]
[ROW][C]Univariate Dataseries[/C][/ROW]
[ROW][C]Name of dataseries[/C][C]Inschrijving nieuwe personenwagens[/C][/ROW]
[ROW][C]Source[/C][C]BelgoStat[/C][/ROW]
[ROW][C]Description[/C][C]Het aantal ingeschreven bedrijfswagens van 01/2008 tot 12/2013[/C][/ROW]
[ROW][C]Number of observations[/C][C]72[/C][/ROW]
[/TABLE]
Source: https://freestatistics.org/blog/index.php?pk=235961&T=1

Globally Unique Identifier (entire table): ba.freestatistics.org/blog/index.php?pk=235961&T=1

As an alternative you can also use a QR Code:  

The GUIDs for individual cells are displayed in the table below:

Univariate Dataseries
Name of dataseriesInschrijving nieuwe personenwagens
SourceBelgoStat
DescriptionHet aantal ingeschreven bedrijfswagens van 01/2008 tot 12/2013
Number of observations72


Parameters (Session):
par1 = Inschrijving nieuwe personenwagens ; par2 = BelgoStat ; par3 = Het aantal ingeschreven bedrijfswagens van 01/2008 tot 12/2013 ; par4 = 12 ;
Parameters (R input):
par1 = Inschrijving nieuwe personenwagens ; par2 = BelgoStat ; par3 = Het aantal ingeschreven bedrijfswagens van 01/2008 tot 12/2013 ; par4 = 12 ;
R code (references can be found in the software module):
par4 <- '12'
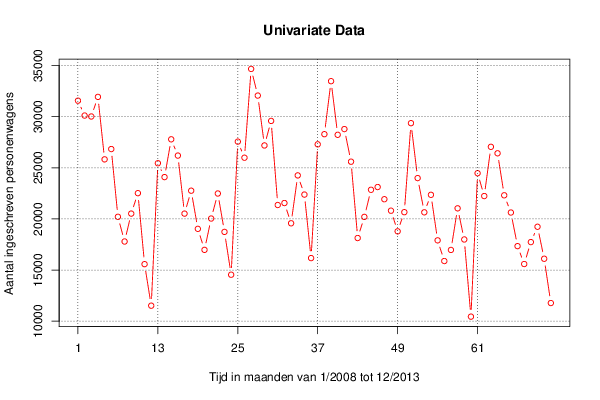
par3 <- 'Het aantal ingeschreven bedrijfswagens van 01/2008 tot 12/2013'
par2 <- 'BelgoStat'
par1 <- 'Inschrijving nieuwe personenwagens'
if (par4 != 'No season') {
par4 <- as.numeric(par4)
if (par4 < 4) par4 <- 12
}
summary(x)
n <- length(x)
bitmap(file='test1.png')
if (par4=='No season') {
plot(x,col=2,type='b',main=main,xlab=xlab,ylab=ylab,xaxt='n')
axis(1,at=seq(1,n,10))
}
if (par4!='No season') {
plot(x,col=2,type='b',main=main,xlab=xlab,ylab=ylab,xaxt='n')
axis(1,at=seq(1,n,par4))
grid(nx=0,ny=NULL,col='black')
abline(v=seq(1,n,par4),col='black',lty='dotted')
}
dev.off()
load(file='createtable')
a<-table.start()
a<-table.row.start(a)
a<-table.element(a,'Univariate Dataseries',2,TRUE)
a<-table.row.end(a)
a<-table.row.start(a)
a<-table.element(a,'Name of dataseries',header=TRUE)
a<-table.element(a,par1)
a<-table.row.end(a)
a<-table.row.start(a)
a<-table.element(a,'Source',header=TRUE)
a<-table.element(a,par2)
a<-table.row.end(a)
a<-table.row.start(a)
a<-table.element(a,'Description',header=TRUE)
a<-table.element(a,par3)
a<-table.row.end(a)
a<-table.row.start(a)
a<-table.element(a,'Number of observations',header=TRUE)
a<-table.element(a,length(x))
a<-table.row.end(a)
a<-table.end(a)
table.save(a,file='mytable.tab')