Free Statistics

of Irreproducible Research!

Author's title

Author*Unverified author*
R Software Modulerwasp_multipleregression.wasp
Title produced by softwareMultiple Regression
Date of computationSat, 20 Sep 2014 19:06:34 +0100
Cite this page as followsStatistical Computations at FreeStatistics.org, Office for Research Development and Education, URL https://freestatistics.org/blog/index.php?v=date/2014/Sep/20/t1411236454zvyylzroh83682m.htm/, Retrieved Tue, 14 May 2024 09:10:43 +0000
Statistical Computations at FreeStatistics.org, Office for Research Development and Education, URL https://freestatistics.org/blog/index.php?pk=235966, Retrieved Tue, 14 May 2024 09:10:43 +0000
QR Codes:

Original text written by user:
IsPrivate?No (this computation is public)
User-defined keywords
Estimated Impact150
Family? (F = Feedback message, R = changed R code, M = changed R Module, P = changed Parameters, D = changed Data)
-       [Multiple Regression] [] [2014-09-20 18:06:34] [d41d8cd98f00b204e9800998ecf8427e] [Current]
Feedback Forum

Post a new message
Dataseries X:
-0.31664	-0.061163
-0.076389	-0.034761
0.147816	-0.00596
0.212195	0.047547
0.085082	0.010674
-0.112901	-0.085962
-0.050705	-0.009859
0.066562	0.012191
-0.329558	-0.090791
-0.053405	-0.169425
-0.138675	-0.074849
-0.07899	0.007822
0.056005	-0.085657
-0.009098	-0.109931
0.177024	0.085405
0.197013	0.093925
0.079313	0.053081
0.048745	0.000196
0.14716	0.074142
0.0295	0.03356
0.101896	0.035723
0.016995	-0.019762
0.060531	0.057364
0.054134	0.017771
-0.088591	-0.036974
0.06538	0.028514
0.14847	0.058796
0.111021	0.014759
-0.016125	-0.081976
-0.020827	-0.053882
0.022741	0.068778
-0.055005	-0.047449
0.167215	0.087551
0.060723	0.036856
0.03379	-0.00229
0.03667	0.0653
0.051959	0.022646
0.040935	0.031957
-0.013314	-0.001047
0.004656	0.028495
-0.006569	-0.013501
-0.03496	-0.018258
0.163285	-0.021474
-0.014469	-0.056791
-0.009121	-0.071762
0.061523	0.107723
-0.055783	-0.005059
0.059655	0.008533
0.127111	0.043583
0.188311	0.040589
0.105284	0.031332
-0.025969	-0.007497
-0.010702	-0.062651
0.010853	0.039555
0.045822	0.012598
0.093539	0.019763
0.002803	0.024236
-0.107607	-0.019789
-0.012413	0.002847
-0.090738	0.007068


Summary of computational transaction
Raw Inputview raw input (R code)
Raw Outputview raw output of R engine
Computing time5 seconds
R Server'Herman Ole Andreas Wold' @ wold.wessa.net

\begin{tabular}{lllllllll}
\hline
Summary of computational transaction \tabularnewline
Raw Input & view raw input (R code)  \tabularnewline
Raw Output & view raw output of R engine  \tabularnewline
Computing time & 5 seconds \tabularnewline
R Server & 'Herman Ole Andreas Wold' @ wold.wessa.net \tabularnewline
\hline
\end{tabular}
%Source: https://freestatistics.org/blog/index.php?pk=235966&T=0

[TABLE]
[ROW][C]Summary of computational transaction[/C][/ROW]
[ROW][C]Raw Input[/C][C]view raw input (R code) [/C][/ROW]
[ROW][C]Raw Output[/C][C]view raw output of R engine [/C][/ROW]
[ROW][C]Computing time[/C][C]5 seconds[/C][/ROW]
[ROW][C]R Server[/C][C]'Herman Ole Andreas Wold' @ wold.wessa.net[/C][/ROW]
[/TABLE]
Source: https://freestatistics.org/blog/index.php?pk=235966&T=0

Globally Unique Identifier (entire table): ba.freestatistics.org/blog/index.php?pk=235966&T=0

As an alternative you can also use a QR Code:  

The GUIDs for individual cells are displayed in the table below:

Summary of computational transaction
Raw Inputview raw input (R code)
Raw Outputview raw output of R engine
Computing time5 seconds
R Server'Herman Ole Andreas Wold' @ wold.wessa.net


Multiple Linear Regression - Estimated Regression Equation
Returns[t] = + 0.0212961 + 1.2091`S&P500`[t] + e[t]

\begin{tabular}{lllllllll}
\hline
Multiple Linear Regression - Estimated Regression Equation \tabularnewline
Returns[t] =  +  0.0212961 +  1.2091`S&P500`[t]  + e[t] \tabularnewline
\hline
\end{tabular}
%Source: https://freestatistics.org/blog/index.php?pk=235966&T=1

[TABLE]
[ROW][C]Multiple Linear Regression - Estimated Regression Equation[/C][/ROW]
[ROW][C]Returns[t] =  +  0.0212961 +  1.2091`S&P500`[t]  + e[t][/C][/ROW]
[/TABLE]
Source: https://freestatistics.org/blog/index.php?pk=235966&T=1

Globally Unique Identifier (entire table): ba.freestatistics.org/blog/index.php?pk=235966&T=1

As an alternative you can also use a QR Code:  

The GUIDs for individual cells are displayed in the table below:

Multiple Linear Regression - Estimated Regression Equation
Returns[t] = + 0.0212961 + 1.2091`S&P500`[t] + e[t]


Multiple Linear Regression - Ordinary Least Squares
VariableParameterS.D.T-STATH0: parameter = 02-tail p-value1-tail p-value
(Intercept)0.02129610.01058332.0120.04884670.0244234
`S&P500`1.20910.1939396.2345.57973e-082.78986e-08

\begin{tabular}{lllllllll}
\hline
Multiple Linear Regression - Ordinary Least Squares \tabularnewline
Variable & Parameter & S.D. & T-STATH0: parameter = 0 & 2-tail p-value & 1-tail p-value \tabularnewline
(Intercept) & 0.0212961 & 0.0105833 & 2.012 & 0.0488467 & 0.0244234 \tabularnewline
`S&P500` & 1.2091 & 0.193939 & 6.234 & 5.57973e-08 & 2.78986e-08 \tabularnewline
\hline
\end{tabular}
%Source: https://freestatistics.org/blog/index.php?pk=235966&T=2

[TABLE]
[ROW][C]Multiple Linear Regression - Ordinary Least Squares[/C][/ROW]
[ROW][C]Variable[/C][C]Parameter[/C][C]S.D.[/C][C]T-STATH0: parameter = 0[/C][C]2-tail p-value[/C][C]1-tail p-value[/C][/ROW]
[ROW][C](Intercept)[/C][C]0.0212961[/C][C]0.0105833[/C][C]2.012[/C][C]0.0488467[/C][C]0.0244234[/C][/ROW]
[ROW][C]`S&P500`[/C][C]1.2091[/C][C]0.193939[/C][C]6.234[/C][C]5.57973e-08[/C][C]2.78986e-08[/C][/ROW]
[/TABLE]
Source: https://freestatistics.org/blog/index.php?pk=235966&T=2

Globally Unique Identifier (entire table): ba.freestatistics.org/blog/index.php?pk=235966&T=2

As an alternative you can also use a QR Code:  

The GUIDs for individual cells are displayed in the table below:

Multiple Linear Regression - Ordinary Least Squares
VariableParameterS.D.T-STATH0: parameter = 02-tail p-value1-tail p-value
(Intercept)0.02129610.01058332.0120.04884670.0244234
`S&P500`1.20910.1939396.2345.57973e-082.78986e-08


Multiple Linear Regression - Regression Statistics
Multiple R0.633441
R-squared0.401247
Adjusted R-squared0.390924
F-TEST (value)38.868
F-TEST (DF numerator)1
F-TEST (DF denominator)58
p-value5.57973e-08
Multiple Linear Regression - Residual Statistics
Residual Standard Deviation0.0819628
Sum Squared Residuals0.389638

\begin{tabular}{lllllllll}
\hline
Multiple Linear Regression - Regression Statistics \tabularnewline
Multiple R & 0.633441 \tabularnewline
R-squared & 0.401247 \tabularnewline
Adjusted R-squared & 0.390924 \tabularnewline
F-TEST (value) & 38.868 \tabularnewline
F-TEST (DF numerator) & 1 \tabularnewline
F-TEST (DF denominator) & 58 \tabularnewline
p-value & 5.57973e-08 \tabularnewline
Multiple Linear Regression - Residual Statistics \tabularnewline
Residual Standard Deviation & 0.0819628 \tabularnewline
Sum Squared Residuals & 0.389638 \tabularnewline
\hline
\end{tabular}
%Source: https://freestatistics.org/blog/index.php?pk=235966&T=3

[TABLE]
[ROW][C]Multiple Linear Regression - Regression Statistics[/C][/ROW]
[ROW][C]Multiple R[/C][C]0.633441[/C][/ROW]
[ROW][C]R-squared[/C][C]0.401247[/C][/ROW]
[ROW][C]Adjusted R-squared[/C][C]0.390924[/C][/ROW]
[ROW][C]F-TEST (value)[/C][C]38.868[/C][/ROW]
[ROW][C]F-TEST (DF numerator)[/C][C]1[/C][/ROW]
[ROW][C]F-TEST (DF denominator)[/C][C]58[/C][/ROW]
[ROW][C]p-value[/C][C]5.57973e-08[/C][/ROW]
[ROW][C]Multiple Linear Regression - Residual Statistics[/C][/ROW]
[ROW][C]Residual Standard Deviation[/C][C]0.0819628[/C][/ROW]
[ROW][C]Sum Squared Residuals[/C][C]0.389638[/C][/ROW]
[/TABLE]
Source: https://freestatistics.org/blog/index.php?pk=235966&T=3

Globally Unique Identifier (entire table): ba.freestatistics.org/blog/index.php?pk=235966&T=3

As an alternative you can also use a QR Code:  

The GUIDs for individual cells are displayed in the table below:

Multiple Linear Regression - Regression Statistics
Multiple R0.633441
R-squared0.401247
Adjusted R-squared0.390924
F-TEST (value)38.868
F-TEST (DF numerator)1
F-TEST (DF denominator)58
p-value5.57973e-08
Multiple Linear Regression - Residual Statistics
Residual Standard Deviation0.0819628
Sum Squared Residuals0.389638


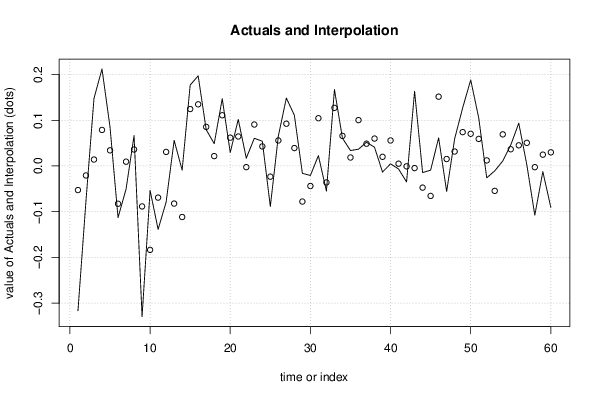
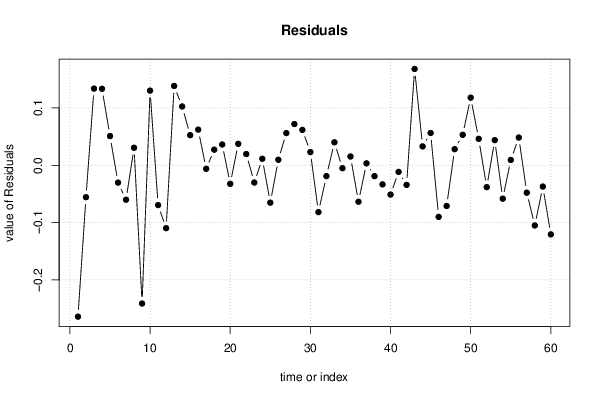
Multiple Linear Regression - Actuals, Interpolation, and Residuals
Time or IndexActualsInterpolationForecastResidualsPrediction Error
1-0.31664-0.052656-0.263984
2-0.076389-0.0207334-0.0556556
30.1478160.01408980.133726
40.2121950.0787850.13341
50.0850820.0342020.05088
6-0.112901-0.0826404-0.0302606
7-0.0507050.00937557-0.0600806
80.0665620.03603620.0305258
9-0.329558-0.0884791-0.241079
10-0.053405-0.1835550.13015
11-0.138675-0.0692037-0.0694713
12-0.078990.0307536-0.109744
130.056005-0.08227160.138277
14-0.009098-0.1116210.102523
150.1770240.1245590.0524649
160.1970130.1348610.0621524
170.0793130.0854762-0.00616318
180.0487450.0215330.027212
190.147160.1109410.036219
200.02950.0618734-0.0323734
210.1018960.06448870.0374073
220.016995-0.002598130.0195931
230.0605310.0906547-0.0301237
240.0541340.04278290.0113511
25-0.088591-0.0234091-0.0651819
260.065380.05577230.00960773
270.148470.09238620.0560838
280.1110210.03914110.0718799
29-0.016125-0.07782090.0616959
30-0.020827-0.04385250.0230255
310.0227410.104455-0.0817144
32-0.055005-0.0360744-0.0189306
330.1672150.1271540.0400612
340.0607230.0658586-0.00513557
350.033790.01852720.0152628
360.036670.10025-0.0635801
370.0519590.04867730.00328171
380.0409350.0599352-0.0190002
39-0.0133140.0200301-0.0333441
400.0046560.0557493-0.0510933
41-0.0065690.00497203-0.011541
42-0.03496-0.000779645-0.0341804
430.163285-0.00466810.167953
44-0.014469-0.04736980.0329008
45-0.009121-0.06547120.0563502
460.0615230.151544-0.0900207
47-0.0557830.0151792-0.0709622
480.0596550.03161330.0280417
490.1271110.07399220.0531188
500.1883110.07037210.117939
510.1052840.05917950.0461045
52-0.0259690.0122315-0.0382005
53-0.010702-0.05445510.0437531
540.0108530.0691219-0.0582689
550.0458220.03652830.00929373
560.0935390.04519150.0483475
570.0028030.0505998-0.0477968
58-0.107607-0.00263077-0.104976
59-0.0124130.0247384-0.0371514
60-0.0907380.029842-0.12058

\begin{tabular}{lllllllll}
\hline
Multiple Linear Regression - Actuals, Interpolation, and Residuals \tabularnewline
Time or Index & Actuals & InterpolationForecast & ResidualsPrediction Error \tabularnewline
1 & -0.31664 & -0.052656 & -0.263984 \tabularnewline
2 & -0.076389 & -0.0207334 & -0.0556556 \tabularnewline
3 & 0.147816 & 0.0140898 & 0.133726 \tabularnewline
4 & 0.212195 & 0.078785 & 0.13341 \tabularnewline
5 & 0.085082 & 0.034202 & 0.05088 \tabularnewline
6 & -0.112901 & -0.0826404 & -0.0302606 \tabularnewline
7 & -0.050705 & 0.00937557 & -0.0600806 \tabularnewline
8 & 0.066562 & 0.0360362 & 0.0305258 \tabularnewline
9 & -0.329558 & -0.0884791 & -0.241079 \tabularnewline
10 & -0.053405 & -0.183555 & 0.13015 \tabularnewline
11 & -0.138675 & -0.0692037 & -0.0694713 \tabularnewline
12 & -0.07899 & 0.0307536 & -0.109744 \tabularnewline
13 & 0.056005 & -0.0822716 & 0.138277 \tabularnewline
14 & -0.009098 & -0.111621 & 0.102523 \tabularnewline
15 & 0.177024 & 0.124559 & 0.0524649 \tabularnewline
16 & 0.197013 & 0.134861 & 0.0621524 \tabularnewline
17 & 0.079313 & 0.0854762 & -0.00616318 \tabularnewline
18 & 0.048745 & 0.021533 & 0.027212 \tabularnewline
19 & 0.14716 & 0.110941 & 0.036219 \tabularnewline
20 & 0.0295 & 0.0618734 & -0.0323734 \tabularnewline
21 & 0.101896 & 0.0644887 & 0.0374073 \tabularnewline
22 & 0.016995 & -0.00259813 & 0.0195931 \tabularnewline
23 & 0.060531 & 0.0906547 & -0.0301237 \tabularnewline
24 & 0.054134 & 0.0427829 & 0.0113511 \tabularnewline
25 & -0.088591 & -0.0234091 & -0.0651819 \tabularnewline
26 & 0.06538 & 0.0557723 & 0.00960773 \tabularnewline
27 & 0.14847 & 0.0923862 & 0.0560838 \tabularnewline
28 & 0.111021 & 0.0391411 & 0.0718799 \tabularnewline
29 & -0.016125 & -0.0778209 & 0.0616959 \tabularnewline
30 & -0.020827 & -0.0438525 & 0.0230255 \tabularnewline
31 & 0.022741 & 0.104455 & -0.0817144 \tabularnewline
32 & -0.055005 & -0.0360744 & -0.0189306 \tabularnewline
33 & 0.167215 & 0.127154 & 0.0400612 \tabularnewline
34 & 0.060723 & 0.0658586 & -0.00513557 \tabularnewline
35 & 0.03379 & 0.0185272 & 0.0152628 \tabularnewline
36 & 0.03667 & 0.10025 & -0.0635801 \tabularnewline
37 & 0.051959 & 0.0486773 & 0.00328171 \tabularnewline
38 & 0.040935 & 0.0599352 & -0.0190002 \tabularnewline
39 & -0.013314 & 0.0200301 & -0.0333441 \tabularnewline
40 & 0.004656 & 0.0557493 & -0.0510933 \tabularnewline
41 & -0.006569 & 0.00497203 & -0.011541 \tabularnewline
42 & -0.03496 & -0.000779645 & -0.0341804 \tabularnewline
43 & 0.163285 & -0.0046681 & 0.167953 \tabularnewline
44 & -0.014469 & -0.0473698 & 0.0329008 \tabularnewline
45 & -0.009121 & -0.0654712 & 0.0563502 \tabularnewline
46 & 0.061523 & 0.151544 & -0.0900207 \tabularnewline
47 & -0.055783 & 0.0151792 & -0.0709622 \tabularnewline
48 & 0.059655 & 0.0316133 & 0.0280417 \tabularnewline
49 & 0.127111 & 0.0739922 & 0.0531188 \tabularnewline
50 & 0.188311 & 0.0703721 & 0.117939 \tabularnewline
51 & 0.105284 & 0.0591795 & 0.0461045 \tabularnewline
52 & -0.025969 & 0.0122315 & -0.0382005 \tabularnewline
53 & -0.010702 & -0.0544551 & 0.0437531 \tabularnewline
54 & 0.010853 & 0.0691219 & -0.0582689 \tabularnewline
55 & 0.045822 & 0.0365283 & 0.00929373 \tabularnewline
56 & 0.093539 & 0.0451915 & 0.0483475 \tabularnewline
57 & 0.002803 & 0.0505998 & -0.0477968 \tabularnewline
58 & -0.107607 & -0.00263077 & -0.104976 \tabularnewline
59 & -0.012413 & 0.0247384 & -0.0371514 \tabularnewline
60 & -0.090738 & 0.029842 & -0.12058 \tabularnewline
\hline
\end{tabular}
%Source: https://freestatistics.org/blog/index.php?pk=235966&T=4

[TABLE]
[ROW][C]Multiple Linear Regression - Actuals, Interpolation, and Residuals[/C][/ROW]
[ROW][C]Time or Index[/C][C]Actuals[/C][C]InterpolationForecast[/C][C]ResidualsPrediction Error[/C][/ROW]
[ROW][C]1[/C][C]-0.31664[/C][C]-0.052656[/C][C]-0.263984[/C][/ROW]
[ROW][C]2[/C][C]-0.076389[/C][C]-0.0207334[/C][C]-0.0556556[/C][/ROW]
[ROW][C]3[/C][C]0.147816[/C][C]0.0140898[/C][C]0.133726[/C][/ROW]
[ROW][C]4[/C][C]0.212195[/C][C]0.078785[/C][C]0.13341[/C][/ROW]
[ROW][C]5[/C][C]0.085082[/C][C]0.034202[/C][C]0.05088[/C][/ROW]
[ROW][C]6[/C][C]-0.112901[/C][C]-0.0826404[/C][C]-0.0302606[/C][/ROW]
[ROW][C]7[/C][C]-0.050705[/C][C]0.00937557[/C][C]-0.0600806[/C][/ROW]
[ROW][C]8[/C][C]0.066562[/C][C]0.0360362[/C][C]0.0305258[/C][/ROW]
[ROW][C]9[/C][C]-0.329558[/C][C]-0.0884791[/C][C]-0.241079[/C][/ROW]
[ROW][C]10[/C][C]-0.053405[/C][C]-0.183555[/C][C]0.13015[/C][/ROW]
[ROW][C]11[/C][C]-0.138675[/C][C]-0.0692037[/C][C]-0.0694713[/C][/ROW]
[ROW][C]12[/C][C]-0.07899[/C][C]0.0307536[/C][C]-0.109744[/C][/ROW]
[ROW][C]13[/C][C]0.056005[/C][C]-0.0822716[/C][C]0.138277[/C][/ROW]
[ROW][C]14[/C][C]-0.009098[/C][C]-0.111621[/C][C]0.102523[/C][/ROW]
[ROW][C]15[/C][C]0.177024[/C][C]0.124559[/C][C]0.0524649[/C][/ROW]
[ROW][C]16[/C][C]0.197013[/C][C]0.134861[/C][C]0.0621524[/C][/ROW]
[ROW][C]17[/C][C]0.079313[/C][C]0.0854762[/C][C]-0.00616318[/C][/ROW]
[ROW][C]18[/C][C]0.048745[/C][C]0.021533[/C][C]0.027212[/C][/ROW]
[ROW][C]19[/C][C]0.14716[/C][C]0.110941[/C][C]0.036219[/C][/ROW]
[ROW][C]20[/C][C]0.0295[/C][C]0.0618734[/C][C]-0.0323734[/C][/ROW]
[ROW][C]21[/C][C]0.101896[/C][C]0.0644887[/C][C]0.0374073[/C][/ROW]
[ROW][C]22[/C][C]0.016995[/C][C]-0.00259813[/C][C]0.0195931[/C][/ROW]
[ROW][C]23[/C][C]0.060531[/C][C]0.0906547[/C][C]-0.0301237[/C][/ROW]
[ROW][C]24[/C][C]0.054134[/C][C]0.0427829[/C][C]0.0113511[/C][/ROW]
[ROW][C]25[/C][C]-0.088591[/C][C]-0.0234091[/C][C]-0.0651819[/C][/ROW]
[ROW][C]26[/C][C]0.06538[/C][C]0.0557723[/C][C]0.00960773[/C][/ROW]
[ROW][C]27[/C][C]0.14847[/C][C]0.0923862[/C][C]0.0560838[/C][/ROW]
[ROW][C]28[/C][C]0.111021[/C][C]0.0391411[/C][C]0.0718799[/C][/ROW]
[ROW][C]29[/C][C]-0.016125[/C][C]-0.0778209[/C][C]0.0616959[/C][/ROW]
[ROW][C]30[/C][C]-0.020827[/C][C]-0.0438525[/C][C]0.0230255[/C][/ROW]
[ROW][C]31[/C][C]0.022741[/C][C]0.104455[/C][C]-0.0817144[/C][/ROW]
[ROW][C]32[/C][C]-0.055005[/C][C]-0.0360744[/C][C]-0.0189306[/C][/ROW]
[ROW][C]33[/C][C]0.167215[/C][C]0.127154[/C][C]0.0400612[/C][/ROW]
[ROW][C]34[/C][C]0.060723[/C][C]0.0658586[/C][C]-0.00513557[/C][/ROW]
[ROW][C]35[/C][C]0.03379[/C][C]0.0185272[/C][C]0.0152628[/C][/ROW]
[ROW][C]36[/C][C]0.03667[/C][C]0.10025[/C][C]-0.0635801[/C][/ROW]
[ROW][C]37[/C][C]0.051959[/C][C]0.0486773[/C][C]0.00328171[/C][/ROW]
[ROW][C]38[/C][C]0.040935[/C][C]0.0599352[/C][C]-0.0190002[/C][/ROW]
[ROW][C]39[/C][C]-0.013314[/C][C]0.0200301[/C][C]-0.0333441[/C][/ROW]
[ROW][C]40[/C][C]0.004656[/C][C]0.0557493[/C][C]-0.0510933[/C][/ROW]
[ROW][C]41[/C][C]-0.006569[/C][C]0.00497203[/C][C]-0.011541[/C][/ROW]
[ROW][C]42[/C][C]-0.03496[/C][C]-0.000779645[/C][C]-0.0341804[/C][/ROW]
[ROW][C]43[/C][C]0.163285[/C][C]-0.0046681[/C][C]0.167953[/C][/ROW]
[ROW][C]44[/C][C]-0.014469[/C][C]-0.0473698[/C][C]0.0329008[/C][/ROW]
[ROW][C]45[/C][C]-0.009121[/C][C]-0.0654712[/C][C]0.0563502[/C][/ROW]
[ROW][C]46[/C][C]0.061523[/C][C]0.151544[/C][C]-0.0900207[/C][/ROW]
[ROW][C]47[/C][C]-0.055783[/C][C]0.0151792[/C][C]-0.0709622[/C][/ROW]
[ROW][C]48[/C][C]0.059655[/C][C]0.0316133[/C][C]0.0280417[/C][/ROW]
[ROW][C]49[/C][C]0.127111[/C][C]0.0739922[/C][C]0.0531188[/C][/ROW]
[ROW][C]50[/C][C]0.188311[/C][C]0.0703721[/C][C]0.117939[/C][/ROW]
[ROW][C]51[/C][C]0.105284[/C][C]0.0591795[/C][C]0.0461045[/C][/ROW]
[ROW][C]52[/C][C]-0.025969[/C][C]0.0122315[/C][C]-0.0382005[/C][/ROW]
[ROW][C]53[/C][C]-0.010702[/C][C]-0.0544551[/C][C]0.0437531[/C][/ROW]
[ROW][C]54[/C][C]0.010853[/C][C]0.0691219[/C][C]-0.0582689[/C][/ROW]
[ROW][C]55[/C][C]0.045822[/C][C]0.0365283[/C][C]0.00929373[/C][/ROW]
[ROW][C]56[/C][C]0.093539[/C][C]0.0451915[/C][C]0.0483475[/C][/ROW]
[ROW][C]57[/C][C]0.002803[/C][C]0.0505998[/C][C]-0.0477968[/C][/ROW]
[ROW][C]58[/C][C]-0.107607[/C][C]-0.00263077[/C][C]-0.104976[/C][/ROW]
[ROW][C]59[/C][C]-0.012413[/C][C]0.0247384[/C][C]-0.0371514[/C][/ROW]
[ROW][C]60[/C][C]-0.090738[/C][C]0.029842[/C][C]-0.12058[/C][/ROW]
[/TABLE]
Source: https://freestatistics.org/blog/index.php?pk=235966&T=4

Globally Unique Identifier (entire table): ba.freestatistics.org/blog/index.php?pk=235966&T=4

As an alternative you can also use a QR Code:  

The GUIDs for individual cells are displayed in the table below:

Multiple Linear Regression - Actuals, Interpolation, and Residuals
Time or IndexActualsInterpolationForecastResidualsPrediction Error
1-0.31664-0.052656-0.263984
2-0.076389-0.0207334-0.0556556
30.1478160.01408980.133726
40.2121950.0787850.13341
50.0850820.0342020.05088
6-0.112901-0.0826404-0.0302606
7-0.0507050.00937557-0.0600806
80.0665620.03603620.0305258
9-0.329558-0.0884791-0.241079
10-0.053405-0.1835550.13015
11-0.138675-0.0692037-0.0694713
12-0.078990.0307536-0.109744
130.056005-0.08227160.138277
14-0.009098-0.1116210.102523
150.1770240.1245590.0524649
160.1970130.1348610.0621524
170.0793130.0854762-0.00616318
180.0487450.0215330.027212
190.147160.1109410.036219
200.02950.0618734-0.0323734
210.1018960.06448870.0374073
220.016995-0.002598130.0195931
230.0605310.0906547-0.0301237
240.0541340.04278290.0113511
25-0.088591-0.0234091-0.0651819
260.065380.05577230.00960773
270.148470.09238620.0560838
280.1110210.03914110.0718799
29-0.016125-0.07782090.0616959
30-0.020827-0.04385250.0230255
310.0227410.104455-0.0817144
32-0.055005-0.0360744-0.0189306
330.1672150.1271540.0400612
340.0607230.0658586-0.00513557
350.033790.01852720.0152628
360.036670.10025-0.0635801
370.0519590.04867730.00328171
380.0409350.0599352-0.0190002
39-0.0133140.0200301-0.0333441
400.0046560.0557493-0.0510933
41-0.0065690.00497203-0.011541
42-0.03496-0.000779645-0.0341804
430.163285-0.00466810.167953
44-0.014469-0.04736980.0329008
45-0.009121-0.06547120.0563502
460.0615230.151544-0.0900207
47-0.0557830.0151792-0.0709622
480.0596550.03161330.0280417
490.1271110.07399220.0531188
500.1883110.07037210.117939
510.1052840.05917950.0461045
52-0.0259690.0122315-0.0382005
53-0.010702-0.05445510.0437531
540.0108530.0691219-0.0582689
550.0458220.03652830.00929373
560.0935390.04519150.0483475
570.0028030.0505998-0.0477968
58-0.107607-0.00263077-0.104976
59-0.0124130.0247384-0.0371514
60-0.0907380.029842-0.12058


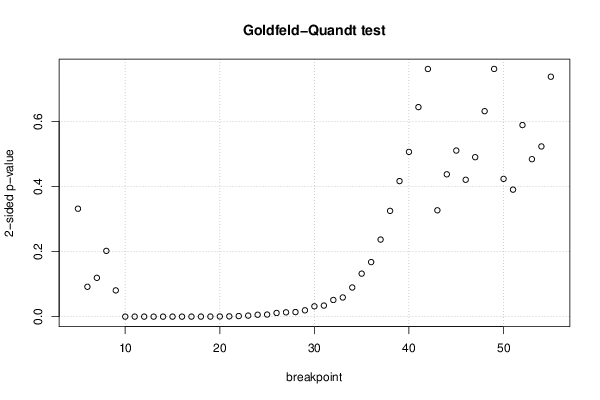
Goldfeld-Quandt test for Heteroskedasticity
p-valuesAlternative Hypothesis
breakpoint indexgreater2-sidedless
50.8342440.3315120.165756
60.9540950.0918110.0459055
70.9403530.1192930.0596467
80.8989990.2020020.101001
90.9596910.08061810.0403091
100.9999460.0001072865.36429e-05
110.9999220.0001565087.8254e-05
120.9999558.96544e-054.48272e-05
130.999991.943e-059.715e-06
140.9999931.42614e-057.1307e-06
150.9999872.50094e-051.25047e-05
160.9999823.56667e-051.78334e-05
170.9999598.20058e-054.10029e-05
180.9999130.0001738318.69154e-05
190.9998480.0003045150.000152257
200.9997180.0005645220.000282261
210.9995150.0009700050.000485002
220.9990660.001867540.000933771
230.998380.003239360.00161968
240.9970670.005865380.00293269
250.9967490.006502590.00325129
260.9943550.01128990.00564495
270.9933580.01328450.00664225
280.9929470.01410620.00705308
290.9902340.01953290.00976646
300.9841370.03172530.0158626
310.9829650.03407040.0170352
320.974370.05125940.0256297
330.9705280.05894330.0294716
340.9552010.08959740.0447987
350.9339380.1321240.0660621
360.9162040.1675920.0837961
370.881590.236820.11841
380.8375350.3249310.162465
390.7918050.416390.208195
400.7470210.5059590.252979
410.6781830.6436330.321817
420.6196420.7607170.380358
430.8366670.3266670.163333
440.7813810.4372380.218619
450.7449020.5101960.255098
460.7897750.420450.210225
470.75510.4897990.2449
480.6844320.6311360.315568
490.6195750.7608510.380425
500.7883820.4232360.211618
510.8049260.3901480.195074
520.7057330.5885350.294267
530.7581660.4836680.241834
540.7385980.5228030.261402
550.6315340.7369320.368466

\begin{tabular}{lllllllll}
\hline
Goldfeld-Quandt test for Heteroskedasticity \tabularnewline
p-values & Alternative Hypothesis \tabularnewline
breakpoint index & greater & 2-sided & less \tabularnewline
5 & 0.834244 & 0.331512 & 0.165756 \tabularnewline
6 & 0.954095 & 0.091811 & 0.0459055 \tabularnewline
7 & 0.940353 & 0.119293 & 0.0596467 \tabularnewline
8 & 0.898999 & 0.202002 & 0.101001 \tabularnewline
9 & 0.959691 & 0.0806181 & 0.0403091 \tabularnewline
10 & 0.999946 & 0.000107286 & 5.36429e-05 \tabularnewline
11 & 0.999922 & 0.000156508 & 7.8254e-05 \tabularnewline
12 & 0.999955 & 8.96544e-05 & 4.48272e-05 \tabularnewline
13 & 0.99999 & 1.943e-05 & 9.715e-06 \tabularnewline
14 & 0.999993 & 1.42614e-05 & 7.1307e-06 \tabularnewline
15 & 0.999987 & 2.50094e-05 & 1.25047e-05 \tabularnewline
16 & 0.999982 & 3.56667e-05 & 1.78334e-05 \tabularnewline
17 & 0.999959 & 8.20058e-05 & 4.10029e-05 \tabularnewline
18 & 0.999913 & 0.000173831 & 8.69154e-05 \tabularnewline
19 & 0.999848 & 0.000304515 & 0.000152257 \tabularnewline
20 & 0.999718 & 0.000564522 & 0.000282261 \tabularnewline
21 & 0.999515 & 0.000970005 & 0.000485002 \tabularnewline
22 & 0.999066 & 0.00186754 & 0.000933771 \tabularnewline
23 & 0.99838 & 0.00323936 & 0.00161968 \tabularnewline
24 & 0.997067 & 0.00586538 & 0.00293269 \tabularnewline
25 & 0.996749 & 0.00650259 & 0.00325129 \tabularnewline
26 & 0.994355 & 0.0112899 & 0.00564495 \tabularnewline
27 & 0.993358 & 0.0132845 & 0.00664225 \tabularnewline
28 & 0.992947 & 0.0141062 & 0.00705308 \tabularnewline
29 & 0.990234 & 0.0195329 & 0.00976646 \tabularnewline
30 & 0.984137 & 0.0317253 & 0.0158626 \tabularnewline
31 & 0.982965 & 0.0340704 & 0.0170352 \tabularnewline
32 & 0.97437 & 0.0512594 & 0.0256297 \tabularnewline
33 & 0.970528 & 0.0589433 & 0.0294716 \tabularnewline
34 & 0.955201 & 0.0895974 & 0.0447987 \tabularnewline
35 & 0.933938 & 0.132124 & 0.0660621 \tabularnewline
36 & 0.916204 & 0.167592 & 0.0837961 \tabularnewline
37 & 0.88159 & 0.23682 & 0.11841 \tabularnewline
38 & 0.837535 & 0.324931 & 0.162465 \tabularnewline
39 & 0.791805 & 0.41639 & 0.208195 \tabularnewline
40 & 0.747021 & 0.505959 & 0.252979 \tabularnewline
41 & 0.678183 & 0.643633 & 0.321817 \tabularnewline
42 & 0.619642 & 0.760717 & 0.380358 \tabularnewline
43 & 0.836667 & 0.326667 & 0.163333 \tabularnewline
44 & 0.781381 & 0.437238 & 0.218619 \tabularnewline
45 & 0.744902 & 0.510196 & 0.255098 \tabularnewline
46 & 0.789775 & 0.42045 & 0.210225 \tabularnewline
47 & 0.7551 & 0.489799 & 0.2449 \tabularnewline
48 & 0.684432 & 0.631136 & 0.315568 \tabularnewline
49 & 0.619575 & 0.760851 & 0.380425 \tabularnewline
50 & 0.788382 & 0.423236 & 0.211618 \tabularnewline
51 & 0.804926 & 0.390148 & 0.195074 \tabularnewline
52 & 0.705733 & 0.588535 & 0.294267 \tabularnewline
53 & 0.758166 & 0.483668 & 0.241834 \tabularnewline
54 & 0.738598 & 0.522803 & 0.261402 \tabularnewline
55 & 0.631534 & 0.736932 & 0.368466 \tabularnewline
\hline
\end{tabular}
%Source: https://freestatistics.org/blog/index.php?pk=235966&T=5

[TABLE]
[ROW][C]Goldfeld-Quandt test for Heteroskedasticity[/C][/ROW]
[ROW][C]p-values[/C][C]Alternative Hypothesis[/C][/ROW]
[ROW][C]breakpoint index[/C][C]greater[/C][C]2-sided[/C][C]less[/C][/ROW]
[ROW][C]5[/C][C]0.834244[/C][C]0.331512[/C][C]0.165756[/C][/ROW]
[ROW][C]6[/C][C]0.954095[/C][C]0.091811[/C][C]0.0459055[/C][/ROW]
[ROW][C]7[/C][C]0.940353[/C][C]0.119293[/C][C]0.0596467[/C][/ROW]
[ROW][C]8[/C][C]0.898999[/C][C]0.202002[/C][C]0.101001[/C][/ROW]
[ROW][C]9[/C][C]0.959691[/C][C]0.0806181[/C][C]0.0403091[/C][/ROW]
[ROW][C]10[/C][C]0.999946[/C][C]0.000107286[/C][C]5.36429e-05[/C][/ROW]
[ROW][C]11[/C][C]0.999922[/C][C]0.000156508[/C][C]7.8254e-05[/C][/ROW]
[ROW][C]12[/C][C]0.999955[/C][C]8.96544e-05[/C][C]4.48272e-05[/C][/ROW]
[ROW][C]13[/C][C]0.99999[/C][C]1.943e-05[/C][C]9.715e-06[/C][/ROW]
[ROW][C]14[/C][C]0.999993[/C][C]1.42614e-05[/C][C]7.1307e-06[/C][/ROW]
[ROW][C]15[/C][C]0.999987[/C][C]2.50094e-05[/C][C]1.25047e-05[/C][/ROW]
[ROW][C]16[/C][C]0.999982[/C][C]3.56667e-05[/C][C]1.78334e-05[/C][/ROW]
[ROW][C]17[/C][C]0.999959[/C][C]8.20058e-05[/C][C]4.10029e-05[/C][/ROW]
[ROW][C]18[/C][C]0.999913[/C][C]0.000173831[/C][C]8.69154e-05[/C][/ROW]
[ROW][C]19[/C][C]0.999848[/C][C]0.000304515[/C][C]0.000152257[/C][/ROW]
[ROW][C]20[/C][C]0.999718[/C][C]0.000564522[/C][C]0.000282261[/C][/ROW]
[ROW][C]21[/C][C]0.999515[/C][C]0.000970005[/C][C]0.000485002[/C][/ROW]
[ROW][C]22[/C][C]0.999066[/C][C]0.00186754[/C][C]0.000933771[/C][/ROW]
[ROW][C]23[/C][C]0.99838[/C][C]0.00323936[/C][C]0.00161968[/C][/ROW]
[ROW][C]24[/C][C]0.997067[/C][C]0.00586538[/C][C]0.00293269[/C][/ROW]
[ROW][C]25[/C][C]0.996749[/C][C]0.00650259[/C][C]0.00325129[/C][/ROW]
[ROW][C]26[/C][C]0.994355[/C][C]0.0112899[/C][C]0.00564495[/C][/ROW]
[ROW][C]27[/C][C]0.993358[/C][C]0.0132845[/C][C]0.00664225[/C][/ROW]
[ROW][C]28[/C][C]0.992947[/C][C]0.0141062[/C][C]0.00705308[/C][/ROW]
[ROW][C]29[/C][C]0.990234[/C][C]0.0195329[/C][C]0.00976646[/C][/ROW]
[ROW][C]30[/C][C]0.984137[/C][C]0.0317253[/C][C]0.0158626[/C][/ROW]
[ROW][C]31[/C][C]0.982965[/C][C]0.0340704[/C][C]0.0170352[/C][/ROW]
[ROW][C]32[/C][C]0.97437[/C][C]0.0512594[/C][C]0.0256297[/C][/ROW]
[ROW][C]33[/C][C]0.970528[/C][C]0.0589433[/C][C]0.0294716[/C][/ROW]
[ROW][C]34[/C][C]0.955201[/C][C]0.0895974[/C][C]0.0447987[/C][/ROW]
[ROW][C]35[/C][C]0.933938[/C][C]0.132124[/C][C]0.0660621[/C][/ROW]
[ROW][C]36[/C][C]0.916204[/C][C]0.167592[/C][C]0.0837961[/C][/ROW]
[ROW][C]37[/C][C]0.88159[/C][C]0.23682[/C][C]0.11841[/C][/ROW]
[ROW][C]38[/C][C]0.837535[/C][C]0.324931[/C][C]0.162465[/C][/ROW]
[ROW][C]39[/C][C]0.791805[/C][C]0.41639[/C][C]0.208195[/C][/ROW]
[ROW][C]40[/C][C]0.747021[/C][C]0.505959[/C][C]0.252979[/C][/ROW]
[ROW][C]41[/C][C]0.678183[/C][C]0.643633[/C][C]0.321817[/C][/ROW]
[ROW][C]42[/C][C]0.619642[/C][C]0.760717[/C][C]0.380358[/C][/ROW]
[ROW][C]43[/C][C]0.836667[/C][C]0.326667[/C][C]0.163333[/C][/ROW]
[ROW][C]44[/C][C]0.781381[/C][C]0.437238[/C][C]0.218619[/C][/ROW]
[ROW][C]45[/C][C]0.744902[/C][C]0.510196[/C][C]0.255098[/C][/ROW]
[ROW][C]46[/C][C]0.789775[/C][C]0.42045[/C][C]0.210225[/C][/ROW]
[ROW][C]47[/C][C]0.7551[/C][C]0.489799[/C][C]0.2449[/C][/ROW]
[ROW][C]48[/C][C]0.684432[/C][C]0.631136[/C][C]0.315568[/C][/ROW]
[ROW][C]49[/C][C]0.619575[/C][C]0.760851[/C][C]0.380425[/C][/ROW]
[ROW][C]50[/C][C]0.788382[/C][C]0.423236[/C][C]0.211618[/C][/ROW]
[ROW][C]51[/C][C]0.804926[/C][C]0.390148[/C][C]0.195074[/C][/ROW]
[ROW][C]52[/C][C]0.705733[/C][C]0.588535[/C][C]0.294267[/C][/ROW]
[ROW][C]53[/C][C]0.758166[/C][C]0.483668[/C][C]0.241834[/C][/ROW]
[ROW][C]54[/C][C]0.738598[/C][C]0.522803[/C][C]0.261402[/C][/ROW]
[ROW][C]55[/C][C]0.631534[/C][C]0.736932[/C][C]0.368466[/C][/ROW]
[/TABLE]
Source: https://freestatistics.org/blog/index.php?pk=235966&T=5

Globally Unique Identifier (entire table): ba.freestatistics.org/blog/index.php?pk=235966&T=5

As an alternative you can also use a QR Code:  

The GUIDs for individual cells are displayed in the table below:

Goldfeld-Quandt test for Heteroskedasticity
p-valuesAlternative Hypothesis
breakpoint indexgreater2-sidedless
50.8342440.3315120.165756
60.9540950.0918110.0459055
70.9403530.1192930.0596467
80.8989990.2020020.101001
90.9596910.08061810.0403091
100.9999460.0001072865.36429e-05
110.9999220.0001565087.8254e-05
120.9999558.96544e-054.48272e-05
130.999991.943e-059.715e-06
140.9999931.42614e-057.1307e-06
150.9999872.50094e-051.25047e-05
160.9999823.56667e-051.78334e-05
170.9999598.20058e-054.10029e-05
180.9999130.0001738318.69154e-05
190.9998480.0003045150.000152257
200.9997180.0005645220.000282261
210.9995150.0009700050.000485002
220.9990660.001867540.000933771
230.998380.003239360.00161968
240.9970670.005865380.00293269
250.9967490.006502590.00325129
260.9943550.01128990.00564495
270.9933580.01328450.00664225
280.9929470.01410620.00705308
290.9902340.01953290.00976646
300.9841370.03172530.0158626
310.9829650.03407040.0170352
320.974370.05125940.0256297
330.9705280.05894330.0294716
340.9552010.08959740.0447987
350.9339380.1321240.0660621
360.9162040.1675920.0837961
370.881590.236820.11841
380.8375350.3249310.162465
390.7918050.416390.208195
400.7470210.5059590.252979
410.6781830.6436330.321817
420.6196420.7607170.380358
430.8366670.3266670.163333
440.7813810.4372380.218619
450.7449020.5101960.255098
460.7897750.420450.210225
470.75510.4897990.2449
480.6844320.6311360.315568
490.6195750.7608510.380425
500.7883820.4232360.211618
510.8049260.3901480.195074
520.7057330.5885350.294267
530.7581660.4836680.241834
540.7385980.5228030.261402
550.6315340.7369320.368466


Meta Analysis of Goldfeld-Quandt test for Heteroskedasticity
Description# significant tests% significant testsOK/NOK
1% type I error level160.313725NOK
5% type I error level220.431373NOK
10% type I error level270.529412NOK

\begin{tabular}{lllllllll}
\hline
Meta Analysis of Goldfeld-Quandt test for Heteroskedasticity \tabularnewline
Description & # significant tests & % significant tests & OK/NOK \tabularnewline
1% type I error level & 16 & 0.313725 & NOK \tabularnewline
5% type I error level & 22 & 0.431373 & NOK \tabularnewline
10% type I error level & 27 & 0.529412 & NOK \tabularnewline
\hline
\end{tabular}
%Source: https://freestatistics.org/blog/index.php?pk=235966&T=6

[TABLE]
[ROW][C]Meta Analysis of Goldfeld-Quandt test for Heteroskedasticity[/C][/ROW]
[ROW][C]Description[/C][C]# significant tests[/C][C]% significant tests[/C][C]OK/NOK[/C][/ROW]
[ROW][C]1% type I error level[/C][C]16[/C][C]0.313725[/C][C]NOK[/C][/ROW]
[ROW][C]5% type I error level[/C][C]22[/C][C]0.431373[/C][C]NOK[/C][/ROW]
[ROW][C]10% type I error level[/C][C]27[/C][C]0.529412[/C][C]NOK[/C][/ROW]
[/TABLE]
Source: https://freestatistics.org/blog/index.php?pk=235966&T=6

Globally Unique Identifier (entire table): ba.freestatistics.org/blog/index.php?pk=235966&T=6

As an alternative you can also use a QR Code:  

The GUIDs for individual cells are displayed in the table below:

Meta Analysis of Goldfeld-Quandt test for Heteroskedasticity
Description# significant tests% significant testsOK/NOK
1% type I error level160.313725NOK
5% type I error level220.431373NOK
10% type I error level270.529412NOK


Parameters (Session):
par1 = 1 ; par2 = Do not include Seasonal Dummies ; par3 = No Linear Trend ;
Parameters (R input):
par1 = 1 ; par2 = Do not include Seasonal Dummies ; par3 = No Linear Trend ;
R code (references can be found in the software module):
library(lattice)
library(lmtest)
n25 <- 25 #minimum number of obs. for Goldfeld-Quandt test
par1 <- as.numeric(par1)
x <- t(y)
k <- length(x[1,])
n <- length(x[,1])
x1 <- cbind(x[,par1], x[,1:k!=par1])
mycolnames <- c(colnames(x)[par1], colnames(x)[1:k!=par1])
colnames(x1) <- mycolnames #colnames(x)[par1]
x <- x1
if (par3 == 'First Differences'){
x2 <- array(0, dim=c(n-1,k), dimnames=list(1:(n-1), paste('(1-B)',colnames(x),sep='')))
for (i in 1:n-1) {
for (j in 1:k) {
x2[i,j] <- x[i+1,j] - x[i,j]
}
}
x <- x2
}
if (par2 == 'Include Monthly Dummies'){
x2 <- array(0, dim=c(n,11), dimnames=list(1:n, paste('M', seq(1:11), sep ='')))
for (i in 1:11){
x2[seq(i,n,12),i] <- 1
}
x <- cbind(x, x2)
}
if (par2 == 'Include Quarterly Dummies'){
x2 <- array(0, dim=c(n,3), dimnames=list(1:n, paste('Q', seq(1:3), sep ='')))
for (i in 1:3){
x2[seq(i,n,4),i] <- 1
}
x <- cbind(x, x2)
}
k <- length(x[1,])
if (par3 == 'Linear Trend'){
x <- cbind(x, c(1:n))
colnames(x)[k+1] <- 't'
}
x
k <- length(x[1,])
df <- as.data.frame(x)
(mylm <- lm(df))
(mysum <- summary(mylm))
if (n > n25) {
kp3 <- k + 3
nmkm3 <- n - k - 3
gqarr <- array(NA, dim=c(nmkm3-kp3+1,3))
numgqtests <- 0
numsignificant1 <- 0
numsignificant5 <- 0
numsignificant10 <- 0
for (mypoint in kp3:nmkm3) {
j <- 0
numgqtests <- numgqtests + 1
for (myalt in c('greater', 'two.sided', 'less')) {
j <- j + 1
gqarr[mypoint-kp3+1,j] <- gqtest(mylm, point=mypoint, alternative=myalt)$p.value
}
if (gqarr[mypoint-kp3+1,2] < 0.01) numsignificant1 <- numsignificant1 + 1
if (gqarr[mypoint-kp3+1,2] < 0.05) numsignificant5 <- numsignificant5 + 1
if (gqarr[mypoint-kp3+1,2] < 0.10) numsignificant10 <- numsignificant10 + 1
}
gqarr
}
bitmap(file='test0.png')
plot(x[,1], type='l', main='Actuals and Interpolation', ylab='value of Actuals and Interpolation (dots)', xlab='time or index')
points(x[,1]-mysum$resid)
grid()
dev.off()
bitmap(file='test1.png')
plot(mysum$resid, type='b', pch=19, main='Residuals', ylab='value of Residuals', xlab='time or index')
grid()
dev.off()
bitmap(file='test2.png')
hist(mysum$resid, main='Residual Histogram', xlab='values of Residuals')
grid()
dev.off()
bitmap(file='test3.png')
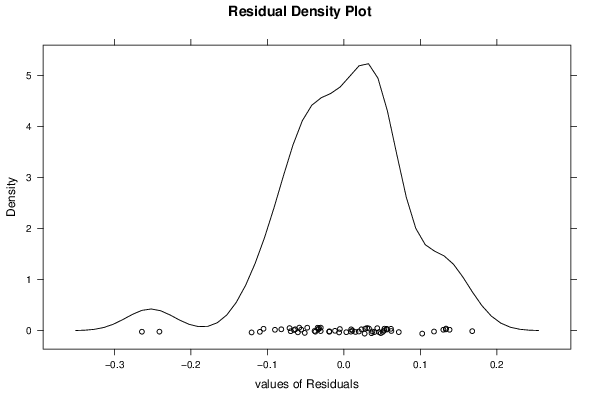
densityplot(~mysum$resid,col='black',main='Residual Density Plot', xlab='values of Residuals')
dev.off()
bitmap(file='test4.png')
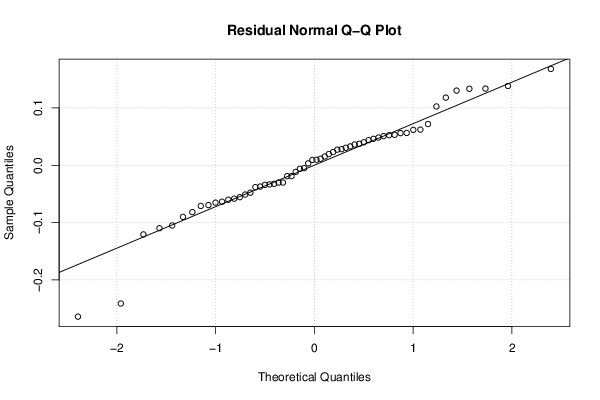
qqnorm(mysum$resid, main='Residual Normal Q-Q Plot')
qqline(mysum$resid)
grid()
dev.off()
(myerror <- as.ts(mysum$resid))
bitmap(file='test5.png')
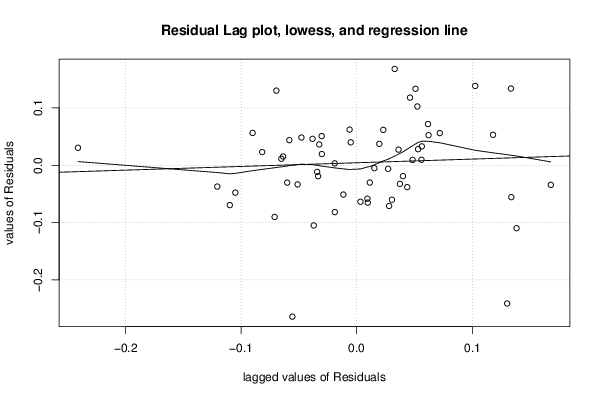
dum <- cbind(lag(myerror,k=1),myerror)
dum
dum1 <- dum[2:length(myerror),]
dum1
z <- as.data.frame(dum1)
z
plot(z,main=paste('Residual Lag plot, lowess, and regression line'), ylab='values of Residuals', xlab='lagged values of Residuals')
lines(lowess(z))
abline(lm(z))
grid()
dev.off()
bitmap(file='test6.png')
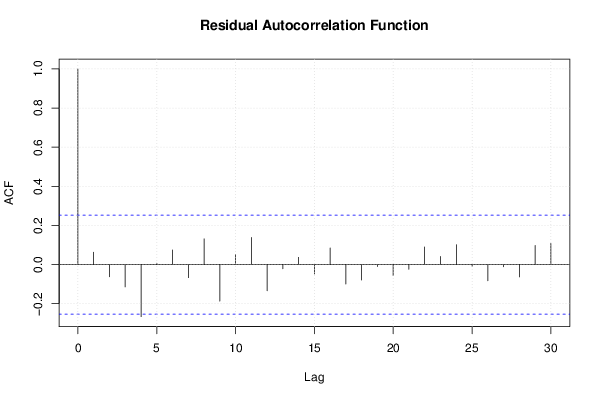
acf(mysum$resid, lag.max=length(mysum$resid)/2, main='Residual Autocorrelation Function')
grid()
dev.off()
bitmap(file='test7.png')
pacf(mysum$resid, lag.max=length(mysum$resid)/2, main='Residual Partial Autocorrelation Function')
grid()
dev.off()
bitmap(file='test8.png')
opar <- par(mfrow = c(2,2), oma = c(0, 0, 1.1, 0))
plot(mylm, las = 1, sub='Residual Diagnostics')
par(opar)
dev.off()
if (n > n25) {
bitmap(file='test9.png')
plot(kp3:nmkm3,gqarr[,2], main='Goldfeld-Quandt test',ylab='2-sided p-value',xlab='breakpoint')
grid()
dev.off()
}
load(file='createtable')
a<-table.start()
a<-table.row.start(a)
a<-table.element(a, 'Multiple Linear Regression - Estimated Regression Equation', 1, TRUE)
a<-table.row.end(a)
myeq <- colnames(x)[1]
myeq <- paste(myeq, '[t] = ', sep='')
for (i in 1:k){
if (mysum$coefficients[i,1] > 0) myeq <- paste(myeq, '+', '')
myeq <- paste(myeq, signif(mysum$coefficients[i,1],6), sep=' ')
if (rownames(mysum$coefficients)[i] != '(Intercept)') {
myeq <- paste(myeq, rownames(mysum$coefficients)[i], sep='')
if (rownames(mysum$coefficients)[i] != 't') myeq <- paste(myeq, '[t]', sep='')
}
}
myeq <- paste(myeq, ' + e[t]')
a<-table.row.start(a)
a<-table.element(a, myeq)
a<-table.row.end(a)
a<-table.end(a)
table.save(a,file='mytable1.tab')
a<-table.start()
a<-table.row.start(a)
a<-table.element(a,hyperlink('ols1.htm','Multiple Linear Regression - Ordinary Least Squares',''), 6, TRUE)
a<-table.row.end(a)
a<-table.row.start(a)
a<-table.element(a,'Variable',header=TRUE)
a<-table.element(a,'Parameter',header=TRUE)
a<-table.element(a,'S.D.',header=TRUE)
a<-table.element(a,'T-STAT
H0: parameter = 0',header=TRUE)
a<-table.element(a,'2-tail p-value',header=TRUE)
a<-table.element(a,'1-tail p-value',header=TRUE)
a<-table.row.end(a)
for (i in 1:k){
a<-table.row.start(a)
a<-table.element(a,rownames(mysum$coefficients)[i],header=TRUE)
a<-table.element(a,signif(mysum$coefficients[i,1],6))
a<-table.element(a, signif(mysum$coefficients[i,2],6))
a<-table.element(a, signif(mysum$coefficients[i,3],4))
a<-table.element(a, signif(mysum$coefficients[i,4],6))
a<-table.element(a, signif(mysum$coefficients[i,4]/2,6))
a<-table.row.end(a)
}
a<-table.end(a)
table.save(a,file='mytable2.tab')
a<-table.start()
a<-table.row.start(a)
a<-table.element(a, 'Multiple Linear Regression - Regression Statistics', 2, TRUE)
a<-table.row.end(a)
a<-table.row.start(a)
a<-table.element(a, 'Multiple R',1,TRUE)
a<-table.element(a, signif(sqrt(mysum$r.squared),6))
a<-table.row.end(a)
a<-table.row.start(a)
a<-table.element(a, 'R-squared',1,TRUE)
a<-table.element(a, signif(mysum$r.squared,6))
a<-table.row.end(a)
a<-table.row.start(a)
a<-table.element(a, 'Adjusted R-squared',1,TRUE)
a<-table.element(a, signif(mysum$adj.r.squared,6))
a<-table.row.end(a)
a<-table.row.start(a)
a<-table.element(a, 'F-TEST (value)',1,TRUE)
a<-table.element(a, signif(mysum$fstatistic[1],6))
a<-table.row.end(a)
a<-table.row.start(a)
a<-table.element(a, 'F-TEST (DF numerator)',1,TRUE)
a<-table.element(a, signif(mysum$fstatistic[2],6))
a<-table.row.end(a)
a<-table.row.start(a)
a<-table.element(a, 'F-TEST (DF denominator)',1,TRUE)
a<-table.element(a, signif(mysum$fstatistic[3],6))
a<-table.row.end(a)
a<-table.row.start(a)
a<-table.element(a, 'p-value',1,TRUE)
a<-table.element(a, signif(1-pf(mysum$fstatistic[1],mysum$fstatistic[2],mysum$fstatistic[3]),6))
a<-table.row.end(a)
a<-table.row.start(a)
a<-table.element(a, 'Multiple Linear Regression - Residual Statistics', 2, TRUE)
a<-table.row.end(a)
a<-table.row.start(a)
a<-table.element(a, 'Residual Standard Deviation',1,TRUE)
a<-table.element(a, signif(mysum$sigma,6))
a<-table.row.end(a)
a<-table.row.start(a)
a<-table.element(a, 'Sum Squared Residuals',1,TRUE)
a<-table.element(a, signif(sum(myerror*myerror),6))
a<-table.row.end(a)
a<-table.end(a)
table.save(a,file='mytable3.tab')
a<-table.start()
a<-table.row.start(a)
a<-table.element(a, 'Multiple Linear Regression - Actuals, Interpolation, and Residuals', 4, TRUE)
a<-table.row.end(a)
a<-table.row.start(a)
a<-table.element(a, 'Time or Index', 1, TRUE)
a<-table.element(a, 'Actuals', 1, TRUE)
a<-table.element(a, 'Interpolation
Forecast', 1, TRUE)
a<-table.element(a, 'Residuals
Prediction Error', 1, TRUE)
a<-table.row.end(a)
for (i in 1:n) {
a<-table.row.start(a)
a<-table.element(a,i, 1, TRUE)
a<-table.element(a,signif(x[i],6))
a<-table.element(a,signif(x[i]-mysum$resid[i],6))
a<-table.element(a,signif(mysum$resid[i],6))
a<-table.row.end(a)
}
a<-table.end(a)
table.save(a,file='mytable4.tab')
if (n > n25) {
a<-table.start()
a<-table.row.start(a)
a<-table.element(a,'Goldfeld-Quandt test for Heteroskedasticity',4,TRUE)
a<-table.row.end(a)
a<-table.row.start(a)
a<-table.element(a,'p-values',header=TRUE)
a<-table.element(a,'Alternative Hypothesis',3,header=TRUE)
a<-table.row.end(a)
a<-table.row.start(a)
a<-table.element(a,'breakpoint index',header=TRUE)
a<-table.element(a,'greater',header=TRUE)
a<-table.element(a,'2-sided',header=TRUE)
a<-table.element(a,'less',header=TRUE)
a<-table.row.end(a)
for (mypoint in kp3:nmkm3) {
a<-table.row.start(a)
a<-table.element(a,mypoint,header=TRUE)
a<-table.element(a,signif(gqarr[mypoint-kp3+1,1],6))
a<-table.element(a,signif(gqarr[mypoint-kp3+1,2],6))
a<-table.element(a,signif(gqarr[mypoint-kp3+1,3],6))
a<-table.row.end(a)
}
a<-table.end(a)
table.save(a,file='mytable5.tab')
a<-table.start()
a<-table.row.start(a)
a<-table.element(a,'Meta Analysis of Goldfeld-Quandt test for Heteroskedasticity',4,TRUE)
a<-table.row.end(a)
a<-table.row.start(a)
a<-table.element(a,'Description',header=TRUE)
a<-table.element(a,'# significant tests',header=TRUE)
a<-table.element(a,'% significant tests',header=TRUE)
a<-table.element(a,'OK/NOK',header=TRUE)
a<-table.row.end(a)
a<-table.row.start(a)
a<-table.element(a,'1% type I error level',header=TRUE)
a<-table.element(a,signif(numsignificant1,6))
a<-table.element(a,signif(numsignificant1/numgqtests,6))
if (numsignificant1/numgqtests < 0.01) dum <- 'OK' else dum <- 'NOK'
a<-table.element(a,dum)
a<-table.row.end(a)
a<-table.row.start(a)
a<-table.element(a,'5% type I error level',header=TRUE)
a<-table.element(a,signif(numsignificant5,6))
a<-table.element(a,signif(numsignificant5/numgqtests,6))
if (numsignificant5/numgqtests < 0.05) dum <- 'OK' else dum <- 'NOK'
a<-table.element(a,dum)
a<-table.row.end(a)
a<-table.row.start(a)
a<-table.element(a,'10% type I error level',header=TRUE)
a<-table.element(a,signif(numsignificant10,6))
a<-table.element(a,signif(numsignificant10/numgqtests,6))
if (numsignificant10/numgqtests < 0.1) dum <- 'OK' else dum <- 'NOK'
a<-table.element(a,dum)
a<-table.row.end(a)
a<-table.end(a)
table.save(a,file='mytable6.tab')
}