Free Statistics
of Irreproducible Research!
Description of Statistical Computation | |||||||||||||||||||||||||||||||||||||||||
|---|---|---|---|---|---|---|---|---|---|---|---|---|---|---|---|---|---|---|---|---|---|---|---|---|---|---|---|---|---|---|---|---|---|---|---|---|---|---|---|---|---|
| Author's title | |||||||||||||||||||||||||||||||||||||||||
| Author | *Unverified author* | ||||||||||||||||||||||||||||||||||||||||
| R Software Module | rwasp_univariatedataseries.wasp | ||||||||||||||||||||||||||||||||||||||||
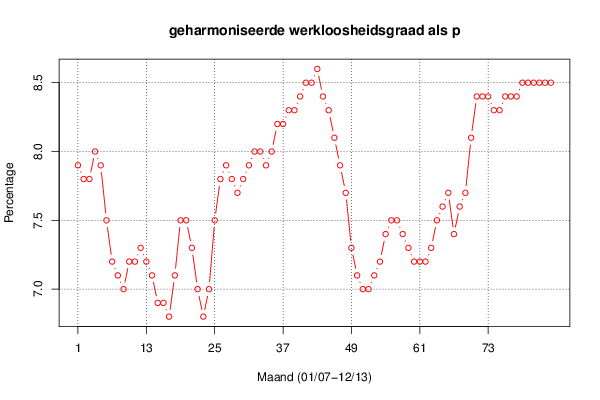
| Title produced by software | Univariate Data Series | ||||||||||||||||||||||||||||||||||||||||
| Date of computation | Wed, 24 Sep 2014 08:52:37 +0100 | ||||||||||||||||||||||||||||||||||||||||
| Cite this page as follows | Statistical Computations at FreeStatistics.org, Office for Research Development and Education, URL https://freestatistics.org/blog/index.php?v=date/2014/Sep/24/t1411545191cq6sms7mpv0ejhu.htm/, Retrieved Thu, 09 May 2024 20:06:23 +0000 | ||||||||||||||||||||||||||||||||||||||||
| Statistical Computations at FreeStatistics.org, Office for Research Development and Education, URL https://freestatistics.org/blog/index.php?pk=236096, Retrieved Thu, 09 May 2024 20:06:23 +0000 | |||||||||||||||||||||||||||||||||||||||||
| QR Codes: | |||||||||||||||||||||||||||||||||||||||||
|
| |||||||||||||||||||||||||||||||||||||||||
| Original text written by user: | |||||||||||||||||||||||||||||||||||||||||
| IsPrivate? | No (this computation is public) | ||||||||||||||||||||||||||||||||||||||||
| User-defined keywords | |||||||||||||||||||||||||||||||||||||||||
| Estimated Impact | 140 | ||||||||||||||||||||||||||||||||||||||||
Tree of Dependent Computations | |||||||||||||||||||||||||||||||||||||||||
| Family? (F = Feedback message, R = changed R code, M = changed R Module, P = changed Parameters, D = changed Data) | |||||||||||||||||||||||||||||||||||||||||
| - [Univariate Data Series] [] [2014-09-24 07:52:37] [a3906ca8ec50e2c552bcb8bd03430e54] [Current] | |||||||||||||||||||||||||||||||||||||||||
| Feedback Forum | |||||||||||||||||||||||||||||||||||||||||
Post a new message | |||||||||||||||||||||||||||||||||||||||||
Dataset | |||||||||||||||||||||||||||||||||||||||||
| Dataseries X: | |||||||||||||||||||||||||||||||||||||||||
7,9 7,8 7,8 8 7,9 7,5 7,2 7,1 7 7,2 7,2 7,3 7,2 7,1 6,9 6,9 6,8 7,1 7,5 7,5 7,3 7 6,8 7 7,5 7,8 7,9 7,8 7,7 7,8 7,9 8 8 7,9 8 8,2 8,2 8,3 8,3 8,4 8,5 8,5 8,6 8,4 8,3 8,1 7,9 7,7 7,3 7,1 7 7 7,1 7,2 7,4 7,5 7,5 7,4 7,3 7,2 7,2 7,2 7,3 7,5 7,6 7,7 7,4 7,6 7,7 8,1 8,4 8,4 8,4 8,3 8,3 8,4 8,4 8,4 8,5 8,5 8,5 8,5 8,5 8,5 | |||||||||||||||||||||||||||||||||||||||||
Tables (Output of Computation) | |||||||||||||||||||||||||||||||||||||||||
| |||||||||||||||||||||||||||||||||||||||||
Figures (Output of Computation) | |||||||||||||||||||||||||||||||||||||||||
Input Parameters & R Code | |||||||||||||||||||||||||||||||||||||||||
| Parameters (Session): | |||||||||||||||||||||||||||||||||||||||||
| par1 = geharmoniseerde werkloosheidsgraad als percentage van de beroepsbevolking van Belgi� ; par2 = www.belgostat.be ; par3 = geharmoniseerde werkloosheidsgraad als percentage van de beroepsbevolking van Belgi� ; par4 = 12 ; | |||||||||||||||||||||||||||||||||||||||||
| Parameters (R input): | |||||||||||||||||||||||||||||||||||||||||
| par1 = geharmoniseerde werkloosheidsgraad als percentage van de beroepsbevolking van Belgi� ; par2 = www.belgostat.be ; par3 = geharmoniseerde werkloosheidsgraad als percentage van de beroepsbevolking van Belgi� ; par4 = 12 ; | |||||||||||||||||||||||||||||||||||||||||
| R code (references can be found in the software module): | |||||||||||||||||||||||||||||||||||||||||
if (par4 != 'No season') { | |||||||||||||||||||||||||||||||||||||||||