Free Statistics
of Irreproducible Research!
Description of Statistical Computation | |||||||||||||||||||||||||||||||||||||||||
|---|---|---|---|---|---|---|---|---|---|---|---|---|---|---|---|---|---|---|---|---|---|---|---|---|---|---|---|---|---|---|---|---|---|---|---|---|---|---|---|---|---|
| Author's title | |||||||||||||||||||||||||||||||||||||||||
| Author | *Unverified author* | ||||||||||||||||||||||||||||||||||||||||
| R Software Module | rwasp_univariatedataseries.wasp | ||||||||||||||||||||||||||||||||||||||||
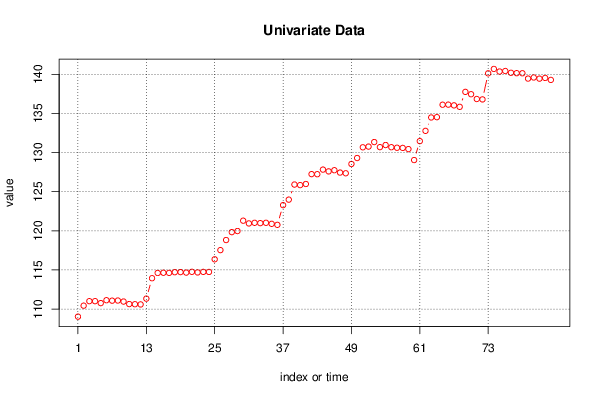
| Title produced by software | Univariate Data Series | ||||||||||||||||||||||||||||||||||||||||
| Date of computation | Fri, 26 Sep 2014 08:40:25 +0100 | ||||||||||||||||||||||||||||||||||||||||
| Cite this page as follows | Statistical Computations at FreeStatistics.org, Office for Research Development and Education, URL https://freestatistics.org/blog/index.php?v=date/2014/Sep/26/t1411717266mmyzyn3e1qpydws.htm/, Retrieved Mon, 13 May 2024 06:31:39 +0000 | ||||||||||||||||||||||||||||||||||||||||
| Statistical Computations at FreeStatistics.org, Office for Research Development and Education, URL https://freestatistics.org/blog/index.php?pk=236204, Retrieved Mon, 13 May 2024 06:31:39 +0000 | |||||||||||||||||||||||||||||||||||||||||
| QR Codes: | |||||||||||||||||||||||||||||||||||||||||
|
| |||||||||||||||||||||||||||||||||||||||||
| Original text written by user: | |||||||||||||||||||||||||||||||||||||||||
| IsPrivate? | No (this computation is public) | ||||||||||||||||||||||||||||||||||||||||
| User-defined keywords | |||||||||||||||||||||||||||||||||||||||||
| Estimated Impact | 105 | ||||||||||||||||||||||||||||||||||||||||
Tree of Dependent Computations | |||||||||||||||||||||||||||||||||||||||||
| Family? (F = Feedback message, R = changed R code, M = changed R Module, P = changed Parameters, D = changed Data) | |||||||||||||||||||||||||||||||||||||||||
| - [Univariate Data Series] [] [2014-09-26 07:40:25] [af43fcfc4e3257f4a3dbe682dec77e63] [Current] - RMPD [Histogram] [] [2014-09-28 14:46:37] [e3e74a13bc29a05964909545a1716cbb] - RMPD [Histogram] [] [2014-09-28 14:47:54] [e3e74a13bc29a05964909545a1716cbb] - RMPD [Histogram] [] [2014-09-28 14:49:20] [e3e74a13bc29a05964909545a1716cbb] - RMPD [Kernel Density Estimation] [] [2014-09-28 14:57:18] [e3e74a13bc29a05964909545a1716cbb] - RMPD [Kernel Density Estimation] [] [2014-09-28 14:58:34] [e3e74a13bc29a05964909545a1716cbb] - RMPD [Kernel Density Estimation] [] [2014-09-28 14:59:37] [e3e74a13bc29a05964909545a1716cbb] | |||||||||||||||||||||||||||||||||||||||||
| Feedback Forum | |||||||||||||||||||||||||||||||||||||||||
Post a new message | |||||||||||||||||||||||||||||||||||||||||
Dataset | |||||||||||||||||||||||||||||||||||||||||
| Dataseries X: | |||||||||||||||||||||||||||||||||||||||||
109,03 110,43 111,01 111,01 110,76 111,13 111,07 111,09 110,96 110,64 110,62 110,59 111,33 113,94 114,61 114,64 114,62 114,71 114,72 114,66 114,76 114,68 114,75 114,74 116,36 117,53 118,82 119,83 119,97 121,29 120,94 121,02 120,98 121,02 120,89 120,76 123,28 123,98 125,91 125,84 125,98 127,24 127,23 127,82 127,59 127,74 127,44 127,35 128,54 129,3 130,67 130,76 131,34 130,69 130,96 130,68 130,61 130,59 130,44 129,04 131,46 132,77 134,48 134,52 136,11 136,12 136,03 135,84 137,75 137,45 136,84 136,79 140,12 140,68 140,35 140,42 140,19 140,14 140,13 139,45 139,59 139,44 139,53 139,28 | |||||||||||||||||||||||||||||||||||||||||
Tables (Output of Computation) | |||||||||||||||||||||||||||||||||||||||||
| |||||||||||||||||||||||||||||||||||||||||
Figures (Output of Computation) | |||||||||||||||||||||||||||||||||||||||||
Input Parameters & R Code | |||||||||||||||||||||||||||||||||||||||||
| Parameters (Session): | |||||||||||||||||||||||||||||||||||||||||
| par4 = 12 ; | |||||||||||||||||||||||||||||||||||||||||
| Parameters (R input): | |||||||||||||||||||||||||||||||||||||||||
| par1 = ; par2 = ; par3 = ; par4 = 12 ; | |||||||||||||||||||||||||||||||||||||||||
| R code (references can be found in the software module): | |||||||||||||||||||||||||||||||||||||||||
if (par4 != 'No season') { | |||||||||||||||||||||||||||||||||||||||||