Free Statistics

of Irreproducible Research!

Author's title

Author*Unverified author*
R Software Modulerwasp_histogram.wasp
Title produced by softwareHistogram
Date of computationFri, 26 Sep 2014 13:33:51 +0100
Cite this page as followsStatistical Computations at FreeStatistics.org, Office for Research Development and Education, URL https://freestatistics.org/blog/index.php?v=date/2014/Sep/26/t1411734912cc2s4rh5ik15bdq.htm/, Retrieved Mon, 13 May 2024 12:23:50 +0000
Statistical Computations at FreeStatistics.org, Office for Research Development and Education, URL https://freestatistics.org/blog/index.php?pk=236279, Retrieved Mon, 13 May 2024 12:23:50 +0000
QR Codes:

Original text written by user:
IsPrivate?No (this computation is public)
User-defined keywords
Estimated Impact70
Family? (F = Feedback message, R = changed R code, M = changed R Module, P = changed Parameters, D = changed Data)
-       [Histogram] [] [2014-09-26 12:33:51] [5cac5f97919544233533b60e31cabb24] [Current]
- RMP     [Kernel Density Estimation] [] [2014-09-26 14:15:19] [e29098b8cc4cab563e048a00dfb641bb]
Feedback Forum

Post a new message
Dataseries X:
8378669
7557530
8656721
7729873
7067002
7222189
6758161
6745665
8203660
8799755
7995151
6844694
7400186
6146183
6793027
5815146
5993505
5838016
5926815
5642890
7120621
7781743
7638921
5886070
7358890
6981189
8423532
6819313
6727221
6923349
7578240
7228898
8988846
8404694
9601659
8213138
8434646
8466539
9106270
8438555
7723821
7538413
7199881
8168314
9045790
8544483
9020709
7932021
8435986
7920357
8333659
7415547
7770392
8188878
8092465
7188528
8152373
9025069
9233973
6916290
8171721
7012501
8779456
7308709
8084547
8255978
7658071
7371877
8780827
10116778
9567175
7455902


Summary of computational transaction
Raw Inputview raw input (R code)
Raw Outputview raw output of R engine
Computing time1 seconds
R Server'Herman Ole Andreas Wold' @ wold.wessa.net

\begin{tabular}{lllllllll}
\hline
Summary of computational transaction \tabularnewline
Raw Input & view raw input (R code)  \tabularnewline
Raw Output & view raw output of R engine  \tabularnewline
Computing time & 1 seconds \tabularnewline
R Server & 'Herman Ole Andreas Wold' @ wold.wessa.net \tabularnewline
\hline
\end{tabular}
%Source: https://freestatistics.org/blog/index.php?pk=236279&T=0

[TABLE]
[ROW][C]Summary of computational transaction[/C][/ROW]
[ROW][C]Raw Input[/C][C]view raw input (R code) [/C][/ROW]
[ROW][C]Raw Output[/C][C]view raw output of R engine [/C][/ROW]
[ROW][C]Computing time[/C][C]1 seconds[/C][/ROW]
[ROW][C]R Server[/C][C]'Herman Ole Andreas Wold' @ wold.wessa.net[/C][/ROW]
[/TABLE]
Source: https://freestatistics.org/blog/index.php?pk=236279&T=0

Globally Unique Identifier (entire table): ba.freestatistics.org/blog/index.php?pk=236279&T=0

As an alternative you can also use a QR Code:  

The GUIDs for individual cells are displayed in the table below:

Summary of computational transaction
Raw Inputview raw input (R code)
Raw Outputview raw output of R engine
Computing time1 seconds
R Server'Herman Ole Andreas Wold' @ wold.wessa.net


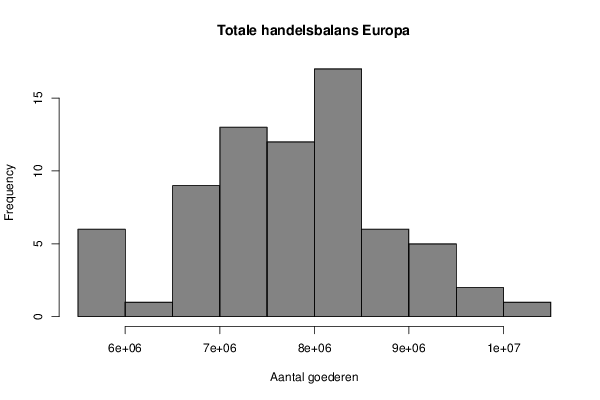
Frequency Table (Histogram)
BinsMidpointAbs. FrequencyRel. FrequencyCumul. Rel. Freq.Density
[5500000,6e+06[575000060.0833330.0833330
[6e+06,6500000[625000010.0138890.0972220
[6500000,7e+06[675000090.1250.2222220
[7e+06,7500000[7250000130.1805560.4027780
[7500000,8e+06[7750000120.1666670.5694440
[8e+06,8500000[8250000170.2361110.8055560
[8500000,9e+06[875000060.0833330.8888890
[9e+06,9500000[925000050.0694440.9583330
[9500000,1e+07[975000020.0277780.9861110
[1e+07,10500000]1025000010.01388910

\begin{tabular}{lllllllll}
\hline
Frequency Table (Histogram) \tabularnewline
Bins & Midpoint & Abs. Frequency & Rel. Frequency & Cumul. Rel. Freq. & Density \tabularnewline
[5500000,6e+06[ & 5750000 & 6 & 0.083333 & 0.083333 & 0 \tabularnewline
[6e+06,6500000[ & 6250000 & 1 & 0.013889 & 0.097222 & 0 \tabularnewline
[6500000,7e+06[ & 6750000 & 9 & 0.125 & 0.222222 & 0 \tabularnewline
[7e+06,7500000[ & 7250000 & 13 & 0.180556 & 0.402778 & 0 \tabularnewline
[7500000,8e+06[ & 7750000 & 12 & 0.166667 & 0.569444 & 0 \tabularnewline
[8e+06,8500000[ & 8250000 & 17 & 0.236111 & 0.805556 & 0 \tabularnewline
[8500000,9e+06[ & 8750000 & 6 & 0.083333 & 0.888889 & 0 \tabularnewline
[9e+06,9500000[ & 9250000 & 5 & 0.069444 & 0.958333 & 0 \tabularnewline
[9500000,1e+07[ & 9750000 & 2 & 0.027778 & 0.986111 & 0 \tabularnewline
[1e+07,10500000] & 10250000 & 1 & 0.013889 & 1 & 0 \tabularnewline
\hline
\end{tabular}
%Source: https://freestatistics.org/blog/index.php?pk=236279&T=1

[TABLE]
[ROW][C]Frequency Table (Histogram)[/C][/ROW]
[ROW][C]Bins[/C][C]Midpoint[/C][C]Abs. Frequency[/C][C]Rel. Frequency[/C][C]Cumul. Rel. Freq.[/C][C]Density[/C][/ROW]
[ROW][C][5500000,6e+06[[/C][C]5750000[/C][C]6[/C][C]0.083333[/C][C]0.083333[/C][C]0[/C][/ROW]
[ROW][C][6e+06,6500000[[/C][C]6250000[/C][C]1[/C][C]0.013889[/C][C]0.097222[/C][C]0[/C][/ROW]
[ROW][C][6500000,7e+06[[/C][C]6750000[/C][C]9[/C][C]0.125[/C][C]0.222222[/C][C]0[/C][/ROW]
[ROW][C][7e+06,7500000[[/C][C]7250000[/C][C]13[/C][C]0.180556[/C][C]0.402778[/C][C]0[/C][/ROW]
[ROW][C][7500000,8e+06[[/C][C]7750000[/C][C]12[/C][C]0.166667[/C][C]0.569444[/C][C]0[/C][/ROW]
[ROW][C][8e+06,8500000[[/C][C]8250000[/C][C]17[/C][C]0.236111[/C][C]0.805556[/C][C]0[/C][/ROW]
[ROW][C][8500000,9e+06[[/C][C]8750000[/C][C]6[/C][C]0.083333[/C][C]0.888889[/C][C]0[/C][/ROW]
[ROW][C][9e+06,9500000[[/C][C]9250000[/C][C]5[/C][C]0.069444[/C][C]0.958333[/C][C]0[/C][/ROW]
[ROW][C][9500000,1e+07[[/C][C]9750000[/C][C]2[/C][C]0.027778[/C][C]0.986111[/C][C]0[/C][/ROW]
[ROW][C][1e+07,10500000][/C][C]10250000[/C][C]1[/C][C]0.013889[/C][C]1[/C][C]0[/C][/ROW]
[/TABLE]
Source: https://freestatistics.org/blog/index.php?pk=236279&T=1

Globally Unique Identifier (entire table): ba.freestatistics.org/blog/index.php?pk=236279&T=1

As an alternative you can also use a QR Code:  

The GUIDs for individual cells are displayed in the table below:

Frequency Table (Histogram)
BinsMidpointAbs. FrequencyRel. FrequencyCumul. Rel. Freq.Density
[5500000,6e+06[575000060.0833330.0833330
[6e+06,6500000[625000010.0138890.0972220
[6500000,7e+06[675000090.1250.2222220
[7e+06,7500000[7250000130.1805560.4027780
[7500000,8e+06[7750000120.1666670.5694440
[8e+06,8500000[8250000170.2361110.8055560
[8500000,9e+06[875000060.0833330.8888890
[9e+06,9500000[925000050.0694440.9583330
[9500000,1e+07[975000020.0277780.9861110
[1e+07,10500000]1025000010.01388910


Parameters (Session):
par1 = 10 ; par2 = grey ; par3 = FALSE ; par4 = Interval/Ratio ;
Parameters (R input):
par1 = 10 ; par2 = grey ; par3 = FALSE ; par4 = Interval/Ratio ;
R code (references can be found in the software module):
par1 <- as.numeric(par1)
if (par3 == 'TRUE') par3 <- TRUE
if (par3 == 'FALSE') par3 <- FALSE
if (par4 == 'Unknown') par1 <- as.numeric(par1)
if (par4 == 'Interval/Ratio') par1 <- as.numeric(par1)
if (par4 == '3-point Likert') par1 <- c(1:3 - 0.5, 3.5)
if (par4 == '4-point Likert') par1 <- c(1:4 - 0.5, 4.5)
if (par4 == '5-point Likert') par1 <- c(1:5 - 0.5, 5.5)
if (par4 == '6-point Likert') par1 <- c(1:6 - 0.5, 6.5)
if (par4 == '7-point Likert') par1 <- c(1:7 - 0.5, 7.5)
if (par4 == '8-point Likert') par1 <- c(1:8 - 0.5, 8.5)
if (par4 == '9-point Likert') par1 <- c(1:9 - 0.5, 9.5)
if (par4 == '10-point Likert') par1 <- c(1:10 - 0.5, 10.5)
bitmap(file='test1.png')
if(is.numeric(x[1])) {
if (is.na(par1)) {
myhist<-hist(x,col=par2,main=main,xlab=xlab,right=par3)
} else {
if (par1 < 0) par1 <- 3
if (par1 > 50) par1 <- 50
myhist<-hist(x,breaks=par1,col=par2,main=main,xlab=xlab,right=par3)
}
} else {
plot(mytab <- table(x),col=par2,main='Frequency Plot',xlab=xlab,ylab='Absolute Frequency')
}
dev.off()
if(is.numeric(x[1])) {
myhist
n <- length(x)
load(file='createtable')
a<-table.start()
a<-table.row.start(a)
a<-table.element(a,hyperlink('histogram.htm','Frequency Table (Histogram)',''),6,TRUE)
a<-table.row.end(a)
a<-table.row.start(a)
a<-table.element(a,'Bins',header=TRUE)
a<-table.element(a,'Midpoint',header=TRUE)
a<-table.element(a,'Abs. Frequency',header=TRUE)
a<-table.element(a,'Rel. Frequency',header=TRUE)
a<-table.element(a,'Cumul. Rel. Freq.',header=TRUE)
a<-table.element(a,'Density',header=TRUE)
a<-table.row.end(a)
crf <- 0
if (par3 == FALSE) mybracket <- '[' else mybracket <- ']'
mynumrows <- (length(myhist$breaks)-1)
for (i in 1:mynumrows) {
a<-table.row.start(a)
if (i == 1)
dum <- paste('[',myhist$breaks[i],sep='')
else
dum <- paste(mybracket,myhist$breaks[i],sep='')
dum <- paste(dum,myhist$breaks[i+1],sep=',')
if (i==mynumrows)
dum <- paste(dum,']',sep='')
else
dum <- paste(dum,mybracket,sep='')
a<-table.element(a,dum,header=TRUE)
a<-table.element(a,myhist$mids[i])
a<-table.element(a,myhist$counts[i])
rf <- myhist$counts[i]/n
crf <- crf + rf
a<-table.element(a,round(rf,6))
a<-table.element(a,round(crf,6))
a<-table.element(a,round(myhist$density[i],6))
a<-table.row.end(a)
}
a<-table.end(a)
table.save(a,file='mytable.tab')
} else {
mytab
reltab <- mytab / sum(mytab)
n <- length(mytab)
load(file='createtable')
a<-table.start()
a<-table.row.start(a)
a<-table.element(a,'Frequency Table (Categorical Data)',3,TRUE)
a<-table.row.end(a)
a<-table.row.start(a)
a<-table.element(a,'Category',header=TRUE)
a<-table.element(a,'Abs. Frequency',header=TRUE)
a<-table.element(a,'Rel. Frequency',header=TRUE)
a<-table.row.end(a)
for (i in 1:n) {
a<-table.row.start(a)
a<-table.element(a,labels(mytab)$x[i],header=TRUE)
a<-table.element(a,mytab[i])
a<-table.element(a,round(reltab[i],4))
a<-table.row.end(a)
}
a<-table.end(a)
table.save(a,file='mytable1.tab')
}