Free Statistics

of Irreproducible Research!

Author's title

Author*Unverified author*
R Software Modulerwasp_density.wasp
Title produced by softwareKernel Density Estimation
Date of computationFri, 26 Sep 2014 14:16:00 +0100
Cite this page as followsStatistical Computations at FreeStatistics.org, Office for Research Development and Education, URL https://freestatistics.org/blog/index.php?v=date/2014/Sep/26/t14117373900e9yylbv98peue7.htm/, Retrieved Mon, 13 May 2024 07:12:53 +0000
Statistical Computations at FreeStatistics.org, Office for Research Development and Education, URL https://freestatistics.org/blog/index.php?pk=236300, Retrieved Mon, 13 May 2024 07:12:53 +0000
QR Codes:

Original text written by user:
IsPrivate?No (this computation is public)
User-defined keywords
Estimated Impact86
Family? (F = Feedback message, R = changed R code, M = changed R Module, P = changed Parameters, D = changed Data)
-     [Histogram] [] [2014-09-19 18:33:16] [24d0a9e7d3e0bd5045c9a6a8ddd5f7fc]
- RMP     [Kernel Density Estimation] [] [2014-09-26 13:16:00] [f149622c9d515219c1fb7480e3dc01f1] [Current]
Feedback Forum

Post a new message
Dataseries X:
0.52
0.54
0.54
0.54
0.54
0.54
0.54
0.54
0.54
0.54
0.54
0.54
0.59
0.59
0.59
0.59
0.59
0.59
0.59
0.59
0.59
0.59
0.59
0.59
0.59
0.59
0.59
0.59
0.59
0.59
0.59
0.59
0.59
0.59
0.59
0.59
0.61
0.61
0.61
0.61
0.61
0.61
0.61
0.61
0.61
0.61
0.61
0.61
0.65
0.65
0.65
0.65
0.65
0.65
0.65
0.65
0.65
0.65
0.65
0.65
0.67
0.67
0.67
0.67
0.67
0.67
0.67
0.67
0.67
0.67
0.67
0.67


Summary of computational transaction
Raw Inputview raw input (R code)
Raw Outputview raw output of R engine
Computing time3 seconds
R Server'Gwilym Jenkins' @ jenkins.wessa.net

\begin{tabular}{lllllllll}
\hline
Summary of computational transaction \tabularnewline
Raw Input & view raw input (R code)  \tabularnewline
Raw Output & view raw output of R engine  \tabularnewline
Computing time & 3 seconds \tabularnewline
R Server & 'Gwilym Jenkins' @ jenkins.wessa.net \tabularnewline
\hline
\end{tabular}
%Source: https://freestatistics.org/blog/index.php?pk=236300&T=0

[TABLE]
[ROW][C]Summary of computational transaction[/C][/ROW]
[ROW][C]Raw Input[/C][C]view raw input (R code) [/C][/ROW]
[ROW][C]Raw Output[/C][C]view raw output of R engine [/C][/ROW]
[ROW][C]Computing time[/C][C]3 seconds[/C][/ROW]
[ROW][C]R Server[/C][C]'Gwilym Jenkins' @ jenkins.wessa.net[/C][/ROW]
[/TABLE]
Source: https://freestatistics.org/blog/index.php?pk=236300&T=0

Globally Unique Identifier (entire table): ba.freestatistics.org/blog/index.php?pk=236300&T=0

As an alternative you can also use a QR Code:  

The GUIDs for individual cells are displayed in the table below:

Summary of computational transaction
Raw Inputview raw input (R code)
Raw Outputview raw output of R engine
Computing time3 seconds
R Server'Gwilym Jenkins' @ jenkins.wessa.net


Properties of Density Trace
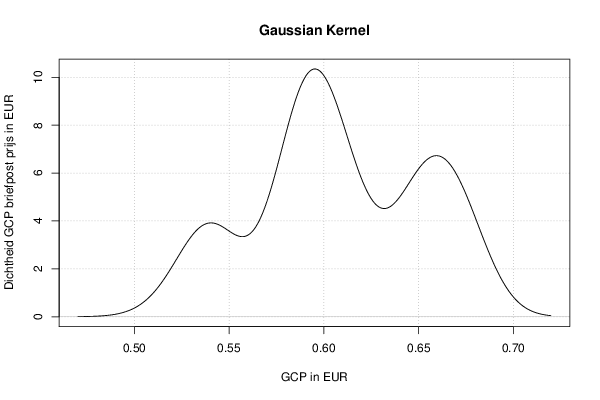
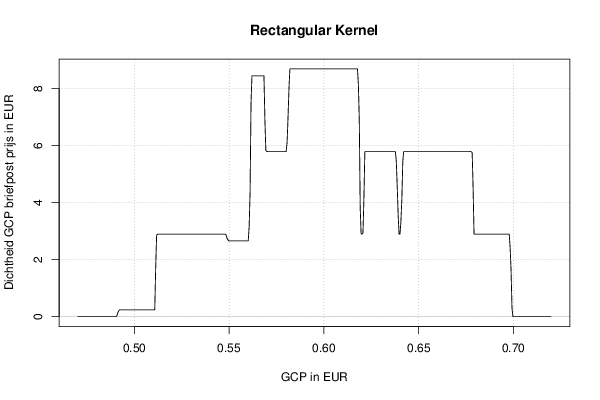
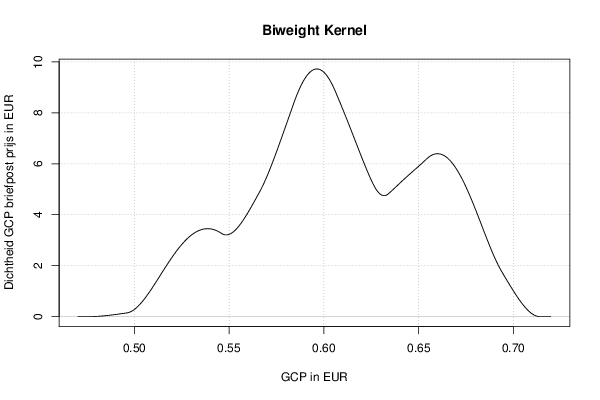
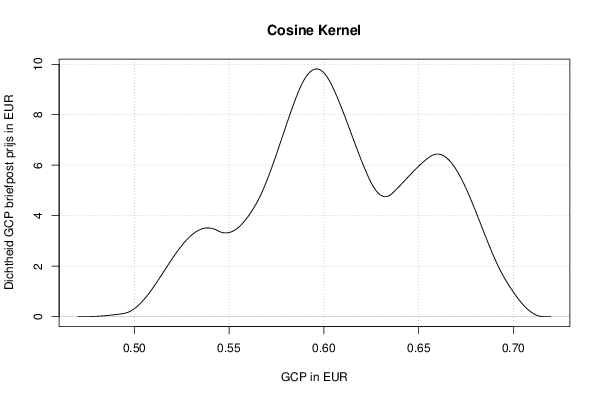
Bandwidth0.0166057176659867
#Observations72

\begin{tabular}{lllllllll}
\hline
Properties of Density Trace \tabularnewline
Bandwidth & 0.0166057176659867 \tabularnewline
#Observations & 72 \tabularnewline
\hline
\end{tabular}
%Source: https://freestatistics.org/blog/index.php?pk=236300&T=1

[TABLE]
[ROW][C]Properties of Density Trace[/C][/ROW]
[ROW][C]Bandwidth[/C][C]0.0166057176659867[/C][/ROW]
[ROW][C]#Observations[/C][C]72[/C][/ROW]
[/TABLE]
Source: https://freestatistics.org/blog/index.php?pk=236300&T=1

Globally Unique Identifier (entire table): ba.freestatistics.org/blog/index.php?pk=236300&T=1

As an alternative you can also use a QR Code:  

The GUIDs for individual cells are displayed in the table below:

Properties of Density Trace
Bandwidth0.0166057176659867
#Observations72


Maximum Density Values
Kernelx-valuemax. density
Gaussian0.59524426057338210.3496629549844
Epanechnikov0.5967098240136719.44795723561294
Rectangular0.5820541896107798.69204030808325
Triangular0.59035904910575110.243528701287
Biweight0.5962213028669089.72192825538787
Cosine0.5962213028669089.81429112001274
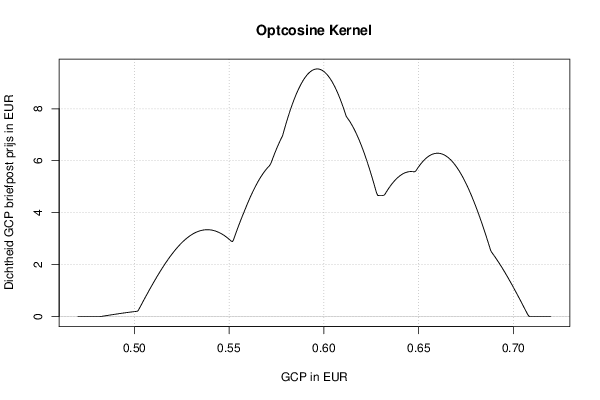
Optcosine0.5962213028669089.53154183770053

\begin{tabular}{lllllllll}
\hline
Maximum Density Values \tabularnewline
Kernel & x-value & max. density \tabularnewline
Gaussian & 0.595244260573382 & 10.3496629549844 \tabularnewline
Epanechnikov & 0.596709824013671 & 9.44795723561294 \tabularnewline
Rectangular & 0.582054189610779 & 8.69204030808325 \tabularnewline
Triangular & 0.590359049105751 & 10.243528701287 \tabularnewline
Biweight & 0.596221302866908 & 9.72192825538787 \tabularnewline
Cosine & 0.596221302866908 & 9.81429112001274 \tabularnewline
Optcosine & 0.596221302866908 & 9.53154183770053 \tabularnewline
 \hline
\end{tabular}
%Source: https://freestatistics.org/blog/index.php?pk=236300&T=2

[TABLE]
[ROW][C]Maximum Density Values[/C][/ROW]
[ROW][C]Kernel[/C][C]x-value[/C][C]max. density[/C][/ROW]
[ROW][C]Gaussian[/C][C]0.595244260573382[/C][C]10.3496629549844[/C][/ROW]
[ROW][C]Epanechnikov[/C][C]0.596709824013671[/C][C]9.44795723561294[/C][/ROW]
[ROW][C]Rectangular[/C][C]0.582054189610779[/C][C]8.69204030808325[/C][/ROW]
[ROW][C]Triangular[/C][C]0.590359049105751[/C][C]10.243528701287[/C][/ROW]
[ROW][C]Biweight[/C][C]0.596221302866908[/C][C]9.72192825538787[/C][/ROW]
[ROW][C]Cosine[/C][C]0.596221302866908[/C][C]9.81429112001274[/C][/ROW]
[ROW][C]Optcosine[/C][C]0.596221302866908[/C][C]9.53154183770053[/C][/ROW]
 [/TABLE]
Source: https://freestatistics.org/blog/index.php?pk=236300&T=2

Globally Unique Identifier (entire table): ba.freestatistics.org/blog/index.php?pk=236300&T=2

As an alternative you can also use a QR Code:  

The GUIDs for individual cells are displayed in the table below:

Maximum Density Values
Kernelx-valuemax. density
Gaussian0.59524426057338210.3496629549844
Epanechnikov0.5967098240136719.44795723561294
Rectangular0.5820541896107798.69204030808325
Triangular0.59035904910575110.243528701287
Biweight0.5962213028669089.72192825538787
Cosine0.5962213028669089.81429112001274
Optcosine0.5962213028669089.53154183770053


Maximum Density Values
Kernelx-valuemax. density
Gaussian0.59524426057338210.3496629549844
Epanechnikov0.5967098240136719.44795723561294
Rectangular0.5825427107575428.69204030808325
Triangular0.59035904910575110.243528701287
Biweight0.5962213028669089.72192825538787
Cosine0.5962213028669089.81429112001274
Optcosine0.5962213028669089.53154183770053

\begin{tabular}{lllllllll}
\hline
Maximum Density Values \tabularnewline
Kernel & x-value & max. density \tabularnewline
Gaussian & 0.595244260573382 & 10.3496629549844 \tabularnewline
Epanechnikov & 0.596709824013671 & 9.44795723561294 \tabularnewline
Rectangular & 0.582542710757542 & 8.69204030808325 \tabularnewline
Triangular & 0.590359049105751 & 10.243528701287 \tabularnewline
Biweight & 0.596221302866908 & 9.72192825538787 \tabularnewline
Cosine & 0.596221302866908 & 9.81429112001274 \tabularnewline
Optcosine & 0.596221302866908 & 9.53154183770053 \tabularnewline
 \hline
\end{tabular}
%Source: https://freestatistics.org/blog/index.php?pk=236300&T=3

[TABLE]
[ROW][C]Maximum Density Values[/C][/ROW]
[ROW][C]Kernel[/C][C]x-value[/C][C]max. density[/C][/ROW]
[ROW][C]Gaussian[/C][C]0.595244260573382[/C][C]10.3496629549844[/C][/ROW]
[ROW][C]Epanechnikov[/C][C]0.596709824013671[/C][C]9.44795723561294[/C][/ROW]
[ROW][C]Rectangular[/C][C]0.582542710757542[/C][C]8.69204030808325[/C][/ROW]
[ROW][C]Triangular[/C][C]0.590359049105751[/C][C]10.243528701287[/C][/ROW]
[ROW][C]Biweight[/C][C]0.596221302866908[/C][C]9.72192825538787[/C][/ROW]
[ROW][C]Cosine[/C][C]0.596221302866908[/C][C]9.81429112001274[/C][/ROW]
[ROW][C]Optcosine[/C][C]0.596221302866908[/C][C]9.53154183770053[/C][/ROW]
 [/TABLE]
Source: https://freestatistics.org/blog/index.php?pk=236300&T=3

Globally Unique Identifier (entire table): ba.freestatistics.org/blog/index.php?pk=236300&T=3

As an alternative you can also use a QR Code:  

The GUIDs for individual cells are displayed in the table below:

Maximum Density Values
Kernelx-valuemax. density
Gaussian0.59524426057338210.3496629549844
Epanechnikov0.5967098240136719.44795723561294
Rectangular0.5825427107575428.69204030808325
Triangular0.59035904910575110.243528701287
Biweight0.5962213028669089.72192825538787
Cosine0.5962213028669089.81429112001274
Optcosine0.5962213028669089.53154183770053


Maximum Density Values
Kernelx-valuemax. density
Gaussian0.59524426057338210.3496629549844
Epanechnikov0.5967098240136719.44795723561294
Rectangular0.5830312319043058.69204030808325
Triangular0.59035904910575110.243528701287
Biweight0.5962213028669089.72192825538787
Cosine0.5962213028669089.81429112001274
Optcosine0.5962213028669089.53154183770053

\begin{tabular}{lllllllll}
\hline
Maximum Density Values \tabularnewline
Kernel & x-value & max. density \tabularnewline
Gaussian & 0.595244260573382 & 10.3496629549844 \tabularnewline
Epanechnikov & 0.596709824013671 & 9.44795723561294 \tabularnewline
Rectangular & 0.583031231904305 & 8.69204030808325 \tabularnewline
Triangular & 0.590359049105751 & 10.243528701287 \tabularnewline
Biweight & 0.596221302866908 & 9.72192825538787 \tabularnewline
Cosine & 0.596221302866908 & 9.81429112001274 \tabularnewline
Optcosine & 0.596221302866908 & 9.53154183770053 \tabularnewline
 \hline
\end{tabular}
%Source: https://freestatistics.org/blog/index.php?pk=236300&T=4

[TABLE]
[ROW][C]Maximum Density Values[/C][/ROW]
[ROW][C]Kernel[/C][C]x-value[/C][C]max. density[/C][/ROW]
[ROW][C]Gaussian[/C][C]0.595244260573382[/C][C]10.3496629549844[/C][/ROW]
[ROW][C]Epanechnikov[/C][C]0.596709824013671[/C][C]9.44795723561294[/C][/ROW]
[ROW][C]Rectangular[/C][C]0.583031231904305[/C][C]8.69204030808325[/C][/ROW]
[ROW][C]Triangular[/C][C]0.590359049105751[/C][C]10.243528701287[/C][/ROW]
[ROW][C]Biweight[/C][C]0.596221302866908[/C][C]9.72192825538787[/C][/ROW]
[ROW][C]Cosine[/C][C]0.596221302866908[/C][C]9.81429112001274[/C][/ROW]
[ROW][C]Optcosine[/C][C]0.596221302866908[/C][C]9.53154183770053[/C][/ROW]
 [/TABLE]
Source: https://freestatistics.org/blog/index.php?pk=236300&T=4

Globally Unique Identifier (entire table): ba.freestatistics.org/blog/index.php?pk=236300&T=4

As an alternative you can also use a QR Code:  

The GUIDs for individual cells are displayed in the table below:

Maximum Density Values
Kernelx-valuemax. density
Gaussian0.59524426057338210.3496629549844
Epanechnikov0.5967098240136719.44795723561294
Rectangular0.5830312319043058.69204030808325
Triangular0.59035904910575110.243528701287
Biweight0.5962213028669089.72192825538787
Cosine0.5962213028669089.81429112001274
Optcosine0.5962213028669089.53154183770053


Maximum Density Values
Kernelx-valuemax. density
Gaussian0.59524426057338210.3496629549844
Epanechnikov0.5967098240136719.44795723561294
Rectangular0.5835197530510688.69204030808325
Triangular0.59035904910575110.243528701287
Biweight0.5962213028669089.72192825538787
Cosine0.5962213028669089.81429112001274
Optcosine0.5962213028669089.53154183770053

\begin{tabular}{lllllllll}
\hline
Maximum Density Values \tabularnewline
Kernel & x-value & max. density \tabularnewline
Gaussian & 0.595244260573382 & 10.3496629549844 \tabularnewline
Epanechnikov & 0.596709824013671 & 9.44795723561294 \tabularnewline
Rectangular & 0.583519753051068 & 8.69204030808325 \tabularnewline
Triangular & 0.590359049105751 & 10.243528701287 \tabularnewline
Biweight & 0.596221302866908 & 9.72192825538787 \tabularnewline
Cosine & 0.596221302866908 & 9.81429112001274 \tabularnewline
Optcosine & 0.596221302866908 & 9.53154183770053 \tabularnewline
 \hline
\end{tabular}
%Source: https://freestatistics.org/blog/index.php?pk=236300&T=5

[TABLE]
[ROW][C]Maximum Density Values[/C][/ROW]
[ROW][C]Kernel[/C][C]x-value[/C][C]max. density[/C][/ROW]
[ROW][C]Gaussian[/C][C]0.595244260573382[/C][C]10.3496629549844[/C][/ROW]
[ROW][C]Epanechnikov[/C][C]0.596709824013671[/C][C]9.44795723561294[/C][/ROW]
[ROW][C]Rectangular[/C][C]0.583519753051068[/C][C]8.69204030808325[/C][/ROW]
[ROW][C]Triangular[/C][C]0.590359049105751[/C][C]10.243528701287[/C][/ROW]
[ROW][C]Biweight[/C][C]0.596221302866908[/C][C]9.72192825538787[/C][/ROW]
[ROW][C]Cosine[/C][C]0.596221302866908[/C][C]9.81429112001274[/C][/ROW]
[ROW][C]Optcosine[/C][C]0.596221302866908[/C][C]9.53154183770053[/C][/ROW]
 [/TABLE]
Source: https://freestatistics.org/blog/index.php?pk=236300&T=5

Globally Unique Identifier (entire table): ba.freestatistics.org/blog/index.php?pk=236300&T=5

As an alternative you can also use a QR Code:  

The GUIDs for individual cells are displayed in the table below:

Maximum Density Values
Kernelx-valuemax. density
Gaussian0.59524426057338210.3496629549844
Epanechnikov0.5967098240136719.44795723561294
Rectangular0.5835197530510688.69204030808325
Triangular0.59035904910575110.243528701287
Biweight0.5962213028669089.72192825538787
Cosine0.5962213028669089.81429112001274
Optcosine0.5962213028669089.53154183770053


Maximum Density Values
Kernelx-valuemax. density
Gaussian0.59524426057338210.3496629549844
Epanechnikov0.5967098240136719.44795723561294
Rectangular0.5840082741978318.69204030808325
Triangular0.59035904910575110.243528701287
Biweight0.5962213028669089.72192825538787
Cosine0.5962213028669089.81429112001274
Optcosine0.5962213028669089.53154183770053

\begin{tabular}{lllllllll}
\hline
Maximum Density Values \tabularnewline
Kernel & x-value & max. density \tabularnewline
Gaussian & 0.595244260573382 & 10.3496629549844 \tabularnewline
Epanechnikov & 0.596709824013671 & 9.44795723561294 \tabularnewline
Rectangular & 0.584008274197831 & 8.69204030808325 \tabularnewline
Triangular & 0.590359049105751 & 10.243528701287 \tabularnewline
Biweight & 0.596221302866908 & 9.72192825538787 \tabularnewline
Cosine & 0.596221302866908 & 9.81429112001274 \tabularnewline
Optcosine & 0.596221302866908 & 9.53154183770053 \tabularnewline
 \hline
\end{tabular}
%Source: https://freestatistics.org/blog/index.php?pk=236300&T=6

[TABLE]
[ROW][C]Maximum Density Values[/C][/ROW]
[ROW][C]Kernel[/C][C]x-value[/C][C]max. density[/C][/ROW]
[ROW][C]Gaussian[/C][C]0.595244260573382[/C][C]10.3496629549844[/C][/ROW]
[ROW][C]Epanechnikov[/C][C]0.596709824013671[/C][C]9.44795723561294[/C][/ROW]
[ROW][C]Rectangular[/C][C]0.584008274197831[/C][C]8.69204030808325[/C][/ROW]
[ROW][C]Triangular[/C][C]0.590359049105751[/C][C]10.243528701287[/C][/ROW]
[ROW][C]Biweight[/C][C]0.596221302866908[/C][C]9.72192825538787[/C][/ROW]
[ROW][C]Cosine[/C][C]0.596221302866908[/C][C]9.81429112001274[/C][/ROW]
[ROW][C]Optcosine[/C][C]0.596221302866908[/C][C]9.53154183770053[/C][/ROW]
 [/TABLE]
Source: https://freestatistics.org/blog/index.php?pk=236300&T=6

Globally Unique Identifier (entire table): ba.freestatistics.org/blog/index.php?pk=236300&T=6

As an alternative you can also use a QR Code:  

The GUIDs for individual cells are displayed in the table below:

Maximum Density Values
Kernelx-valuemax. density
Gaussian0.59524426057338210.3496629549844
Epanechnikov0.5967098240136719.44795723561294
Rectangular0.5840082741978318.69204030808325
Triangular0.59035904910575110.243528701287
Biweight0.5962213028669089.72192825538787
Cosine0.5962213028669089.81429112001274
Optcosine0.5962213028669089.53154183770053


Maximum Density Values
Kernelx-valuemax. density
Gaussian0.59524426057338210.3496629549844
Epanechnikov0.5967098240136719.44795723561294
Rectangular0.5844967953445948.69204030808325
Triangular0.59035904910575110.243528701287
Biweight0.5962213028669089.72192825538787
Cosine0.5962213028669089.81429112001274
Optcosine0.5962213028669089.53154183770053

\begin{tabular}{lllllllll}
\hline
Maximum Density Values \tabularnewline
Kernel & x-value & max. density \tabularnewline
Gaussian & 0.595244260573382 & 10.3496629549844 \tabularnewline
Epanechnikov & 0.596709824013671 & 9.44795723561294 \tabularnewline
Rectangular & 0.584496795344594 & 8.69204030808325 \tabularnewline
Triangular & 0.590359049105751 & 10.243528701287 \tabularnewline
Biweight & 0.596221302866908 & 9.72192825538787 \tabularnewline
Cosine & 0.596221302866908 & 9.81429112001274 \tabularnewline
Optcosine & 0.596221302866908 & 9.53154183770053 \tabularnewline
 \hline
\end{tabular}
%Source: https://freestatistics.org/blog/index.php?pk=236300&T=7

[TABLE]
[ROW][C]Maximum Density Values[/C][/ROW]
[ROW][C]Kernel[/C][C]x-value[/C][C]max. density[/C][/ROW]
[ROW][C]Gaussian[/C][C]0.595244260573382[/C][C]10.3496629549844[/C][/ROW]
[ROW][C]Epanechnikov[/C][C]0.596709824013671[/C][C]9.44795723561294[/C][/ROW]
[ROW][C]Rectangular[/C][C]0.584496795344594[/C][C]8.69204030808325[/C][/ROW]
[ROW][C]Triangular[/C][C]0.590359049105751[/C][C]10.243528701287[/C][/ROW]
[ROW][C]Biweight[/C][C]0.596221302866908[/C][C]9.72192825538787[/C][/ROW]
[ROW][C]Cosine[/C][C]0.596221302866908[/C][C]9.81429112001274[/C][/ROW]
[ROW][C]Optcosine[/C][C]0.596221302866908[/C][C]9.53154183770053[/C][/ROW]
 [/TABLE]
Source: https://freestatistics.org/blog/index.php?pk=236300&T=7

Globally Unique Identifier (entire table): ba.freestatistics.org/blog/index.php?pk=236300&T=7

As an alternative you can also use a QR Code:  

The GUIDs for individual cells are displayed in the table below:

Maximum Density Values
Kernelx-valuemax. density
Gaussian0.59524426057338210.3496629549844
Epanechnikov0.5967098240136719.44795723561294
Rectangular0.5844967953445948.69204030808325
Triangular0.59035904910575110.243528701287
Biweight0.5962213028669089.72192825538787
Cosine0.5962213028669089.81429112001274
Optcosine0.5962213028669089.53154183770053


Maximum Density Values
Kernelx-valuemax. density
Gaussian0.59524426057338210.3496629549844
Epanechnikov0.5967098240136719.44795723561294
Rectangular0.5854738376381218.69204030808325
Triangular0.59035904910575110.243528701287
Biweight0.5962213028669089.72192825538787
Cosine0.5962213028669089.81429112001274
Optcosine0.5962213028669089.53154183770053

\begin{tabular}{lllllllll}
\hline
Maximum Density Values \tabularnewline
Kernel & x-value & max. density \tabularnewline
Gaussian & 0.595244260573382 & 10.3496629549844 \tabularnewline
Epanechnikov & 0.596709824013671 & 9.44795723561294 \tabularnewline
Rectangular & 0.585473837638121 & 8.69204030808325 \tabularnewline
Triangular & 0.590359049105751 & 10.243528701287 \tabularnewline
Biweight & 0.596221302866908 & 9.72192825538787 \tabularnewline
Cosine & 0.596221302866908 & 9.81429112001274 \tabularnewline
Optcosine & 0.596221302866908 & 9.53154183770053 \tabularnewline
 \hline
\end{tabular}
%Source: https://freestatistics.org/blog/index.php?pk=236300&T=8

[TABLE]
[ROW][C]Maximum Density Values[/C][/ROW]
[ROW][C]Kernel[/C][C]x-value[/C][C]max. density[/C][/ROW]
[ROW][C]Gaussian[/C][C]0.595244260573382[/C][C]10.3496629549844[/C][/ROW]
[ROW][C]Epanechnikov[/C][C]0.596709824013671[/C][C]9.44795723561294[/C][/ROW]
[ROW][C]Rectangular[/C][C]0.585473837638121[/C][C]8.69204030808325[/C][/ROW]
[ROW][C]Triangular[/C][C]0.590359049105751[/C][C]10.243528701287[/C][/ROW]
[ROW][C]Biweight[/C][C]0.596221302866908[/C][C]9.72192825538787[/C][/ROW]
[ROW][C]Cosine[/C][C]0.596221302866908[/C][C]9.81429112001274[/C][/ROW]
[ROW][C]Optcosine[/C][C]0.596221302866908[/C][C]9.53154183770053[/C][/ROW]
 [/TABLE]
Source: https://freestatistics.org/blog/index.php?pk=236300&T=8

Globally Unique Identifier (entire table): ba.freestatistics.org/blog/index.php?pk=236300&T=8

As an alternative you can also use a QR Code:  

The GUIDs for individual cells are displayed in the table below:

Maximum Density Values
Kernelx-valuemax. density
Gaussian0.59524426057338210.3496629549844
Epanechnikov0.5967098240136719.44795723561294
Rectangular0.5854738376381218.69204030808325
Triangular0.59035904910575110.243528701287
Biweight0.5962213028669089.72192825538787
Cosine0.5962213028669089.81429112001274
Optcosine0.5962213028669089.53154183770053


Maximum Density Values
Kernelx-valuemax. density
Gaussian0.59524426057338210.3496629549844
Epanechnikov0.5967098240136719.44795723561294
Rectangular0.5859623587848848.69204030808325
Triangular0.59035904910575110.243528701287
Biweight0.5962213028669089.72192825538787
Cosine0.5962213028669089.81429112001274
Optcosine0.5962213028669089.53154183770053

\begin{tabular}{lllllllll}
\hline
Maximum Density Values \tabularnewline
Kernel & x-value & max. density \tabularnewline
Gaussian & 0.595244260573382 & 10.3496629549844 \tabularnewline
Epanechnikov & 0.596709824013671 & 9.44795723561294 \tabularnewline
Rectangular & 0.585962358784884 & 8.69204030808325 \tabularnewline
Triangular & 0.590359049105751 & 10.243528701287 \tabularnewline
Biweight & 0.596221302866908 & 9.72192825538787 \tabularnewline
Cosine & 0.596221302866908 & 9.81429112001274 \tabularnewline
Optcosine & 0.596221302866908 & 9.53154183770053 \tabularnewline
 \hline
\end{tabular}
%Source: https://freestatistics.org/blog/index.php?pk=236300&T=9

[TABLE]
[ROW][C]Maximum Density Values[/C][/ROW]
[ROW][C]Kernel[/C][C]x-value[/C][C]max. density[/C][/ROW]
[ROW][C]Gaussian[/C][C]0.595244260573382[/C][C]10.3496629549844[/C][/ROW]
[ROW][C]Epanechnikov[/C][C]0.596709824013671[/C][C]9.44795723561294[/C][/ROW]
[ROW][C]Rectangular[/C][C]0.585962358784884[/C][C]8.69204030808325[/C][/ROW]
[ROW][C]Triangular[/C][C]0.590359049105751[/C][C]10.243528701287[/C][/ROW]
[ROW][C]Biweight[/C][C]0.596221302866908[/C][C]9.72192825538787[/C][/ROW]
[ROW][C]Cosine[/C][C]0.596221302866908[/C][C]9.81429112001274[/C][/ROW]
[ROW][C]Optcosine[/C][C]0.596221302866908[/C][C]9.53154183770053[/C][/ROW]
 [/TABLE]
Source: https://freestatistics.org/blog/index.php?pk=236300&T=9

Globally Unique Identifier (entire table): ba.freestatistics.org/blog/index.php?pk=236300&T=9

As an alternative you can also use a QR Code:  

The GUIDs for individual cells are displayed in the table below:

Maximum Density Values
Kernelx-valuemax. density
Gaussian0.59524426057338210.3496629549844
Epanechnikov0.5967098240136719.44795723561294
Rectangular0.5859623587848848.69204030808325
Triangular0.59035904910575110.243528701287
Biweight0.5962213028669089.72192825538787
Cosine0.5962213028669089.81429112001274
Optcosine0.5962213028669089.53154183770053


Maximum Density Values
Kernelx-valuemax. density
Gaussian0.59524426057338210.3496629549844
Epanechnikov0.5967098240136719.44795723561294
Rectangular0.5864508799316478.69204030808325
Triangular0.59035904910575110.243528701287
Biweight0.5962213028669089.72192825538787
Cosine0.5962213028669089.81429112001274
Optcosine0.5962213028669089.53154183770053

\begin{tabular}{lllllllll}
\hline
Maximum Density Values \tabularnewline
Kernel & x-value & max. density \tabularnewline
Gaussian & 0.595244260573382 & 10.3496629549844 \tabularnewline
Epanechnikov & 0.596709824013671 & 9.44795723561294 \tabularnewline
Rectangular & 0.586450879931647 & 8.69204030808325 \tabularnewline
Triangular & 0.590359049105751 & 10.243528701287 \tabularnewline
Biweight & 0.596221302866908 & 9.72192825538787 \tabularnewline
Cosine & 0.596221302866908 & 9.81429112001274 \tabularnewline
Optcosine & 0.596221302866908 & 9.53154183770053 \tabularnewline
 \hline
\end{tabular}
%Source: https://freestatistics.org/blog/index.php?pk=236300&T=10

[TABLE]
[ROW][C]Maximum Density Values[/C][/ROW]
[ROW][C]Kernel[/C][C]x-value[/C][C]max. density[/C][/ROW]
[ROW][C]Gaussian[/C][C]0.595244260573382[/C][C]10.3496629549844[/C][/ROW]
[ROW][C]Epanechnikov[/C][C]0.596709824013671[/C][C]9.44795723561294[/C][/ROW]
[ROW][C]Rectangular[/C][C]0.586450879931647[/C][C]8.69204030808325[/C][/ROW]
[ROW][C]Triangular[/C][C]0.590359049105751[/C][C]10.243528701287[/C][/ROW]
[ROW][C]Biweight[/C][C]0.596221302866908[/C][C]9.72192825538787[/C][/ROW]
[ROW][C]Cosine[/C][C]0.596221302866908[/C][C]9.81429112001274[/C][/ROW]
[ROW][C]Optcosine[/C][C]0.596221302866908[/C][C]9.53154183770053[/C][/ROW]
 [/TABLE]
Source: https://freestatistics.org/blog/index.php?pk=236300&T=10

Globally Unique Identifier (entire table): ba.freestatistics.org/blog/index.php?pk=236300&T=10

As an alternative you can also use a QR Code:  

The GUIDs for individual cells are displayed in the table below:

Maximum Density Values
Kernelx-valuemax. density
Gaussian0.59524426057338210.3496629549844
Epanechnikov0.5967098240136719.44795723561294
Rectangular0.5864508799316478.69204030808325
Triangular0.59035904910575110.243528701287
Biweight0.5962213028669089.72192825538787
Cosine0.5962213028669089.81429112001274
Optcosine0.5962213028669089.53154183770053


Maximum Density Values
Kernelx-valuemax. density
Gaussian0.59524426057338210.3496629549844
Epanechnikov0.5967098240136719.44795723561294
Rectangular0.586939401078418.69204030808325
Triangular0.59035904910575110.243528701287
Biweight0.5962213028669089.72192825538787
Cosine0.5962213028669089.81429112001274
Optcosine0.5962213028669089.53154183770053

\begin{tabular}{lllllllll}
\hline
Maximum Density Values \tabularnewline
Kernel & x-value & max. density \tabularnewline
Gaussian & 0.595244260573382 & 10.3496629549844 \tabularnewline
Epanechnikov & 0.596709824013671 & 9.44795723561294 \tabularnewline
Rectangular & 0.58693940107841 & 8.69204030808325 \tabularnewline
Triangular & 0.590359049105751 & 10.243528701287 \tabularnewline
Biweight & 0.596221302866908 & 9.72192825538787 \tabularnewline
Cosine & 0.596221302866908 & 9.81429112001274 \tabularnewline
Optcosine & 0.596221302866908 & 9.53154183770053 \tabularnewline
 \hline
\end{tabular}
%Source: https://freestatistics.org/blog/index.php?pk=236300&T=11

[TABLE]
[ROW][C]Maximum Density Values[/C][/ROW]
[ROW][C]Kernel[/C][C]x-value[/C][C]max. density[/C][/ROW]
[ROW][C]Gaussian[/C][C]0.595244260573382[/C][C]10.3496629549844[/C][/ROW]
[ROW][C]Epanechnikov[/C][C]0.596709824013671[/C][C]9.44795723561294[/C][/ROW]
[ROW][C]Rectangular[/C][C]0.58693940107841[/C][C]8.69204030808325[/C][/ROW]
[ROW][C]Triangular[/C][C]0.590359049105751[/C][C]10.243528701287[/C][/ROW]
[ROW][C]Biweight[/C][C]0.596221302866908[/C][C]9.72192825538787[/C][/ROW]
[ROW][C]Cosine[/C][C]0.596221302866908[/C][C]9.81429112001274[/C][/ROW]
[ROW][C]Optcosine[/C][C]0.596221302866908[/C][C]9.53154183770053[/C][/ROW]
 [/TABLE]
Source: https://freestatistics.org/blog/index.php?pk=236300&T=11

Globally Unique Identifier (entire table): ba.freestatistics.org/blog/index.php?pk=236300&T=11

As an alternative you can also use a QR Code:  

The GUIDs for individual cells are displayed in the table below:

Maximum Density Values
Kernelx-valuemax. density
Gaussian0.59524426057338210.3496629549844
Epanechnikov0.5967098240136719.44795723561294
Rectangular0.586939401078418.69204030808325
Triangular0.59035904910575110.243528701287
Biweight0.5962213028669089.72192825538787
Cosine0.5962213028669089.81429112001274
Optcosine0.5962213028669089.53154183770053


Maximum Density Values
Kernelx-valuemax. density
Gaussian0.59524426057338210.3496629549844
Epanechnikov0.5967098240136719.44795723561294
Rectangular0.5874279222251738.69204030808325
Triangular0.59035904910575110.243528701287
Biweight0.5962213028669089.72192825538787
Cosine0.5962213028669089.81429112001274
Optcosine0.5962213028669089.53154183770053

\begin{tabular}{lllllllll}
\hline
Maximum Density Values \tabularnewline
Kernel & x-value & max. density \tabularnewline
Gaussian & 0.595244260573382 & 10.3496629549844 \tabularnewline
Epanechnikov & 0.596709824013671 & 9.44795723561294 \tabularnewline
Rectangular & 0.587427922225173 & 8.69204030808325 \tabularnewline
Triangular & 0.590359049105751 & 10.243528701287 \tabularnewline
Biweight & 0.596221302866908 & 9.72192825538787 \tabularnewline
Cosine & 0.596221302866908 & 9.81429112001274 \tabularnewline
Optcosine & 0.596221302866908 & 9.53154183770053 \tabularnewline
 \hline
\end{tabular}
%Source: https://freestatistics.org/blog/index.php?pk=236300&T=12

[TABLE]
[ROW][C]Maximum Density Values[/C][/ROW]
[ROW][C]Kernel[/C][C]x-value[/C][C]max. density[/C][/ROW]
[ROW][C]Gaussian[/C][C]0.595244260573382[/C][C]10.3496629549844[/C][/ROW]
[ROW][C]Epanechnikov[/C][C]0.596709824013671[/C][C]9.44795723561294[/C][/ROW]
[ROW][C]Rectangular[/C][C]0.587427922225173[/C][C]8.69204030808325[/C][/ROW]
[ROW][C]Triangular[/C][C]0.590359049105751[/C][C]10.243528701287[/C][/ROW]
[ROW][C]Biweight[/C][C]0.596221302866908[/C][C]9.72192825538787[/C][/ROW]
[ROW][C]Cosine[/C][C]0.596221302866908[/C][C]9.81429112001274[/C][/ROW]
[ROW][C]Optcosine[/C][C]0.596221302866908[/C][C]9.53154183770053[/C][/ROW]
 [/TABLE]
Source: https://freestatistics.org/blog/index.php?pk=236300&T=12

Globally Unique Identifier (entire table): ba.freestatistics.org/blog/index.php?pk=236300&T=12

As an alternative you can also use a QR Code:  

The GUIDs for individual cells are displayed in the table below:

Maximum Density Values
Kernelx-valuemax. density
Gaussian0.59524426057338210.3496629549844
Epanechnikov0.5967098240136719.44795723561294
Rectangular0.5874279222251738.69204030808325
Triangular0.59035904910575110.243528701287
Biweight0.5962213028669089.72192825538787
Cosine0.5962213028669089.81429112001274
Optcosine0.5962213028669089.53154183770053


Maximum Density Values
Kernelx-valuemax. density
Gaussian0.59524426057338210.3496629549844
Epanechnikov0.5967098240136719.44795723561294
Rectangular0.5879164433719368.69204030808325
Triangular0.59035904910575110.243528701287
Biweight0.5962213028669089.72192825538787
Cosine0.5962213028669089.81429112001274
Optcosine0.5962213028669089.53154183770053

\begin{tabular}{lllllllll}
\hline
Maximum Density Values \tabularnewline
Kernel & x-value & max. density \tabularnewline
Gaussian & 0.595244260573382 & 10.3496629549844 \tabularnewline
Epanechnikov & 0.596709824013671 & 9.44795723561294 \tabularnewline
Rectangular & 0.587916443371936 & 8.69204030808325 \tabularnewline
Triangular & 0.590359049105751 & 10.243528701287 \tabularnewline
Biweight & 0.596221302866908 & 9.72192825538787 \tabularnewline
Cosine & 0.596221302866908 & 9.81429112001274 \tabularnewline
Optcosine & 0.596221302866908 & 9.53154183770053 \tabularnewline
 \hline
\end{tabular}
%Source: https://freestatistics.org/blog/index.php?pk=236300&T=13

[TABLE]
[ROW][C]Maximum Density Values[/C][/ROW]
[ROW][C]Kernel[/C][C]x-value[/C][C]max. density[/C][/ROW]
[ROW][C]Gaussian[/C][C]0.595244260573382[/C][C]10.3496629549844[/C][/ROW]
[ROW][C]Epanechnikov[/C][C]0.596709824013671[/C][C]9.44795723561294[/C][/ROW]
[ROW][C]Rectangular[/C][C]0.587916443371936[/C][C]8.69204030808325[/C][/ROW]
[ROW][C]Triangular[/C][C]0.590359049105751[/C][C]10.243528701287[/C][/ROW]
[ROW][C]Biweight[/C][C]0.596221302866908[/C][C]9.72192825538787[/C][/ROW]
[ROW][C]Cosine[/C][C]0.596221302866908[/C][C]9.81429112001274[/C][/ROW]
[ROW][C]Optcosine[/C][C]0.596221302866908[/C][C]9.53154183770053[/C][/ROW]
 [/TABLE]
Source: https://freestatistics.org/blog/index.php?pk=236300&T=13

Globally Unique Identifier (entire table): ba.freestatistics.org/blog/index.php?pk=236300&T=13

As an alternative you can also use a QR Code:  

The GUIDs for individual cells are displayed in the table below:

Maximum Density Values
Kernelx-valuemax. density
Gaussian0.59524426057338210.3496629549844
Epanechnikov0.5967098240136719.44795723561294
Rectangular0.5879164433719368.69204030808325
Triangular0.59035904910575110.243528701287
Biweight0.5962213028669089.72192825538787
Cosine0.5962213028669089.81429112001274
Optcosine0.5962213028669089.53154183770053


Maximum Density Values
Kernelx-valuemax. density
Gaussian0.59524426057338210.3496629549844
Epanechnikov0.5967098240136719.44795723561294
Rectangular0.5884049645186998.69204030808325
Triangular0.59035904910575110.243528701287
Biweight0.5962213028669089.72192825538787
Cosine0.5962213028669089.81429112001274
Optcosine0.5962213028669089.53154183770053

\begin{tabular}{lllllllll}
\hline
Maximum Density Values \tabularnewline
Kernel & x-value & max. density \tabularnewline
Gaussian & 0.595244260573382 & 10.3496629549844 \tabularnewline
Epanechnikov & 0.596709824013671 & 9.44795723561294 \tabularnewline
Rectangular & 0.588404964518699 & 8.69204030808325 \tabularnewline
Triangular & 0.590359049105751 & 10.243528701287 \tabularnewline
Biweight & 0.596221302866908 & 9.72192825538787 \tabularnewline
Cosine & 0.596221302866908 & 9.81429112001274 \tabularnewline
Optcosine & 0.596221302866908 & 9.53154183770053 \tabularnewline
 \hline
\end{tabular}
%Source: https://freestatistics.org/blog/index.php?pk=236300&T=14

[TABLE]
[ROW][C]Maximum Density Values[/C][/ROW]
[ROW][C]Kernel[/C][C]x-value[/C][C]max. density[/C][/ROW]
[ROW][C]Gaussian[/C][C]0.595244260573382[/C][C]10.3496629549844[/C][/ROW]
[ROW][C]Epanechnikov[/C][C]0.596709824013671[/C][C]9.44795723561294[/C][/ROW]
[ROW][C]Rectangular[/C][C]0.588404964518699[/C][C]8.69204030808325[/C][/ROW]
[ROW][C]Triangular[/C][C]0.590359049105751[/C][C]10.243528701287[/C][/ROW]
[ROW][C]Biweight[/C][C]0.596221302866908[/C][C]9.72192825538787[/C][/ROW]
[ROW][C]Cosine[/C][C]0.596221302866908[/C][C]9.81429112001274[/C][/ROW]
[ROW][C]Optcosine[/C][C]0.596221302866908[/C][C]9.53154183770053[/C][/ROW]
 [/TABLE]
Source: https://freestatistics.org/blog/index.php?pk=236300&T=14

Globally Unique Identifier (entire table): ba.freestatistics.org/blog/index.php?pk=236300&T=14

As an alternative you can also use a QR Code:  

The GUIDs for individual cells are displayed in the table below:

Maximum Density Values
Kernelx-valuemax. density
Gaussian0.59524426057338210.3496629549844
Epanechnikov0.5967098240136719.44795723561294
Rectangular0.5884049645186998.69204030808325
Triangular0.59035904910575110.243528701287
Biweight0.5962213028669089.72192825538787
Cosine0.5962213028669089.81429112001274
Optcosine0.5962213028669089.53154183770053


Maximum Density Values
Kernelx-valuemax. density
Gaussian0.59524426057338210.3496629549844
Epanechnikov0.5967098240136719.44795723561294
Rectangular0.5888934856654628.69204030808325
Triangular0.59035904910575110.243528701287
Biweight0.5962213028669089.72192825538787
Cosine0.5962213028669089.81429112001274
Optcosine0.5962213028669089.53154183770053

\begin{tabular}{lllllllll}
\hline
Maximum Density Values \tabularnewline
Kernel & x-value & max. density \tabularnewline
Gaussian & 0.595244260573382 & 10.3496629549844 \tabularnewline
Epanechnikov & 0.596709824013671 & 9.44795723561294 \tabularnewline
Rectangular & 0.588893485665462 & 8.69204030808325 \tabularnewline
Triangular & 0.590359049105751 & 10.243528701287 \tabularnewline
Biweight & 0.596221302866908 & 9.72192825538787 \tabularnewline
Cosine & 0.596221302866908 & 9.81429112001274 \tabularnewline
Optcosine & 0.596221302866908 & 9.53154183770053 \tabularnewline
 \hline
\end{tabular}
%Source: https://freestatistics.org/blog/index.php?pk=236300&T=15

[TABLE]
[ROW][C]Maximum Density Values[/C][/ROW]
[ROW][C]Kernel[/C][C]x-value[/C][C]max. density[/C][/ROW]
[ROW][C]Gaussian[/C][C]0.595244260573382[/C][C]10.3496629549844[/C][/ROW]
[ROW][C]Epanechnikov[/C][C]0.596709824013671[/C][C]9.44795723561294[/C][/ROW]
[ROW][C]Rectangular[/C][C]0.588893485665462[/C][C]8.69204030808325[/C][/ROW]
[ROW][C]Triangular[/C][C]0.590359049105751[/C][C]10.243528701287[/C][/ROW]
[ROW][C]Biweight[/C][C]0.596221302866908[/C][C]9.72192825538787[/C][/ROW]
[ROW][C]Cosine[/C][C]0.596221302866908[/C][C]9.81429112001274[/C][/ROW]
[ROW][C]Optcosine[/C][C]0.596221302866908[/C][C]9.53154183770053[/C][/ROW]
 [/TABLE]
Source: https://freestatistics.org/blog/index.php?pk=236300&T=15

Globally Unique Identifier (entire table): ba.freestatistics.org/blog/index.php?pk=236300&T=15

As an alternative you can also use a QR Code:  

The GUIDs for individual cells are displayed in the table below:

Maximum Density Values
Kernelx-valuemax. density
Gaussian0.59524426057338210.3496629549844
Epanechnikov0.5967098240136719.44795723561294
Rectangular0.5888934856654628.69204030808325
Triangular0.59035904910575110.243528701287
Biweight0.5962213028669089.72192825538787
Cosine0.5962213028669089.81429112001274
Optcosine0.5962213028669089.53154183770053


Maximum Density Values
Kernelx-valuemax. density
Gaussian0.59524426057338210.3496629549844
Epanechnikov0.5967098240136719.44795723561294
Rectangular0.6074572892424588.69204030808325
Triangular0.59035904910575110.243528701287
Biweight0.5962213028669089.72192825538787
Cosine0.5962213028669089.81429112001274
Optcosine0.5962213028669089.53154183770053

\begin{tabular}{lllllllll}
\hline
Maximum Density Values \tabularnewline
Kernel & x-value & max. density \tabularnewline
Gaussian & 0.595244260573382 & 10.3496629549844 \tabularnewline
Epanechnikov & 0.596709824013671 & 9.44795723561294 \tabularnewline
Rectangular & 0.607457289242458 & 8.69204030808325 \tabularnewline
Triangular & 0.590359049105751 & 10.243528701287 \tabularnewline
Biweight & 0.596221302866908 & 9.72192825538787 \tabularnewline
Cosine & 0.596221302866908 & 9.81429112001274 \tabularnewline
Optcosine & 0.596221302866908 & 9.53154183770053 \tabularnewline
 \hline
\end{tabular}
%Source: https://freestatistics.org/blog/index.php?pk=236300&T=16

[TABLE]
[ROW][C]Maximum Density Values[/C][/ROW]
[ROW][C]Kernel[/C][C]x-value[/C][C]max. density[/C][/ROW]
[ROW][C]Gaussian[/C][C]0.595244260573382[/C][C]10.3496629549844[/C][/ROW]
[ROW][C]Epanechnikov[/C][C]0.596709824013671[/C][C]9.44795723561294[/C][/ROW]
[ROW][C]Rectangular[/C][C]0.607457289242458[/C][C]8.69204030808325[/C][/ROW]
[ROW][C]Triangular[/C][C]0.590359049105751[/C][C]10.243528701287[/C][/ROW]
[ROW][C]Biweight[/C][C]0.596221302866908[/C][C]9.72192825538787[/C][/ROW]
[ROW][C]Cosine[/C][C]0.596221302866908[/C][C]9.81429112001274[/C][/ROW]
[ROW][C]Optcosine[/C][C]0.596221302866908[/C][C]9.53154183770053[/C][/ROW]
 [/TABLE]
Source: https://freestatistics.org/blog/index.php?pk=236300&T=16

Globally Unique Identifier (entire table): ba.freestatistics.org/blog/index.php?pk=236300&T=16

As an alternative you can also use a QR Code:  

The GUIDs for individual cells are displayed in the table below:

Maximum Density Values
Kernelx-valuemax. density
Gaussian0.59524426057338210.3496629549844
Epanechnikov0.5967098240136719.44795723561294
Rectangular0.6074572892424588.69204030808325
Triangular0.59035904910575110.243528701287
Biweight0.5962213028669089.72192825538787
Cosine0.5962213028669089.81429112001274
Optcosine0.5962213028669089.53154183770053


Maximum Density Values
Kernelx-valuemax. density
Gaussian0.59524426057338210.3496629549844
Epanechnikov0.5967098240136719.44795723561294
Rectangular0.6079458103892218.69204030808325
Triangular0.59035904910575110.243528701287
Biweight0.5962213028669089.72192825538787
Cosine0.5962213028669089.81429112001274
Optcosine0.5962213028669089.53154183770053

\begin{tabular}{lllllllll}
\hline
Maximum Density Values \tabularnewline
Kernel & x-value & max. density \tabularnewline
Gaussian & 0.595244260573382 & 10.3496629549844 \tabularnewline
Epanechnikov & 0.596709824013671 & 9.44795723561294 \tabularnewline
Rectangular & 0.607945810389221 & 8.69204030808325 \tabularnewline
Triangular & 0.590359049105751 & 10.243528701287 \tabularnewline
Biweight & 0.596221302866908 & 9.72192825538787 \tabularnewline
Cosine & 0.596221302866908 & 9.81429112001274 \tabularnewline
Optcosine & 0.596221302866908 & 9.53154183770053 \tabularnewline
 \hline
\end{tabular}
%Source: https://freestatistics.org/blog/index.php?pk=236300&T=17

[TABLE]
[ROW][C]Maximum Density Values[/C][/ROW]
[ROW][C]Kernel[/C][C]x-value[/C][C]max. density[/C][/ROW]
[ROW][C]Gaussian[/C][C]0.595244260573382[/C][C]10.3496629549844[/C][/ROW]
[ROW][C]Epanechnikov[/C][C]0.596709824013671[/C][C]9.44795723561294[/C][/ROW]
[ROW][C]Rectangular[/C][C]0.607945810389221[/C][C]8.69204030808325[/C][/ROW]
[ROW][C]Triangular[/C][C]0.590359049105751[/C][C]10.243528701287[/C][/ROW]
[ROW][C]Biweight[/C][C]0.596221302866908[/C][C]9.72192825538787[/C][/ROW]
[ROW][C]Cosine[/C][C]0.596221302866908[/C][C]9.81429112001274[/C][/ROW]
[ROW][C]Optcosine[/C][C]0.596221302866908[/C][C]9.53154183770053[/C][/ROW]
 [/TABLE]
Source: https://freestatistics.org/blog/index.php?pk=236300&T=17

Globally Unique Identifier (entire table): ba.freestatistics.org/blog/index.php?pk=236300&T=17

As an alternative you can also use a QR Code:  

The GUIDs for individual cells are displayed in the table below:

Maximum Density Values
Kernelx-valuemax. density
Gaussian0.59524426057338210.3496629549844
Epanechnikov0.5967098240136719.44795723561294
Rectangular0.6079458103892218.69204030808325
Triangular0.59035904910575110.243528701287
Biweight0.5962213028669089.72192825538787
Cosine0.5962213028669089.81429112001274
Optcosine0.5962213028669089.53154183770053


Maximum Density Values
Kernelx-valuemax. density
Gaussian0.59524426057338210.3496629549844
Epanechnikov0.5967098240136719.44795723561294
Rectangular0.6084343315359848.69204030808325
Triangular0.59035904910575110.243528701287
Biweight0.5962213028669089.72192825538787
Cosine0.5962213028669089.81429112001274
Optcosine0.5962213028669089.53154183770053

\begin{tabular}{lllllllll}
\hline
Maximum Density Values \tabularnewline
Kernel & x-value & max. density \tabularnewline
Gaussian & 0.595244260573382 & 10.3496629549844 \tabularnewline
Epanechnikov & 0.596709824013671 & 9.44795723561294 \tabularnewline
Rectangular & 0.608434331535984 & 8.69204030808325 \tabularnewline
Triangular & 0.590359049105751 & 10.243528701287 \tabularnewline
Biweight & 0.596221302866908 & 9.72192825538787 \tabularnewline
Cosine & 0.596221302866908 & 9.81429112001274 \tabularnewline
Optcosine & 0.596221302866908 & 9.53154183770053 \tabularnewline
 \hline
\end{tabular}
%Source: https://freestatistics.org/blog/index.php?pk=236300&T=18

[TABLE]
[ROW][C]Maximum Density Values[/C][/ROW]
[ROW][C]Kernel[/C][C]x-value[/C][C]max. density[/C][/ROW]
[ROW][C]Gaussian[/C][C]0.595244260573382[/C][C]10.3496629549844[/C][/ROW]
[ROW][C]Epanechnikov[/C][C]0.596709824013671[/C][C]9.44795723561294[/C][/ROW]
[ROW][C]Rectangular[/C][C]0.608434331535984[/C][C]8.69204030808325[/C][/ROW]
[ROW][C]Triangular[/C][C]0.590359049105751[/C][C]10.243528701287[/C][/ROW]
[ROW][C]Biweight[/C][C]0.596221302866908[/C][C]9.72192825538787[/C][/ROW]
[ROW][C]Cosine[/C][C]0.596221302866908[/C][C]9.81429112001274[/C][/ROW]
[ROW][C]Optcosine[/C][C]0.596221302866908[/C][C]9.53154183770053[/C][/ROW]
 [/TABLE]
Source: https://freestatistics.org/blog/index.php?pk=236300&T=18

Globally Unique Identifier (entire table): ba.freestatistics.org/blog/index.php?pk=236300&T=18

As an alternative you can also use a QR Code:  

The GUIDs for individual cells are displayed in the table below:

Maximum Density Values
Kernelx-valuemax. density
Gaussian0.59524426057338210.3496629549844
Epanechnikov0.5967098240136719.44795723561294
Rectangular0.6084343315359848.69204030808325
Triangular0.59035904910575110.243528701287
Biweight0.5962213028669089.72192825538787
Cosine0.5962213028669089.81429112001274
Optcosine0.5962213028669089.53154183770053


Maximum Density Values
Kernelx-valuemax. density
Gaussian0.59524426057338210.3496629549844
Epanechnikov0.5967098240136719.44795723561294
Rectangular0.6089228526827478.69204030808325
Triangular0.59035904910575110.243528701287
Biweight0.5962213028669089.72192825538787
Cosine0.5962213028669089.81429112001274
Optcosine0.5962213028669089.53154183770053

\begin{tabular}{lllllllll}
\hline
Maximum Density Values \tabularnewline
Kernel & x-value & max. density \tabularnewline
Gaussian & 0.595244260573382 & 10.3496629549844 \tabularnewline
Epanechnikov & 0.596709824013671 & 9.44795723561294 \tabularnewline
Rectangular & 0.608922852682747 & 8.69204030808325 \tabularnewline
Triangular & 0.590359049105751 & 10.243528701287 \tabularnewline
Biweight & 0.596221302866908 & 9.72192825538787 \tabularnewline
Cosine & 0.596221302866908 & 9.81429112001274 \tabularnewline
Optcosine & 0.596221302866908 & 9.53154183770053 \tabularnewline
 \hline
\end{tabular}
%Source: https://freestatistics.org/blog/index.php?pk=236300&T=19

[TABLE]
[ROW][C]Maximum Density Values[/C][/ROW]
[ROW][C]Kernel[/C][C]x-value[/C][C]max. density[/C][/ROW]
[ROW][C]Gaussian[/C][C]0.595244260573382[/C][C]10.3496629549844[/C][/ROW]
[ROW][C]Epanechnikov[/C][C]0.596709824013671[/C][C]9.44795723561294[/C][/ROW]
[ROW][C]Rectangular[/C][C]0.608922852682747[/C][C]8.69204030808325[/C][/ROW]
[ROW][C]Triangular[/C][C]0.590359049105751[/C][C]10.243528701287[/C][/ROW]
[ROW][C]Biweight[/C][C]0.596221302866908[/C][C]9.72192825538787[/C][/ROW]
[ROW][C]Cosine[/C][C]0.596221302866908[/C][C]9.81429112001274[/C][/ROW]
[ROW][C]Optcosine[/C][C]0.596221302866908[/C][C]9.53154183770053[/C][/ROW]
 [/TABLE]
Source: https://freestatistics.org/blog/index.php?pk=236300&T=19

Globally Unique Identifier (entire table): ba.freestatistics.org/blog/index.php?pk=236300&T=19

As an alternative you can also use a QR Code:  

The GUIDs for individual cells are displayed in the table below:

Maximum Density Values
Kernelx-valuemax. density
Gaussian0.59524426057338210.3496629549844
Epanechnikov0.5967098240136719.44795723561294
Rectangular0.6089228526827478.69204030808325
Triangular0.59035904910575110.243528701287
Biweight0.5962213028669089.72192825538787
Cosine0.5962213028669089.81429112001274
Optcosine0.5962213028669089.53154183770053


Maximum Density Values
Kernelx-valuemax. density
Gaussian0.59524426057338210.3496629549844
Epanechnikov0.5967098240136719.44795723561294
Rectangular0.609411373829518.69204030808325
Triangular0.59035904910575110.243528701287
Biweight0.5962213028669089.72192825538787
Cosine0.5962213028669089.81429112001274
Optcosine0.5962213028669089.53154183770053

\begin{tabular}{lllllllll}
\hline
Maximum Density Values \tabularnewline
Kernel & x-value & max. density \tabularnewline
Gaussian & 0.595244260573382 & 10.3496629549844 \tabularnewline
Epanechnikov & 0.596709824013671 & 9.44795723561294 \tabularnewline
Rectangular & 0.60941137382951 & 8.69204030808325 \tabularnewline
Triangular & 0.590359049105751 & 10.243528701287 \tabularnewline
Biweight & 0.596221302866908 & 9.72192825538787 \tabularnewline
Cosine & 0.596221302866908 & 9.81429112001274 \tabularnewline
Optcosine & 0.596221302866908 & 9.53154183770053 \tabularnewline
 \hline
\end{tabular}
%Source: https://freestatistics.org/blog/index.php?pk=236300&T=20

[TABLE]
[ROW][C]Maximum Density Values[/C][/ROW]
[ROW][C]Kernel[/C][C]x-value[/C][C]max. density[/C][/ROW]
[ROW][C]Gaussian[/C][C]0.595244260573382[/C][C]10.3496629549844[/C][/ROW]
[ROW][C]Epanechnikov[/C][C]0.596709824013671[/C][C]9.44795723561294[/C][/ROW]
[ROW][C]Rectangular[/C][C]0.60941137382951[/C][C]8.69204030808325[/C][/ROW]
[ROW][C]Triangular[/C][C]0.590359049105751[/C][C]10.243528701287[/C][/ROW]
[ROW][C]Biweight[/C][C]0.596221302866908[/C][C]9.72192825538787[/C][/ROW]
[ROW][C]Cosine[/C][C]0.596221302866908[/C][C]9.81429112001274[/C][/ROW]
[ROW][C]Optcosine[/C][C]0.596221302866908[/C][C]9.53154183770053[/C][/ROW]
 [/TABLE]
Source: https://freestatistics.org/blog/index.php?pk=236300&T=20

Globally Unique Identifier (entire table): ba.freestatistics.org/blog/index.php?pk=236300&T=20

As an alternative you can also use a QR Code:  

The GUIDs for individual cells are displayed in the table below:

Maximum Density Values
Kernelx-valuemax. density
Gaussian0.59524426057338210.3496629549844
Epanechnikov0.5967098240136719.44795723561294
Rectangular0.609411373829518.69204030808325
Triangular0.59035904910575110.243528701287
Biweight0.5962213028669089.72192825538787
Cosine0.5962213028669089.81429112001274
Optcosine0.5962213028669089.53154183770053


Maximum Density Values
Kernelx-valuemax. density
Gaussian0.59524426057338210.3496629549844
Epanechnikov0.5967098240136719.44795723561294
Rectangular0.6098998949762738.69204030808325
Triangular0.59035904910575110.243528701287
Biweight0.5962213028669089.72192825538787
Cosine0.5962213028669089.81429112001274
Optcosine0.5962213028669089.53154183770053

\begin{tabular}{lllllllll}
\hline
Maximum Density Values \tabularnewline
Kernel & x-value & max. density \tabularnewline
Gaussian & 0.595244260573382 & 10.3496629549844 \tabularnewline
Epanechnikov & 0.596709824013671 & 9.44795723561294 \tabularnewline
Rectangular & 0.609899894976273 & 8.69204030808325 \tabularnewline
Triangular & 0.590359049105751 & 10.243528701287 \tabularnewline
Biweight & 0.596221302866908 & 9.72192825538787 \tabularnewline
Cosine & 0.596221302866908 & 9.81429112001274 \tabularnewline
Optcosine & 0.596221302866908 & 9.53154183770053 \tabularnewline
 \hline
\end{tabular}
%Source: https://freestatistics.org/blog/index.php?pk=236300&T=21

[TABLE]
[ROW][C]Maximum Density Values[/C][/ROW]
[ROW][C]Kernel[/C][C]x-value[/C][C]max. density[/C][/ROW]
[ROW][C]Gaussian[/C][C]0.595244260573382[/C][C]10.3496629549844[/C][/ROW]
[ROW][C]Epanechnikov[/C][C]0.596709824013671[/C][C]9.44795723561294[/C][/ROW]
[ROW][C]Rectangular[/C][C]0.609899894976273[/C][C]8.69204030808325[/C][/ROW]
[ROW][C]Triangular[/C][C]0.590359049105751[/C][C]10.243528701287[/C][/ROW]
[ROW][C]Biweight[/C][C]0.596221302866908[/C][C]9.72192825538787[/C][/ROW]
[ROW][C]Cosine[/C][C]0.596221302866908[/C][C]9.81429112001274[/C][/ROW]
[ROW][C]Optcosine[/C][C]0.596221302866908[/C][C]9.53154183770053[/C][/ROW]
 [/TABLE]
Source: https://freestatistics.org/blog/index.php?pk=236300&T=21

Globally Unique Identifier (entire table): ba.freestatistics.org/blog/index.php?pk=236300&T=21

As an alternative you can also use a QR Code:  

The GUIDs for individual cells are displayed in the table below:

Maximum Density Values
Kernelx-valuemax. density
Gaussian0.59524426057338210.3496629549844
Epanechnikov0.5967098240136719.44795723561294
Rectangular0.6098998949762738.69204030808325
Triangular0.59035904910575110.243528701287
Biweight0.5962213028669089.72192825538787
Cosine0.5962213028669089.81429112001274
Optcosine0.5962213028669089.53154183770053


Maximum Density Values
Kernelx-valuemax. density
Gaussian0.59524426057338210.3496629549844
Epanechnikov0.5967098240136719.44795723561294
Rectangular0.615762148737438.69204030808325
Triangular0.59035904910575110.243528701287
Biweight0.5962213028669089.72192825538787
Cosine0.5962213028669089.81429112001274
Optcosine0.5962213028669089.53154183770053

\begin{tabular}{lllllllll}
\hline
Maximum Density Values \tabularnewline
Kernel & x-value & max. density \tabularnewline
Gaussian & 0.595244260573382 & 10.3496629549844 \tabularnewline
Epanechnikov & 0.596709824013671 & 9.44795723561294 \tabularnewline
Rectangular & 0.61576214873743 & 8.69204030808325 \tabularnewline
Triangular & 0.590359049105751 & 10.243528701287 \tabularnewline
Biweight & 0.596221302866908 & 9.72192825538787 \tabularnewline
Cosine & 0.596221302866908 & 9.81429112001274 \tabularnewline
Optcosine & 0.596221302866908 & 9.53154183770053 \tabularnewline
\hline
\end{tabular}
%Source: https://freestatistics.org/blog/index.php?pk=236300&T=22

[TABLE]
[ROW][C]Maximum Density Values[/C][/ROW]
[ROW][C]Kernel[/C][C]x-value[/C][C]max. density[/C][/ROW]
[ROW][C]Gaussian[/C][C]0.595244260573382[/C][C]10.3496629549844[/C][/ROW]
[ROW][C]Epanechnikov[/C][C]0.596709824013671[/C][C]9.44795723561294[/C][/ROW]
[ROW][C]Rectangular[/C][C]0.61576214873743[/C][C]8.69204030808325[/C][/ROW]
[ROW][C]Triangular[/C][C]0.590359049105751[/C][C]10.243528701287[/C][/ROW]
[ROW][C]Biweight[/C][C]0.596221302866908[/C][C]9.72192825538787[/C][/ROW]
[ROW][C]Cosine[/C][C]0.596221302866908[/C][C]9.81429112001274[/C][/ROW]
[ROW][C]Optcosine[/C][C]0.596221302866908[/C][C]9.53154183770053[/C][/ROW]
[/TABLE]
Source: https://freestatistics.org/blog/index.php?pk=236300&T=22

Globally Unique Identifier (entire table): ba.freestatistics.org/blog/index.php?pk=236300&T=22

As an alternative you can also use a QR Code:  

The GUIDs for individual cells are displayed in the table below:

Maximum Density Values
Kernelx-valuemax. density
Gaussian0.59524426057338210.3496629549844
Epanechnikov0.5967098240136719.44795723561294
Rectangular0.615762148737438.69204030808325
Triangular0.59035904910575110.243528701287
Biweight0.5962213028669089.72192825538787
Cosine0.5962213028669089.81429112001274
Optcosine0.5962213028669089.53154183770053


Parameters (Session):
par1 = 0 ; par2 = no ; par3 = 512 ;
Parameters (R input):
par1 = 0 ; par2 = no ; par3 = 512 ;
R code (references can be found in the software module):
if (par1 == '0') bw <- 'nrd0'
if (par1 != '0') bw <- as.numeric(par1)
par3 <- as.numeric(par3)
mydensity <- array(NA, dim=c(par3,8))
bitmap(file='density1.png')
mydensity1<-density(x,bw=bw,kernel='gaussian',na.rm=TRUE)
mydensity[,8] = signif(mydensity1$x,3)
mydensity[,1] = signif(mydensity1$y,3)
plot(mydensity1,main='Gaussian Kernel',xlab=xlab,ylab=ylab)
grid()
dev.off()
mydensity1
bitmap(file='density2.png')
mydensity2<-density(x,bw=bw,kernel='epanechnikov',na.rm=TRUE)
mydensity[,2] = signif(mydensity2$y,3)
plot(mydensity2,main='Epanechnikov Kernel',xlab=xlab,ylab=ylab)
grid()
dev.off()
bitmap(file='density3.png')
mydensity3<-density(x,bw=bw,kernel='rectangular',na.rm=TRUE)
mydensity[,3] = signif(mydensity3$y,3)
plot(mydensity3,main='Rectangular Kernel',xlab=xlab,ylab=ylab)
grid()
dev.off()
bitmap(file='density4.png')
mydensity4<-density(x,bw=bw,kernel='triangular',na.rm=TRUE)
mydensity[,4] = signif(mydensity4$y,3)
plot(mydensity4,main='Triangular Kernel',xlab=xlab,ylab=ylab)
grid()
dev.off()
bitmap(file='density5.png')
mydensity5<-density(x,bw=bw,kernel='biweight',na.rm=TRUE)
mydensity[,5] = signif(mydensity5$y,3)
plot(mydensity5,main='Biweight Kernel',xlab=xlab,ylab=ylab)
grid()
dev.off()
bitmap(file='density6.png')
mydensity6<-density(x,bw=bw,kernel='cosine',na.rm=TRUE)
mydensity[,6] = signif(mydensity6$y,3)
plot(mydensity6,main='Cosine Kernel',xlab=xlab,ylab=ylab)
grid()
dev.off()
bitmap(file='density7.png')
mydensity7<-density(x,bw=bw,kernel='optcosine',na.rm=TRUE)
mydensity[,7] = signif(mydensity7$y,3)
plot(mydensity7,main='Optcosine Kernel',xlab=xlab,ylab=ylab)
grid()
dev.off()
load(file='createtable')
a<-table.start()
a<-table.row.start(a)
a<-table.element(a,'Properties of Density Trace',2,TRUE)
a<-table.row.end(a)
a<-table.row.start(a)
a<-table.element(a,'Bandwidth',header=TRUE)
a<-table.element(a,mydensity1$bw)
a<-table.row.end(a)
a<-table.row.start(a)
a<-table.element(a,'#Observations',header=TRUE)
a<-table.element(a,mydensity1$n)
a<-table.row.end(a)
a<-table.end(a)
table.save(a,file='mytable.tab')
a<-table.start()
a<-table.row.start(a)
a<-table.element(a,'Maximum Density Values',3,TRUE)
a<-table.row.end(a)
a<-table.row.start(a)
a<-table.element(a,'Kernel',1,TRUE)
a<-table.element(a,'x-value',1,TRUE)
a<-table.element(a,'max. density',1,TRUE)
a<-table.row.end(a)
a<-table.row.start(a)
a<-table.element(a,'Gaussian',1,TRUE)
a<-table.element(a,mydensity1$x[mydensity1$y==max(mydensity1$y)],1)
a<-table.element(a,mydensity1$y[mydensity1$y==max(mydensity1$y)],1)
a<-table.row.end(a)
a<-table.row.start(a)
a<-table.element(a,'Epanechnikov',1,TRUE)
a<-table.element(a,mydensity2$x[mydensity2$y==max(mydensity2$y)],1)
a<-table.element(a,mydensity2$y[mydensity2$y==max(mydensity2$y)],1)
a<-table.row.end(a)
a<-table.row.start(a)
a<-table.element(a,'Rectangular',1,TRUE)
a<-table.element(a,mydensity3$x[mydensity3$y==max(mydensity3$y)],1)
a<-table.element(a,mydensity3$y[mydensity3$y==max(mydensity3$y)],1)
a<-table.row.end(a)
a<-table.row.start(a)
a<-table.element(a,'Triangular',1,TRUE)
a<-table.element(a,mydensity4$x[mydensity4$y==max(mydensity4$y)],1)
a<-table.element(a,mydensity4$y[mydensity4$y==max(mydensity4$y)],1)
a<-table.row.end(a)
a<-table.row.start(a)
a<-table.element(a,'Biweight',1,TRUE)
a<-table.element(a,mydensity5$x[mydensity5$y==max(mydensity5$y)],1)
a<-table.element(a,mydensity5$y[mydensity5$y==max(mydensity5$y)],1)
a<-table.row.end(a)
a<-table.row.start(a)
a<-table.element(a,'Cosine',1,TRUE)
a<-table.element(a,mydensity6$x[mydensity6$y==max(mydensity6$y)],1)
a<-table.element(a,mydensity6$y[mydensity6$y==max(mydensity6$y)],1)
a<-table.row.end(a)
a<-table.row.start(a)
a<-table.element(a,'Optcosine',1,TRUE)
a<-table.element(a,mydensity7$x[mydensity7$y==max(mydensity7$y)],1)
a<-table.element(a,mydensity7$y[mydensity7$y==max(mydensity7$y)],1)
a<-table.row.end(a)
a<-table.end(a)
table.save(a,file='mytable2.tab')
if (par2=='yes') {
a<-table.start()
a<-table.row.start(a)
a<-table.element(a,'Kernel Density Values',8,TRUE)
a<-table.row.end(a)
a<-table.row.start(a)
a<-table.element(a,'x-value',1,TRUE)
a<-table.element(a,'Gaussian',1,TRUE)
a<-table.element(a,'Epanechnikov',1,TRUE)
a<-table.element(a,'Rectangular',1,TRUE)
a<-table.element(a,'Triangular',1,TRUE)
a<-table.element(a,'Biweight',1,TRUE)
a<-table.element(a,'Cosine',1,TRUE)
a<-table.element(a,'Optcosine',1,TRUE)
a<-table.row.end(a)
for(i in 1:par3) {
a<-table.row.start(a)
a<-table.element(a,mydensity[i,8],1,TRUE)
for(j in 1:7) {
a<-table.element(a,mydensity[i,j],1)
}
a<-table.row.end(a)
}
a<-table.end(a)
table.save(a,file='mytable1.tab')
}