Free Statistics

of Irreproducible Research!

Author's title

Author*Unverified author*
R Software Modulerwasp_histogram.wasp
Title produced by softwareHistogram
Date of computationFri, 26 Sep 2014 14:45:21 +0100
Cite this page as followsStatistical Computations at FreeStatistics.org, Office for Research Development and Education, URL https://freestatistics.org/blog/index.php?v=date/2014/Sep/26/t1411739262lpr9h9ro2s9lukk.htm/, Retrieved Mon, 13 May 2024 07:39:10 +0000
Statistical Computations at FreeStatistics.org, Office for Research Development and Education, URL https://freestatistics.org/blog/index.php?pk=236317, Retrieved Mon, 13 May 2024 07:39:10 +0000
QR Codes:

Original text written by user:
IsPrivate?No (this computation is public)
User-defined keywords
Estimated Impact72
Family? (F = Feedback message, R = changed R code, M = changed R Module, P = changed Parameters, D = changed Data)
-       [Histogram] [Frequentietabel e...] [2014-09-26 13:45:21] [115da6a797a228c0404960d99697d46c] [Current]
Feedback Forum

Post a new message
Dataseries X:
219
231
247
259
278
289
252
224
242
303
305
283
259
224
252
273
252
265
285
224
283
279
296
269
252
226
259
301
260
282
311
263
276
296
310
290
273
267
302
322
314
300
316
299
295
340
333
316
294
309
354
335
313
338
357
324
296
378
343
301
309
271
308
326
336
310
335
298
288
319
328
315


Summary of computational transaction
Raw Inputview raw input (R code)
Raw Outputview raw output of R engine
Computing time1 seconds
R Server'Herman Ole Andreas Wold' @ wold.wessa.net

\begin{tabular}{lllllllll}
\hline
Summary of computational transaction \tabularnewline
Raw Input & view raw input (R code)  \tabularnewline
Raw Output & view raw output of R engine  \tabularnewline
Computing time & 1 seconds \tabularnewline
R Server & 'Herman Ole Andreas Wold' @ wold.wessa.net \tabularnewline
\hline
\end{tabular}
%Source: https://freestatistics.org/blog/index.php?pk=236317&T=0

[TABLE]
[ROW][C]Summary of computational transaction[/C][/ROW]
[ROW][C]Raw Input[/C][C]view raw input (R code) [/C][/ROW]
[ROW][C]Raw Output[/C][C]view raw output of R engine [/C][/ROW]
[ROW][C]Computing time[/C][C]1 seconds[/C][/ROW]
[ROW][C]R Server[/C][C]'Herman Ole Andreas Wold' @ wold.wessa.net[/C][/ROW]
[/TABLE]
Source: https://freestatistics.org/blog/index.php?pk=236317&T=0

Globally Unique Identifier (entire table): ba.freestatistics.org/blog/index.php?pk=236317&T=0

As an alternative you can also use a QR Code:  

The GUIDs for individual cells are displayed in the table below:

Summary of computational transaction
Raw Inputview raw input (R code)
Raw Outputview raw output of R engine
Computing time1 seconds
R Server'Herman Ole Andreas Wold' @ wold.wessa.net


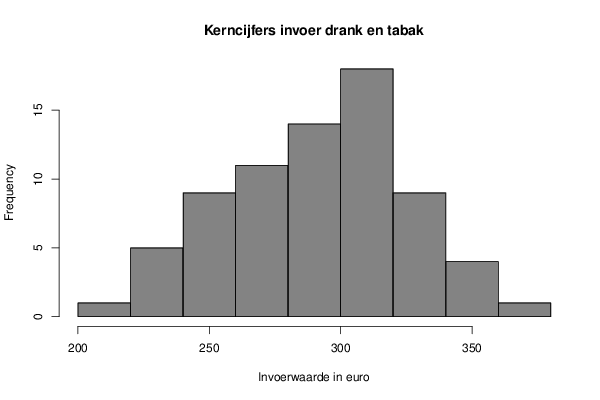
Frequency Table (Histogram)
BinsMidpointAbs. FrequencyRel. FrequencyCumul. Rel. Freq.Density
[200,220[21010.0138890.0138890.000694
[220,240[23050.0694440.0833330.003472
[240,260[25090.1250.2083330.00625
[260,280[270110.1527780.3611110.007639
[280,300[290140.1944440.5555560.009722
[300,320[310180.250.8055560.0125
[320,340[33090.1250.9305560.00625
[340,360[35040.0555560.9861110.002778
[360,380]37010.01388910.000694

\begin{tabular}{lllllllll}
\hline
Frequency Table (Histogram) \tabularnewline
Bins & Midpoint & Abs. Frequency & Rel. Frequency & Cumul. Rel. Freq. & Density \tabularnewline
[200,220[ & 210 & 1 & 0.013889 & 0.013889 & 0.000694 \tabularnewline
[220,240[ & 230 & 5 & 0.069444 & 0.083333 & 0.003472 \tabularnewline
[240,260[ & 250 & 9 & 0.125 & 0.208333 & 0.00625 \tabularnewline
[260,280[ & 270 & 11 & 0.152778 & 0.361111 & 0.007639 \tabularnewline
[280,300[ & 290 & 14 & 0.194444 & 0.555556 & 0.009722 \tabularnewline
[300,320[ & 310 & 18 & 0.25 & 0.805556 & 0.0125 \tabularnewline
[320,340[ & 330 & 9 & 0.125 & 0.930556 & 0.00625 \tabularnewline
[340,360[ & 350 & 4 & 0.055556 & 0.986111 & 0.002778 \tabularnewline
[360,380] & 370 & 1 & 0.013889 & 1 & 0.000694 \tabularnewline
\hline
\end{tabular}
%Source: https://freestatistics.org/blog/index.php?pk=236317&T=1

[TABLE]
[ROW][C]Frequency Table (Histogram)[/C][/ROW]
[ROW][C]Bins[/C][C]Midpoint[/C][C]Abs. Frequency[/C][C]Rel. Frequency[/C][C]Cumul. Rel. Freq.[/C][C]Density[/C][/ROW]
[ROW][C][200,220[[/C][C]210[/C][C]1[/C][C]0.013889[/C][C]0.013889[/C][C]0.000694[/C][/ROW]
[ROW][C][220,240[[/C][C]230[/C][C]5[/C][C]0.069444[/C][C]0.083333[/C][C]0.003472[/C][/ROW]
[ROW][C][240,260[[/C][C]250[/C][C]9[/C][C]0.125[/C][C]0.208333[/C][C]0.00625[/C][/ROW]
[ROW][C][260,280[[/C][C]270[/C][C]11[/C][C]0.152778[/C][C]0.361111[/C][C]0.007639[/C][/ROW]
[ROW][C][280,300[[/C][C]290[/C][C]14[/C][C]0.194444[/C][C]0.555556[/C][C]0.009722[/C][/ROW]
[ROW][C][300,320[[/C][C]310[/C][C]18[/C][C]0.25[/C][C]0.805556[/C][C]0.0125[/C][/ROW]
[ROW][C][320,340[[/C][C]330[/C][C]9[/C][C]0.125[/C][C]0.930556[/C][C]0.00625[/C][/ROW]
[ROW][C][340,360[[/C][C]350[/C][C]4[/C][C]0.055556[/C][C]0.986111[/C][C]0.002778[/C][/ROW]
[ROW][C][360,380][/C][C]370[/C][C]1[/C][C]0.013889[/C][C]1[/C][C]0.000694[/C][/ROW]
[/TABLE]
Source: https://freestatistics.org/blog/index.php?pk=236317&T=1

Globally Unique Identifier (entire table): ba.freestatistics.org/blog/index.php?pk=236317&T=1

As an alternative you can also use a QR Code:  

The GUIDs for individual cells are displayed in the table below:

Frequency Table (Histogram)
BinsMidpointAbs. FrequencyRel. FrequencyCumul. Rel. Freq.Density
[200,220[21010.0138890.0138890.000694
[220,240[23050.0694440.0833330.003472
[240,260[25090.1250.2083330.00625
[260,280[270110.1527780.3611110.007639
[280,300[290140.1944440.5555560.009722
[300,320[310180.250.8055560.0125
[320,340[33090.1250.9305560.00625
[340,360[35040.0555560.9861110.002778
[360,380]37010.01388910.000694


Parameters (Session):
par2 = grey ; par3 = FALSE ; par4 = Unknown ;
Parameters (R input):
par1 = ; par2 = grey ; par3 = FALSE ; par4 = Unknown ;
R code (references can be found in the software module):
par1 <- as.numeric(par1)
if (par3 == 'TRUE') par3 <- TRUE
if (par3 == 'FALSE') par3 <- FALSE
if (par4 == 'Unknown') par1 <- as.numeric(par1)
if (par4 == 'Interval/Ratio') par1 <- as.numeric(par1)
if (par4 == '3-point Likert') par1 <- c(1:3 - 0.5, 3.5)
if (par4 == '4-point Likert') par1 <- c(1:4 - 0.5, 4.5)
if (par4 == '5-point Likert') par1 <- c(1:5 - 0.5, 5.5)
if (par4 == '6-point Likert') par1 <- c(1:6 - 0.5, 6.5)
if (par4 == '7-point Likert') par1 <- c(1:7 - 0.5, 7.5)
if (par4 == '8-point Likert') par1 <- c(1:8 - 0.5, 8.5)
if (par4 == '9-point Likert') par1 <- c(1:9 - 0.5, 9.5)
if (par4 == '10-point Likert') par1 <- c(1:10 - 0.5, 10.5)
bitmap(file='test1.png')
if(is.numeric(x[1])) {
if (is.na(par1)) {
myhist<-hist(x,col=par2,main=main,xlab=xlab,right=par3)
} else {
if (par1 < 0) par1 <- 3
if (par1 > 50) par1 <- 50
myhist<-hist(x,breaks=par1,col=par2,main=main,xlab=xlab,right=par3)
}
} else {
plot(mytab <- table(x),col=par2,main='Frequency Plot',xlab=xlab,ylab='Absolute Frequency')
}
dev.off()
if(is.numeric(x[1])) {
myhist
n <- length(x)
load(file='createtable')
a<-table.start()
a<-table.row.start(a)
a<-table.element(a,hyperlink('histogram.htm','Frequency Table (Histogram)',''),6,TRUE)
a<-table.row.end(a)
a<-table.row.start(a)
a<-table.element(a,'Bins',header=TRUE)
a<-table.element(a,'Midpoint',header=TRUE)
a<-table.element(a,'Abs. Frequency',header=TRUE)
a<-table.element(a,'Rel. Frequency',header=TRUE)
a<-table.element(a,'Cumul. Rel. Freq.',header=TRUE)
a<-table.element(a,'Density',header=TRUE)
a<-table.row.end(a)
crf <- 0
if (par3 == FALSE) mybracket <- '[' else mybracket <- ']'
mynumrows <- (length(myhist$breaks)-1)
for (i in 1:mynumrows) {
a<-table.row.start(a)
if (i == 1)
dum <- paste('[',myhist$breaks[i],sep='')
else
dum <- paste(mybracket,myhist$breaks[i],sep='')
dum <- paste(dum,myhist$breaks[i+1],sep=',')
if (i==mynumrows)
dum <- paste(dum,']',sep='')
else
dum <- paste(dum,mybracket,sep='')
a<-table.element(a,dum,header=TRUE)
a<-table.element(a,myhist$mids[i])
a<-table.element(a,myhist$counts[i])
rf <- myhist$counts[i]/n
crf <- crf + rf
a<-table.element(a,round(rf,6))
a<-table.element(a,round(crf,6))
a<-table.element(a,round(myhist$density[i],6))
a<-table.row.end(a)
}
a<-table.end(a)
table.save(a,file='mytable.tab')
} else {
mytab
reltab <- mytab / sum(mytab)
n <- length(mytab)
load(file='createtable')
a<-table.start()
a<-table.row.start(a)
a<-table.element(a,'Frequency Table (Categorical Data)',3,TRUE)
a<-table.row.end(a)
a<-table.row.start(a)
a<-table.element(a,'Category',header=TRUE)
a<-table.element(a,'Abs. Frequency',header=TRUE)
a<-table.element(a,'Rel. Frequency',header=TRUE)
a<-table.row.end(a)
for (i in 1:n) {
a<-table.row.start(a)
a<-table.element(a,labels(mytab)$x[i],header=TRUE)
a<-table.element(a,mytab[i])
a<-table.element(a,round(reltab[i],4))
a<-table.row.end(a)
}
a<-table.end(a)
table.save(a,file='mytable1.tab')
}