Free Statistics
of Irreproducible Research!
Description of Statistical Computation | |||||||||||||||||||||||||||||||||||||||||
|---|---|---|---|---|---|---|---|---|---|---|---|---|---|---|---|---|---|---|---|---|---|---|---|---|---|---|---|---|---|---|---|---|---|---|---|---|---|---|---|---|---|
| Author's title | |||||||||||||||||||||||||||||||||||||||||
| Author | *Unverified author* | ||||||||||||||||||||||||||||||||||||||||
| R Software Module | rwasp_univariatedataseries.wasp | ||||||||||||||||||||||||||||||||||||||||
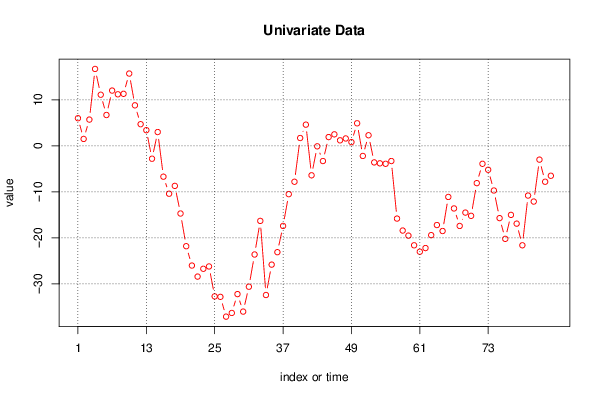
| Title produced by software | Univariate Data Series | ||||||||||||||||||||||||||||||||||||||||
| Date of computation | Sun, 28 Sep 2014 19:49:56 +0100 | ||||||||||||||||||||||||||||||||||||||||
| Cite this page as follows | Statistical Computations at FreeStatistics.org, Office for Research Development and Education, URL https://freestatistics.org/blog/index.php?v=date/2014/Sep/28/t1411930234rzn8lr89xqgmg1j.htm/, Retrieved Sun, 12 May 2024 20:34:35 +0000 | ||||||||||||||||||||||||||||||||||||||||
| Statistical Computations at FreeStatistics.org, Office for Research Development and Education, URL https://freestatistics.org/blog/index.php?pk=236728, Retrieved Sun, 12 May 2024 20:34:35 +0000 | |||||||||||||||||||||||||||||||||||||||||
| QR Codes: | |||||||||||||||||||||||||||||||||||||||||
|
| |||||||||||||||||||||||||||||||||||||||||
| Original text written by user: | |||||||||||||||||||||||||||||||||||||||||
| IsPrivate? | No (this computation is public) | ||||||||||||||||||||||||||||||||||||||||
| User-defined keywords | |||||||||||||||||||||||||||||||||||||||||
| Estimated Impact | 66 | ||||||||||||||||||||||||||||||||||||||||
Tree of Dependent Computations | |||||||||||||||||||||||||||||||||||||||||
| Family? (F = Feedback message, R = changed R code, M = changed R Module, P = changed Parameters, D = changed Data) | |||||||||||||||||||||||||||||||||||||||||
| - [Univariate Data Series] [] [2014-09-28 18:43:41] [5ec968f6342c3a2f2357137b8ba7cfaf] - R PD [Univariate Data Series] [] [2014-09-28 18:49:56] [fc9e02cb2d6d14d0c83d12e3a82852a5] [Current] - RMPD [Histogram] [] [2014-09-30 12:42:52] [5ec968f6342c3a2f2357137b8ba7cfaf] - RMPD [Kernel Density Estimation] [] [2014-09-30 13:03:10] [5ec968f6342c3a2f2357137b8ba7cfaf] | |||||||||||||||||||||||||||||||||||||||||
| Feedback Forum | |||||||||||||||||||||||||||||||||||||||||
Post a new message | |||||||||||||||||||||||||||||||||||||||||
Dataset | |||||||||||||||||||||||||||||||||||||||||
| Dataseries X: | |||||||||||||||||||||||||||||||||||||||||
6 1,5 5,7 16,7 11,1 6,7 12 11,2 11,3 15,7 8,8 4,7 3,4 -2,8 3 -6,7 -10,4 -8,7 -14,7 -21,8 -26 -28,4 -26,7 -26,2 -32,7 -32,8 -37,1 -36,3 -32,2 -36 -30,6 -23,6 -16,3 -32,4 -25,8 -23,1 -17,4 -10,5 -7,8 1,7 4,6 -6,4 -0,1 -3,3 1,9 2,5 1,2 1,6 0,8 4,9 -2,2 2,3 -3,6 -3,8 -3,9 -3,3 -15,8 -18,4 -19,5 -21,6 -23 -22,2 -19,4 -17,2 -18,5 -11,1 -13,6 -17,4 -14,5 -15,2 -8,1 -3,9 -5,2 -9,7 -15,7 -20,2 -15 -16,9 -21,6 -10,8 -12,1 -3 -7,8 -6,5 | |||||||||||||||||||||||||||||||||||||||||
Tables (Output of Computation) | |||||||||||||||||||||||||||||||||||||||||
| |||||||||||||||||||||||||||||||||||||||||
Figures (Output of Computation) | |||||||||||||||||||||||||||||||||||||||||
Input Parameters & R Code | |||||||||||||||||||||||||||||||||||||||||
| Parameters (Session): | |||||||||||||||||||||||||||||||||||||||||
| par1 = Handel in textielartikelen ; par2 = Belgostat ; par3 = Handel in textielartikelen-seizoensgezuiverde bruto reeks ; par4 = 12 ; | |||||||||||||||||||||||||||||||||||||||||
| Parameters (R input): | |||||||||||||||||||||||||||||||||||||||||
| par1 = Handel in textielartikelen ; par2 = Belgostat ; par3 = Handel in textielartikelen-seizoensgezuiverde bruto reeks ; par4 = 12 ; | |||||||||||||||||||||||||||||||||||||||||
| R code (references can be found in the software module): | |||||||||||||||||||||||||||||||||||||||||
if (par4 != 'No season') { | |||||||||||||||||||||||||||||||||||||||||