Free Statistics
of Irreproducible Research!
Description of Statistical Computation | |||||||||||||||||||||||||||||||||||||||||
|---|---|---|---|---|---|---|---|---|---|---|---|---|---|---|---|---|---|---|---|---|---|---|---|---|---|---|---|---|---|---|---|---|---|---|---|---|---|---|---|---|---|
| Author's title | |||||||||||||||||||||||||||||||||||||||||
| Author | *Unverified author* | ||||||||||||||||||||||||||||||||||||||||
| R Software Module | rwasp_univariatedataseries.wasp | ||||||||||||||||||||||||||||||||||||||||
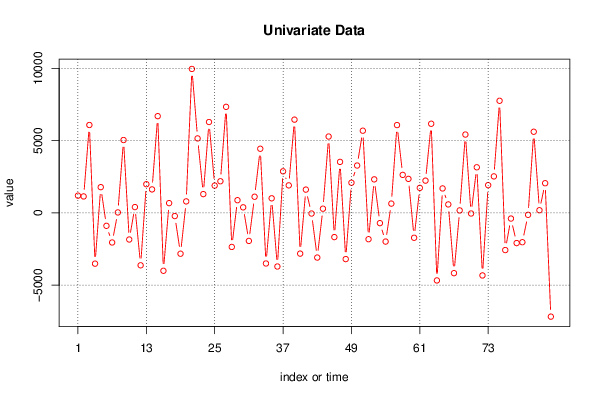
| Title produced by software | Univariate Data Series | ||||||||||||||||||||||||||||||||||||||||
| Date of computation | Mon, 29 Sep 2014 17:15:36 +0100 | ||||||||||||||||||||||||||||||||||||||||
| Cite this page as follows | Statistical Computations at FreeStatistics.org, Office for Research Development and Education, URL https://freestatistics.org/blog/index.php?v=date/2014/Sep/29/t141200736423oq1yllaen0san.htm/, Retrieved Sun, 12 May 2024 15:06:26 +0000 | ||||||||||||||||||||||||||||||||||||||||
| Statistical Computations at FreeStatistics.org, Office for Research Development and Education, URL https://freestatistics.org/blog/index.php?pk=236798, Retrieved Sun, 12 May 2024 15:06:26 +0000 | |||||||||||||||||||||||||||||||||||||||||
| QR Codes: | |||||||||||||||||||||||||||||||||||||||||
|
| |||||||||||||||||||||||||||||||||||||||||
| Original text written by user: | |||||||||||||||||||||||||||||||||||||||||
| IsPrivate? | No (this computation is public) | ||||||||||||||||||||||||||||||||||||||||
| User-defined keywords | |||||||||||||||||||||||||||||||||||||||||
| Estimated Impact | 65 | ||||||||||||||||||||||||||||||||||||||||
Tree of Dependent Computations | |||||||||||||||||||||||||||||||||||||||||
| Family? (F = Feedback message, R = changed R code, M = changed R Module, P = changed Parameters, D = changed Data) | |||||||||||||||||||||||||||||||||||||||||
| - [Univariate Data Series] [] [2014-09-29 16:15:36] [0837030ca90013de3b1661dab7c6b0da] [Current] - RMP [Univariate Data Series] [] [2014-09-29 16:32:23] [ff4b6015810e16a492ef4319b84b42ce] - RMP [Histogram] [] [2014-09-29 16:35:02] [ff4b6015810e16a492ef4319b84b42ce] - RMP [Kernel Density Estimation] [] [2014-09-29 16:36:34] [ff4b6015810e16a492ef4319b84b42ce] | |||||||||||||||||||||||||||||||||||||||||
| Feedback Forum | |||||||||||||||||||||||||||||||||||||||||
Post a new message | |||||||||||||||||||||||||||||||||||||||||
Dataset | |||||||||||||||||||||||||||||||||||||||||
| Dataseries X: | |||||||||||||||||||||||||||||||||||||||||
1196 1141 6081 -3508 1782 -891 -2043 35 5042 -1837 406 -3621 1987 1627 6692 -3999 679 -215 -2820 799 9957 5154 1302 6287 1891 2191 7336 -2351 881 388 -1936 1120 4438 -3495 1012 -3704 2879 1907 6451 -2814 1613 -40 -3086 292 5283 -1671 3529 -3191 2090 3278 5686 -1817 2322 -705 -1980 646 6077 2632 2356 -1717 1733 2232 6167 -4668 1694 589 -4163 174 5421 -38 3158 -4322 1920 2527 7755 -2567 -388 -2084 -2024 -131 5615 187 2054 -7172 | |||||||||||||||||||||||||||||||||||||||||
Tables (Output of Computation) | |||||||||||||||||||||||||||||||||||||||||
| |||||||||||||||||||||||||||||||||||||||||
Figures (Output of Computation) | |||||||||||||||||||||||||||||||||||||||||
Input Parameters & R Code | |||||||||||||||||||||||||||||||||||||||||
| Parameters (Session): | |||||||||||||||||||||||||||||||||||||||||
| par1 = Financiering van het netto te financieren saldo van de Schatkist ; par2 = http://www.nbb.be/belgostat/PresentationLinker?TableId=941000024&Lang=N ; par3 = Financiering van het netto te financieren saldo van de Schatkist ; par4 = 12 ; | |||||||||||||||||||||||||||||||||||||||||
| Parameters (R input): | |||||||||||||||||||||||||||||||||||||||||
| par1 = Financiering van het netto te financieren saldo van de Schatkist ; par2 = http://www.nbb.be/belgostat/PresentationLinker?TableId=941000024&Lang=N ; par3 = Financiering van het netto te financieren saldo van de Schatkist ; par4 = 12 ; | |||||||||||||||||||||||||||||||||||||||||
| R code (references can be found in the software module): | |||||||||||||||||||||||||||||||||||||||||
if (par4 != 'No season') { | |||||||||||||||||||||||||||||||||||||||||