Free Statistics

of Irreproducible Research!

Author's title

Author*The author of this computation has been verified*
R Software Modulerwasp_multipleregression.wasp
Title produced by softwareMultiple Regression
Date of computationWed, 02 Dec 2015 08:47:08 +0000
Cite this page as followsStatistical Computations at FreeStatistics.org, Office for Research Development and Education, URL https://freestatistics.org/blog/index.php?v=date/2015/Dec/02/t144904627128n6r6e6n4riab6.htm/, Retrieved Sat, 18 May 2024 04:49:29 +0000
Statistical Computations at FreeStatistics.org, Office for Research Development and Education, URL https://freestatistics.org/blog/index.php?pk=284787, Retrieved Sat, 18 May 2024 04:49:29 +0000
QR Codes:

Original text written by user:
IsPrivate?No (this computation is public)
User-defined keywords
Estimated Impact119
Family? (F = Feedback message, R = changed R code, M = changed R Module, P = changed Parameters, D = changed Data)
-       [Multiple Regression] [Multiple regressi...] [2015-12-02 08:47:08] [9b4ece21719e6dde02765eb8dee9496c] [Current]
- R  D    [Multiple Regression] [Multiple regressi...] [2015-12-06 11:38:09] [76f952d0cbb1fda48ce00a111a80e232]
Feedback Forum

Post a new message
Dataseries X:
217829 389209
240241.7 417715.1
239051.7 404111.1
246464.5 404640.2
228891.1 382046.5
197867.6 342862.4
162481.3 269440.2
148509.1 245567.7
145747.7 245555.8
159647.4 279248
185979 335025.5
216834.9 405310.9
210560 389292.3
222582 404187.1
201903.3 375080.4
204623.8 383723.7
195642.43812383 374991.33152081
163769.45144036 308449.53374478
138633.38717802 287001.09152751
163999.575 332070.6175
171293.7542423 364306.6432903
188909.78914584 380321.15202656
194603.50086402 390992.25716633
192177.71723536 383199.53159502
178592.93454859 353004.90968947
163221.72832722 333659.78078553
175648.43522185 379586.79498549
189041.70871173 405881.34656505
158366.10619425 346697.73349159
164943.77237346 369273.09717268
185048.7637639 416809.32619049
181858.23081587 423493.39006554


Summary of computational transaction
Raw Inputview raw input (R code)
Raw Outputview raw output of R engine
Computing time4 seconds
R Server'Gwilym Jenkins' @ jenkins.wessa.net

\begin{tabular}{lllllllll}
\hline
Summary of computational transaction \tabularnewline
Raw Input & view raw input (R code)  \tabularnewline
Raw Output & view raw output of R engine  \tabularnewline
Computing time & 4 seconds \tabularnewline
R Server & 'Gwilym Jenkins' @ jenkins.wessa.net \tabularnewline
\hline
\end{tabular}
%Source: https://freestatistics.org/blog/index.php?pk=284787&T=0

[TABLE]
[ROW][C]Summary of computational transaction[/C][/ROW]
[ROW][C]Raw Input[/C][C]view raw input (R code) [/C][/ROW]
[ROW][C]Raw Output[/C][C]view raw output of R engine [/C][/ROW]
[ROW][C]Computing time[/C][C]4 seconds[/C][/ROW]
[ROW][C]R Server[/C][C]'Gwilym Jenkins' @ jenkins.wessa.net[/C][/ROW]
[/TABLE]
Source: https://freestatistics.org/blog/index.php?pk=284787&T=0

Globally Unique Identifier (entire table): ba.freestatistics.org/blog/index.php?pk=284787&T=0

As an alternative you can also use a QR Code:  

The GUIDs for individual cells are displayed in the table below:

Summary of computational transaction
Raw Inputview raw input (R code)
Raw Outputview raw output of R engine
Computing time4 seconds
R Server'Gwilym Jenkins' @ jenkins.wessa.net


Multiple Linear Regression - Estimated Regression Equation
IABWerklhVrouwen[t] = + 17849.8 + 0.489264IABWerklhTotaal[t] + 0.0735594`IABWerklhVrouwen(t-1)`[t] + 0.0460898`IABWerklhVrouwen(t-2)`[t] -1886.54t + e[t]
Warning: you did not specify the column number of the endogenous series! The first column was selected by default.

\begin{tabular}{lllllllll}
\hline
Multiple Linear Regression - Estimated Regression Equation \tabularnewline
IABWerklhVrouwen[t] =  +  17849.8 +  0.489264IABWerklhTotaal[t] +  0.0735594`IABWerklhVrouwen(t-1)`[t] +  0.0460898`IABWerklhVrouwen(t-2)`[t] -1886.54t  + e[t] \tabularnewline
Warning: you did not specify the column number of the endogenous series! The first column was selected by default. \tabularnewline
\hline
\end{tabular}
%Source: https://freestatistics.org/blog/index.php?pk=284787&T=1

[TABLE]
[ROW][C]Multiple Linear Regression - Estimated Regression Equation[/C][/ROW]
[ROW][C]IABWerklhVrouwen[t] =  +  17849.8 +  0.489264IABWerklhTotaal[t] +  0.0735594`IABWerklhVrouwen(t-1)`[t] +  0.0460898`IABWerklhVrouwen(t-2)`[t] -1886.54t  + e[t][/C][/ROW]
[ROW][C]Warning: you did not specify the column number of the endogenous series! The first column was selected by default.[/C][/ROW]
[/TABLE]
Source: https://freestatistics.org/blog/index.php?pk=284787&T=1

Globally Unique Identifier (entire table): ba.freestatistics.org/blog/index.php?pk=284787&T=1

As an alternative you can also use a QR Code:  

The GUIDs for individual cells are displayed in the table below:

Multiple Linear Regression - Estimated Regression Equation
IABWerklhVrouwen[t] = + 17849.8 + 0.489264IABWerklhTotaal[t] + 0.0735594`IABWerklhVrouwen(t-1)`[t] + 0.0460898`IABWerklhVrouwen(t-2)`[t] -1886.54t + e[t]
Warning: you did not specify the column number of the endogenous series! The first column was selected by default.


Multiple Linear Regression - Ordinary Least Squares
VariableParameterS.D.T-STATH0: parameter = 02-tail p-value1-tail p-value
(Intercept)+1.785e+04 8511+2.0970e+00 0.04624 0.02312
IABWerklhTotaal+0.4893 0.02914+1.6790e+01 4.01e-15 2.005e-15
`IABWerklhVrouwen(t-1)`+0.07356 0.07594+9.6860e-01 0.342 0.171
`IABWerklhVrouwen(t-2)`+0.04609 0.05703+8.0820e-01 0.4266 0.2133
t-1886 142.3-1.3260e+01 8.211e-13 4.105e-13

\begin{tabular}{lllllllll}
\hline
Multiple Linear Regression - Ordinary Least Squares \tabularnewline
Variable & Parameter & S.D. & T-STATH0: parameter = 0 & 2-tail p-value & 1-tail p-value \tabularnewline
(Intercept) & +1.785e+04 &  8511 & +2.0970e+00 &  0.04624 &  0.02312 \tabularnewline
IABWerklhTotaal & +0.4893 &  0.02914 & +1.6790e+01 &  4.01e-15 &  2.005e-15 \tabularnewline
`IABWerklhVrouwen(t-1)` & +0.07356 &  0.07594 & +9.6860e-01 &  0.342 &  0.171 \tabularnewline
`IABWerklhVrouwen(t-2)` & +0.04609 &  0.05703 & +8.0820e-01 &  0.4266 &  0.2133 \tabularnewline
t & -1886 &  142.3 & -1.3260e+01 &  8.211e-13 &  4.105e-13 \tabularnewline
\hline
\end{tabular}
%Source: https://freestatistics.org/blog/index.php?pk=284787&T=2

[TABLE]
[ROW][C]Multiple Linear Regression - Ordinary Least Squares[/C][/ROW]
[ROW][C]Variable[/C][C]Parameter[/C][C]S.D.[/C][C]T-STATH0: parameter = 0[/C][C]2-tail p-value[/C][C]1-tail p-value[/C][/ROW]
[ROW][C](Intercept)[/C][C]+1.785e+04[/C][C] 8511[/C][C]+2.0970e+00[/C][C] 0.04624[/C][C] 0.02312[/C][/ROW]
[ROW][C]IABWerklhTotaal[/C][C]+0.4893[/C][C] 0.02914[/C][C]+1.6790e+01[/C][C] 4.01e-15[/C][C] 2.005e-15[/C][/ROW]
[ROW][C]`IABWerklhVrouwen(t-1)`[/C][C]+0.07356[/C][C] 0.07594[/C][C]+9.6860e-01[/C][C] 0.342[/C][C] 0.171[/C][/ROW]
[ROW][C]`IABWerklhVrouwen(t-2)`[/C][C]+0.04609[/C][C] 0.05703[/C][C]+8.0820e-01[/C][C] 0.4266[/C][C] 0.2133[/C][/ROW]
[ROW][C]t[/C][C]-1886[/C][C] 142.3[/C][C]-1.3260e+01[/C][C] 8.211e-13[/C][C] 4.105e-13[/C][/ROW]
[/TABLE]
Source: https://freestatistics.org/blog/index.php?pk=284787&T=2

Globally Unique Identifier (entire table): ba.freestatistics.org/blog/index.php?pk=284787&T=2

As an alternative you can also use a QR Code:  

The GUIDs for individual cells are displayed in the table below:

Multiple Linear Regression - Ordinary Least Squares
VariableParameterS.D.T-STATH0: parameter = 02-tail p-value1-tail p-value
(Intercept)+1.785e+04 8511+2.0970e+00 0.04624 0.02312
IABWerklhTotaal+0.4893 0.02914+1.6790e+01 4.01e-15 2.005e-15
`IABWerklhVrouwen(t-1)`+0.07356 0.07594+9.6860e-01 0.342 0.171
`IABWerklhVrouwen(t-2)`+0.04609 0.05703+8.0820e-01 0.4266 0.2133
t-1886 142.3-1.3260e+01 8.211e-13 4.105e-13


Multiple Linear Regression - Regression Statistics
Multiple R 0.9883
R-squared 0.9767
Adjusted R-squared 0.973
F-TEST (value) 262.2
F-TEST (DF numerator)4
F-TEST (DF denominator)25
p-value 0
Multiple Linear Regression - Residual Statistics
Residual Standard Deviation 4504
Sum Squared Residuals 5.072e+08

\begin{tabular}{lllllllll}
\hline
Multiple Linear Regression - Regression Statistics \tabularnewline
Multiple R &  0.9883 \tabularnewline
R-squared &  0.9767 \tabularnewline
Adjusted R-squared &  0.973 \tabularnewline
F-TEST (value) &  262.2 \tabularnewline
F-TEST (DF numerator) & 4 \tabularnewline
F-TEST (DF denominator) & 25 \tabularnewline
p-value &  0 \tabularnewline
Multiple Linear Regression - Residual Statistics \tabularnewline
Residual Standard Deviation &  4504 \tabularnewline
Sum Squared Residuals &  5.072e+08 \tabularnewline
\hline
\end{tabular}
%Source: https://freestatistics.org/blog/index.php?pk=284787&T=3

[TABLE]
[ROW][C]Multiple Linear Regression - Regression Statistics[/C][/ROW]
[ROW][C]Multiple R[/C][C] 0.9883[/C][/ROW]
[ROW][C]R-squared[/C][C] 0.9767[/C][/ROW]
[ROW][C]Adjusted R-squared[/C][C] 0.973[/C][/ROW]
[ROW][C]F-TEST (value)[/C][C] 262.2[/C][/ROW]
[ROW][C]F-TEST (DF numerator)[/C][C]4[/C][/ROW]
[ROW][C]F-TEST (DF denominator)[/C][C]25[/C][/ROW]
[ROW][C]p-value[/C][C] 0[/C][/ROW]
[ROW][C]Multiple Linear Regression - Residual Statistics[/C][/ROW]
[ROW][C]Residual Standard Deviation[/C][C] 4504[/C][/ROW]
[ROW][C]Sum Squared Residuals[/C][C] 5.072e+08[/C][/ROW]
[/TABLE]
Source: https://freestatistics.org/blog/index.php?pk=284787&T=3

Globally Unique Identifier (entire table): ba.freestatistics.org/blog/index.php?pk=284787&T=3

As an alternative you can also use a QR Code:  

The GUIDs for individual cells are displayed in the table below:

Multiple Linear Regression - Regression Statistics
Multiple R 0.9883
R-squared 0.9767
Adjusted R-squared 0.973
F-TEST (value) 262.2
F-TEST (DF numerator)4
F-TEST (DF denominator)25
p-value 0
Multiple Linear Regression - Residual Statistics
Residual Standard Deviation 4504
Sum Squared Residuals 5.072e+08


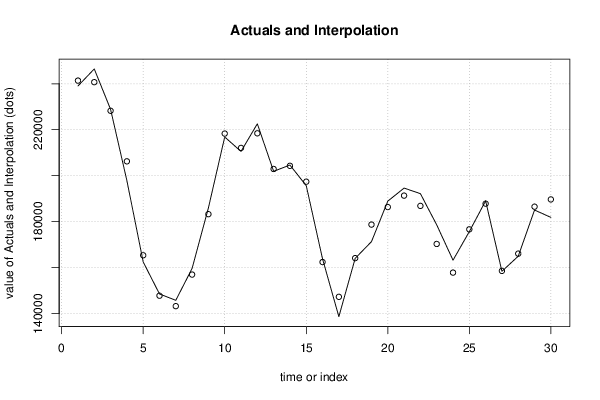
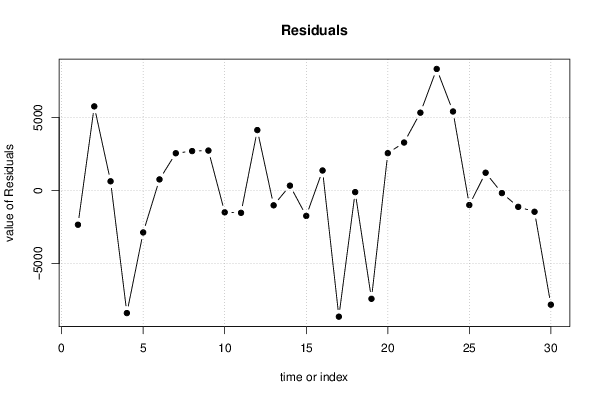
Multiple Linear Regression - Actuals, Interpolation, and Residuals
Time or IndexActualsInterpolationForecastResidualsPrediction Error
1 2.391e+05 2.414e+05-2340
2 2.465e+05 2.407e+05 5755
3 2.289e+05 2.283e+05 631.5
4 1.979e+05 2.063e+05-8383
5 1.625e+05 1.653e+05-2868
6 1.485e+05 1.478e+05 759.3
7 1.457e+05 1.432e+05 2549
8 1.596e+05 1.569e+05 2698
9 1.86e+05 1.832e+05 2731
10 2.168e+05 2.183e+05-1492
11 2.106e+05 2.121e+05-1527
12 2.226e+05 2.184e+05 4134
13 2.019e+05 2.029e+05-1013
14 2.046e+05 2.043e+05 332.6
15 1.956e+05 1.974e+05-1737
16 1.638e+05 1.624e+05 1368
17 1.386e+05 1.473e+05-8629
18 1.64e+05 1.641e+05-108.7
19 1.713e+05 1.787e+05-7407
20 1.889e+05 1.864e+05 2554
21 1.946e+05 1.913e+05 3281
22 1.922e+05 1.869e+05 5324
23 1.786e+05 1.703e+05 8315
24 1.632e+05 1.578e+05 5406
25 1.756e+05 1.766e+05-994
26 1.89e+05 1.878e+05 1215
27 1.584e+05 1.585e+05-175.4
28 1.649e+05 1.661e+05-1117
29 1.85e+05 1.865e+05-1454
30 1.819e+05 1.897e+05-7810

\begin{tabular}{lllllllll}
\hline
Multiple Linear Regression - Actuals, Interpolation, and Residuals \tabularnewline
Time or Index & Actuals & InterpolationForecast & ResidualsPrediction Error \tabularnewline
1 &  2.391e+05 &  2.414e+05 & -2340 \tabularnewline
2 &  2.465e+05 &  2.407e+05 &  5755 \tabularnewline
3 &  2.289e+05 &  2.283e+05 &  631.5 \tabularnewline
4 &  1.979e+05 &  2.063e+05 & -8383 \tabularnewline
5 &  1.625e+05 &  1.653e+05 & -2868 \tabularnewline
6 &  1.485e+05 &  1.478e+05 &  759.3 \tabularnewline
7 &  1.457e+05 &  1.432e+05 &  2549 \tabularnewline
8 &  1.596e+05 &  1.569e+05 &  2698 \tabularnewline
9 &  1.86e+05 &  1.832e+05 &  2731 \tabularnewline
10 &  2.168e+05 &  2.183e+05 & -1492 \tabularnewline
11 &  2.106e+05 &  2.121e+05 & -1527 \tabularnewline
12 &  2.226e+05 &  2.184e+05 &  4134 \tabularnewline
13 &  2.019e+05 &  2.029e+05 & -1013 \tabularnewline
14 &  2.046e+05 &  2.043e+05 &  332.6 \tabularnewline
15 &  1.956e+05 &  1.974e+05 & -1737 \tabularnewline
16 &  1.638e+05 &  1.624e+05 &  1368 \tabularnewline
17 &  1.386e+05 &  1.473e+05 & -8629 \tabularnewline
18 &  1.64e+05 &  1.641e+05 & -108.7 \tabularnewline
19 &  1.713e+05 &  1.787e+05 & -7407 \tabularnewline
20 &  1.889e+05 &  1.864e+05 &  2554 \tabularnewline
21 &  1.946e+05 &  1.913e+05 &  3281 \tabularnewline
22 &  1.922e+05 &  1.869e+05 &  5324 \tabularnewline
23 &  1.786e+05 &  1.703e+05 &  8315 \tabularnewline
24 &  1.632e+05 &  1.578e+05 &  5406 \tabularnewline
25 &  1.756e+05 &  1.766e+05 & -994 \tabularnewline
26 &  1.89e+05 &  1.878e+05 &  1215 \tabularnewline
27 &  1.584e+05 &  1.585e+05 & -175.4 \tabularnewline
28 &  1.649e+05 &  1.661e+05 & -1117 \tabularnewline
29 &  1.85e+05 &  1.865e+05 & -1454 \tabularnewline
30 &  1.819e+05 &  1.897e+05 & -7810 \tabularnewline
\hline
\end{tabular}
%Source: https://freestatistics.org/blog/index.php?pk=284787&T=4

[TABLE]
[ROW][C]Multiple Linear Regression - Actuals, Interpolation, and Residuals[/C][/ROW]
[ROW][C]Time or Index[/C][C]Actuals[/C][C]InterpolationForecast[/C][C]ResidualsPrediction Error[/C][/ROW]
[ROW][C]1[/C][C] 2.391e+05[/C][C] 2.414e+05[/C][C]-2340[/C][/ROW]
[ROW][C]2[/C][C] 2.465e+05[/C][C] 2.407e+05[/C][C] 5755[/C][/ROW]
[ROW][C]3[/C][C] 2.289e+05[/C][C] 2.283e+05[/C][C] 631.5[/C][/ROW]
[ROW][C]4[/C][C] 1.979e+05[/C][C] 2.063e+05[/C][C]-8383[/C][/ROW]
[ROW][C]5[/C][C] 1.625e+05[/C][C] 1.653e+05[/C][C]-2868[/C][/ROW]
[ROW][C]6[/C][C] 1.485e+05[/C][C] 1.478e+05[/C][C] 759.3[/C][/ROW]
[ROW][C]7[/C][C] 1.457e+05[/C][C] 1.432e+05[/C][C] 2549[/C][/ROW]
[ROW][C]8[/C][C] 1.596e+05[/C][C] 1.569e+05[/C][C] 2698[/C][/ROW]
[ROW][C]9[/C][C] 1.86e+05[/C][C] 1.832e+05[/C][C] 2731[/C][/ROW]
[ROW][C]10[/C][C] 2.168e+05[/C][C] 2.183e+05[/C][C]-1492[/C][/ROW]
[ROW][C]11[/C][C] 2.106e+05[/C][C] 2.121e+05[/C][C]-1527[/C][/ROW]
[ROW][C]12[/C][C] 2.226e+05[/C][C] 2.184e+05[/C][C] 4134[/C][/ROW]
[ROW][C]13[/C][C] 2.019e+05[/C][C] 2.029e+05[/C][C]-1013[/C][/ROW]
[ROW][C]14[/C][C] 2.046e+05[/C][C] 2.043e+05[/C][C] 332.6[/C][/ROW]
[ROW][C]15[/C][C] 1.956e+05[/C][C] 1.974e+05[/C][C]-1737[/C][/ROW]
[ROW][C]16[/C][C] 1.638e+05[/C][C] 1.624e+05[/C][C] 1368[/C][/ROW]
[ROW][C]17[/C][C] 1.386e+05[/C][C] 1.473e+05[/C][C]-8629[/C][/ROW]
[ROW][C]18[/C][C] 1.64e+05[/C][C] 1.641e+05[/C][C]-108.7[/C][/ROW]
[ROW][C]19[/C][C] 1.713e+05[/C][C] 1.787e+05[/C][C]-7407[/C][/ROW]
[ROW][C]20[/C][C] 1.889e+05[/C][C] 1.864e+05[/C][C] 2554[/C][/ROW]
[ROW][C]21[/C][C] 1.946e+05[/C][C] 1.913e+05[/C][C] 3281[/C][/ROW]
[ROW][C]22[/C][C] 1.922e+05[/C][C] 1.869e+05[/C][C] 5324[/C][/ROW]
[ROW][C]23[/C][C] 1.786e+05[/C][C] 1.703e+05[/C][C] 8315[/C][/ROW]
[ROW][C]24[/C][C] 1.632e+05[/C][C] 1.578e+05[/C][C] 5406[/C][/ROW]
[ROW][C]25[/C][C] 1.756e+05[/C][C] 1.766e+05[/C][C]-994[/C][/ROW]
[ROW][C]26[/C][C] 1.89e+05[/C][C] 1.878e+05[/C][C] 1215[/C][/ROW]
[ROW][C]27[/C][C] 1.584e+05[/C][C] 1.585e+05[/C][C]-175.4[/C][/ROW]
[ROW][C]28[/C][C] 1.649e+05[/C][C] 1.661e+05[/C][C]-1117[/C][/ROW]
[ROW][C]29[/C][C] 1.85e+05[/C][C] 1.865e+05[/C][C]-1454[/C][/ROW]
[ROW][C]30[/C][C] 1.819e+05[/C][C] 1.897e+05[/C][C]-7810[/C][/ROW]
[/TABLE]
Source: https://freestatistics.org/blog/index.php?pk=284787&T=4

Globally Unique Identifier (entire table): ba.freestatistics.org/blog/index.php?pk=284787&T=4

As an alternative you can also use a QR Code:  

The GUIDs for individual cells are displayed in the table below:

Multiple Linear Regression - Actuals, Interpolation, and Residuals
Time or IndexActualsInterpolationForecastResidualsPrediction Error
1 2.391e+05 2.414e+05-2340
2 2.465e+05 2.407e+05 5755
3 2.289e+05 2.283e+05 631.5
4 1.979e+05 2.063e+05-8383
5 1.625e+05 1.653e+05-2868
6 1.485e+05 1.478e+05 759.3
7 1.457e+05 1.432e+05 2549
8 1.596e+05 1.569e+05 2698
9 1.86e+05 1.832e+05 2731
10 2.168e+05 2.183e+05-1492
11 2.106e+05 2.121e+05-1527
12 2.226e+05 2.184e+05 4134
13 2.019e+05 2.029e+05-1013
14 2.046e+05 2.043e+05 332.6
15 1.956e+05 1.974e+05-1737
16 1.638e+05 1.624e+05 1368
17 1.386e+05 1.473e+05-8629
18 1.64e+05 1.641e+05-108.7
19 1.713e+05 1.787e+05-7407
20 1.889e+05 1.864e+05 2554
21 1.946e+05 1.913e+05 3281
22 1.922e+05 1.869e+05 5324
23 1.786e+05 1.703e+05 8315
24 1.632e+05 1.578e+05 5406
25 1.756e+05 1.766e+05-994
26 1.89e+05 1.878e+05 1215
27 1.584e+05 1.585e+05-175.4
28 1.649e+05 1.661e+05-1117
29 1.85e+05 1.865e+05-1454
30 1.819e+05 1.897e+05-7810


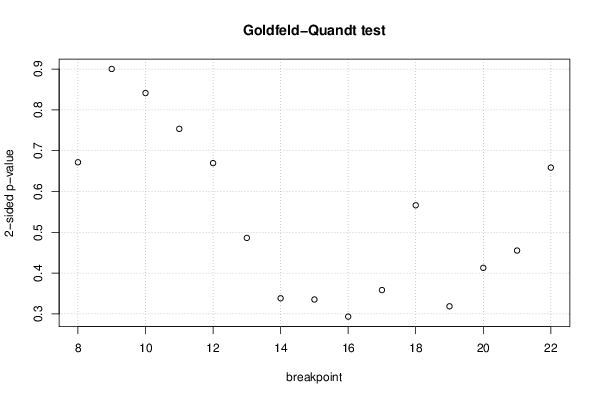
Goldfeld-Quandt test for Heteroskedasticity
p-valuesAlternative Hypothesis
breakpoint indexgreater2-sidedless
8 0.6642 0.6716 0.3358
9 0.5499 0.9002 0.4501
10 0.4206 0.8411 0.5794
11 0.3767 0.7534 0.6233
12 0.3348 0.6696 0.6652
13 0.2432 0.4863 0.7568
14 0.1693 0.3385 0.8307
15 0.1678 0.3355 0.8322
16 0.1467 0.2935 0.8533
17 0.8207 0.3587 0.1793
18 0.7169 0.5663 0.2831
19 0.8406 0.3188 0.1594
20 0.7935 0.413 0.2065
21 0.7723 0.4554 0.2277
22 0.6708 0.6585 0.3292

\begin{tabular}{lllllllll}
\hline
Goldfeld-Quandt test for Heteroskedasticity \tabularnewline
p-values & Alternative Hypothesis \tabularnewline
breakpoint index & greater & 2-sided & less \tabularnewline
8 &  0.6642 &  0.6716 &  0.3358 \tabularnewline
9 &  0.5499 &  0.9002 &  0.4501 \tabularnewline
10 &  0.4206 &  0.8411 &  0.5794 \tabularnewline
11 &  0.3767 &  0.7534 &  0.6233 \tabularnewline
12 &  0.3348 &  0.6696 &  0.6652 \tabularnewline
13 &  0.2432 &  0.4863 &  0.7568 \tabularnewline
14 &  0.1693 &  0.3385 &  0.8307 \tabularnewline
15 &  0.1678 &  0.3355 &  0.8322 \tabularnewline
16 &  0.1467 &  0.2935 &  0.8533 \tabularnewline
17 &  0.8207 &  0.3587 &  0.1793 \tabularnewline
18 &  0.7169 &  0.5663 &  0.2831 \tabularnewline
19 &  0.8406 &  0.3188 &  0.1594 \tabularnewline
20 &  0.7935 &  0.413 &  0.2065 \tabularnewline
21 &  0.7723 &  0.4554 &  0.2277 \tabularnewline
22 &  0.6708 &  0.6585 &  0.3292 \tabularnewline
\hline
\end{tabular}
%Source: https://freestatistics.org/blog/index.php?pk=284787&T=5

[TABLE]
[ROW][C]Goldfeld-Quandt test for Heteroskedasticity[/C][/ROW]
[ROW][C]p-values[/C][C]Alternative Hypothesis[/C][/ROW]
[ROW][C]breakpoint index[/C][C]greater[/C][C]2-sided[/C][C]less[/C][/ROW]
[ROW][C]8[/C][C] 0.6642[/C][C] 0.6716[/C][C] 0.3358[/C][/ROW]
[ROW][C]9[/C][C] 0.5499[/C][C] 0.9002[/C][C] 0.4501[/C][/ROW]
[ROW][C]10[/C][C] 0.4206[/C][C] 0.8411[/C][C] 0.5794[/C][/ROW]
[ROW][C]11[/C][C] 0.3767[/C][C] 0.7534[/C][C] 0.6233[/C][/ROW]
[ROW][C]12[/C][C] 0.3348[/C][C] 0.6696[/C][C] 0.6652[/C][/ROW]
[ROW][C]13[/C][C] 0.2432[/C][C] 0.4863[/C][C] 0.7568[/C][/ROW]
[ROW][C]14[/C][C] 0.1693[/C][C] 0.3385[/C][C] 0.8307[/C][/ROW]
[ROW][C]15[/C][C] 0.1678[/C][C] 0.3355[/C][C] 0.8322[/C][/ROW]
[ROW][C]16[/C][C] 0.1467[/C][C] 0.2935[/C][C] 0.8533[/C][/ROW]
[ROW][C]17[/C][C] 0.8207[/C][C] 0.3587[/C][C] 0.1793[/C][/ROW]
[ROW][C]18[/C][C] 0.7169[/C][C] 0.5663[/C][C] 0.2831[/C][/ROW]
[ROW][C]19[/C][C] 0.8406[/C][C] 0.3188[/C][C] 0.1594[/C][/ROW]
[ROW][C]20[/C][C] 0.7935[/C][C] 0.413[/C][C] 0.2065[/C][/ROW]
[ROW][C]21[/C][C] 0.7723[/C][C] 0.4554[/C][C] 0.2277[/C][/ROW]
[ROW][C]22[/C][C] 0.6708[/C][C] 0.6585[/C][C] 0.3292[/C][/ROW]
[/TABLE]
Source: https://freestatistics.org/blog/index.php?pk=284787&T=5

Globally Unique Identifier (entire table): ba.freestatistics.org/blog/index.php?pk=284787&T=5

As an alternative you can also use a QR Code:  

The GUIDs for individual cells are displayed in the table below:

Goldfeld-Quandt test for Heteroskedasticity
p-valuesAlternative Hypothesis
breakpoint indexgreater2-sidedless
8 0.6642 0.6716 0.3358
9 0.5499 0.9002 0.4501
10 0.4206 0.8411 0.5794
11 0.3767 0.7534 0.6233
12 0.3348 0.6696 0.6652
13 0.2432 0.4863 0.7568
14 0.1693 0.3385 0.8307
15 0.1678 0.3355 0.8322
16 0.1467 0.2935 0.8533
17 0.8207 0.3587 0.1793
18 0.7169 0.5663 0.2831
19 0.8406 0.3188 0.1594
20 0.7935 0.413 0.2065
21 0.7723 0.4554 0.2277
22 0.6708 0.6585 0.3292


Meta Analysis of Goldfeld-Quandt test for Heteroskedasticity
Description# significant tests% significant testsOK/NOK
1% type I error level0 0OK
5% type I error level00OK
10% type I error level00OK

\begin{tabular}{lllllllll}
\hline
Meta Analysis of Goldfeld-Quandt test for Heteroskedasticity \tabularnewline
Description & # significant tests & % significant tests & OK/NOK \tabularnewline
1% type I error level & 0 &  0 & OK \tabularnewline
5% type I error level & 0 & 0 & OK \tabularnewline
10% type I error level & 0 & 0 & OK \tabularnewline
\hline
\end{tabular}
%Source: https://freestatistics.org/blog/index.php?pk=284787&T=6

[TABLE]
[ROW][C]Meta Analysis of Goldfeld-Quandt test for Heteroskedasticity[/C][/ROW]
[ROW][C]Description[/C][C]# significant tests[/C][C]% significant tests[/C][C]OK/NOK[/C][/ROW]
[ROW][C]1% type I error level[/C][C]0[/C][C] 0[/C][C]OK[/C][/ROW]
[ROW][C]5% type I error level[/C][C]0[/C][C]0[/C][C]OK[/C][/ROW]
[ROW][C]10% type I error level[/C][C]0[/C][C]0[/C][C]OK[/C][/ROW]
[/TABLE]
Source: https://freestatistics.org/blog/index.php?pk=284787&T=6

Globally Unique Identifier (entire table): ba.freestatistics.org/blog/index.php?pk=284787&T=6

As an alternative you can also use a QR Code:  

The GUIDs for individual cells are displayed in the table below:

Meta Analysis of Goldfeld-Quandt test for Heteroskedasticity
Description# significant tests% significant testsOK/NOK
1% type I error level0 0OK
5% type I error level00OK
10% type I error level00OK


Parameters (Session):
par2 = Do not include Seasonal Dummies ; par3 = Linear Trend ; par4 = 2 ;
Parameters (R input):
par1 = ; par2 = Do not include Seasonal Dummies ; par3 = Linear Trend ; par4 = 2 ; par5 = ;
R code (references can be found in the software module):
par5 <- ''
par4 <- '2'
par3 <- 'No Linear Trend'
par2 <- 'Do not include Seasonal Dummies'
par1 <- ''
library(lattice)
library(lmtest)
n25 <- 25 #minimum number of obs. for Goldfeld-Quandt test
mywarning <- ''
par1 <- as.numeric(par1)
if(is.na(par1)) {
par1 <- 1
mywarning = 'Warning: you did not specify the column number of the endogenous series! The first column was selected by default.'
}
if (par4=='') par4 <- 0
par4 <- as.numeric(par4)
if (par5=='') par5 <- 0
par5 <- as.numeric(par5)
x <- na.omit(t(y))
k <- length(x[1,])
n <- length(x[,1])
x1 <- cbind(x[,par1], x[,1:k!=par1])
mycolnames <- c(colnames(x)[par1], colnames(x)[1:k!=par1])
colnames(x1) <- mycolnames #colnames(x)[par1]
x <- x1
if (par3 == 'First Differences'){
x2 <- array(0, dim=c(n-1,k), dimnames=list(1:(n-1), paste('(1-B)',colnames(x),sep='')))
for (i in 1:n-1) {
for (j in 1:k) {
x2[i,j] <- x[i+1,j] - x[i,j]
}
}
x <- x2
}
if(par4 > 0) {
x2 <- array(0, dim=c(n-par4,par4), dimnames=list(1:(n-par4), paste(colnames(x)[par1],'(t-',1:par4,')',sep='')))
for (i in 1:(n-par4)) {
for (j in 1:par4) {
x2[i,j] <- x[i+par4-j,par1]
}
}
x <- cbind(x[(par4+1):n,], x2)
n <- n - par4
}
if (par2 == 'Include Monthly Dummies'){
x2 <- array(0, dim=c(n,11), dimnames=list(1:n, paste('M', seq(1:11), sep ='')))
for (i in 1:11){
x2[seq(i,n,12),i] <- 1
}
x <- cbind(x, x2)
}
if (par2 == 'Include Quarterly Dummies'){
x2 <- array(0, dim=c(n,3), dimnames=list(1:n, paste('Q', seq(1:3), sep ='')))
for (i in 1:3){
x2[seq(i,n,4),i] <- 1
}
x <- cbind(x, x2)
}
k <- length(x[1+par4,])
if (par3 == 'Linear Trend'){
x <- cbind(x, c(1:n))
colnames(x)[k+1] <- 't'
}
x
k <- length(x[1+par4,])
df <- as.data.frame(x)
(mylm <- lm(df))
(mysum <- summary(mylm))
if (n > n25) {
kp3 <- k + 3
nmkm3 <- n - k - 3
gqarr <- array(NA, dim=c(nmkm3-kp3+1,3))
numgqtests <- 0
numsignificant1 <- 0
numsignificant5 <- 0
numsignificant10 <- 0
for (mypoint in kp3:nmkm3) {
j <- 0
numgqtests <- numgqtests + 1
for (myalt in c('greater', 'two.sided', 'less')) {
j <- j + 1
gqarr[mypoint-kp3+1,j] <- gqtest(mylm, point=mypoint, alternative=myalt)$p.value
}
if (gqarr[mypoint-kp3+1,2] < 0.01) numsignificant1 <- numsignificant1 + 1
if (gqarr[mypoint-kp3+1,2] < 0.05) numsignificant5 <- numsignificant5 + 1
if (gqarr[mypoint-kp3+1,2] < 0.10) numsignificant10 <- numsignificant10 + 1
}
gqarr
}
bitmap(file='test0.png')
plot(x[,1], type='l', main='Actuals and Interpolation', ylab='value of Actuals and Interpolation (dots)', xlab='time or index')
points(x[,1]-mysum$resid)
grid()
dev.off()
bitmap(file='test1.png')
plot(mysum$resid, type='b', pch=19, main='Residuals', ylab='value of Residuals', xlab='time or index')
grid()
dev.off()
bitmap(file='test2.png')
hist(mysum$resid, main='Residual Histogram', xlab='values of Residuals')
grid()
dev.off()
bitmap(file='test3.png')
densityplot(~mysum$resid,col='black',main='Residual Density Plot', xlab='values of Residuals')
dev.off()
bitmap(file='test4.png')
qqnorm(mysum$resid, main='Residual Normal Q-Q Plot')
qqline(mysum$resid)
grid()
dev.off()
(myerror <- as.ts(mysum$resid))
bitmap(file='test5.png')
dum <- cbind(lag(myerror,k=1),myerror)
dum
dum1 <- dum[2:length(myerror),]
dum1
z <- as.data.frame(dum1)
z
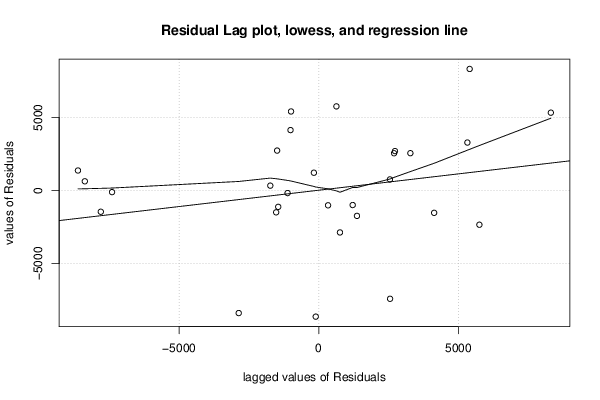
plot(z,main=paste('Residual Lag plot, lowess, and regression line'), ylab='values of Residuals', xlab='lagged values of Residuals')
lines(lowess(z))
abline(lm(z))
grid()
dev.off()
bitmap(file='test6.png')
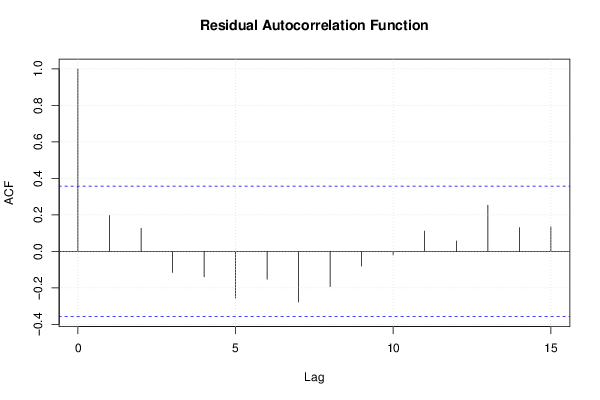
acf(mysum$resid, lag.max=length(mysum$resid)/2, main='Residual Autocorrelation Function')
grid()
dev.off()
bitmap(file='test7.png')
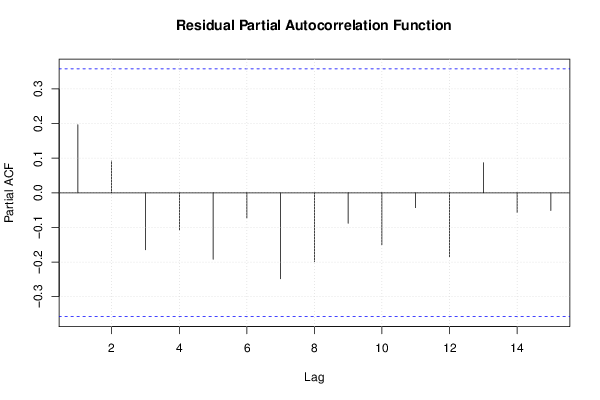
pacf(mysum$resid, lag.max=length(mysum$resid)/2, main='Residual Partial Autocorrelation Function')
grid()
dev.off()
bitmap(file='test8.png')
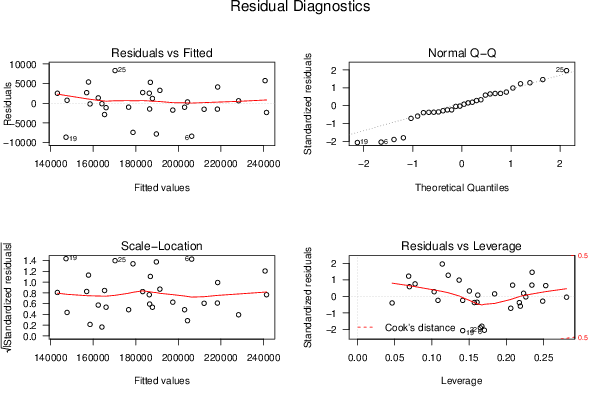
opar <- par(mfrow = c(2,2), oma = c(0, 0, 1.1, 0))
plot(mylm, las = 1, sub='Residual Diagnostics')
par(opar)
dev.off()
if (n > n25) {
bitmap(file='test9.png')
plot(kp3:nmkm3,gqarr[,2], main='Goldfeld-Quandt test',ylab='2-sided p-value',xlab='breakpoint')
grid()
dev.off()
}
load(file='createtable')
a<-table.start()
a<-table.row.start(a)
a<-table.element(a, 'Multiple Linear Regression - Estimated Regression Equation', 1, TRUE)
a<-table.row.end(a)
myeq <- colnames(x)[1]
myeq <- paste(myeq, '[t] = ', sep='')
for (i in 1:k){
if (mysum$coefficients[i,1] > 0) myeq <- paste(myeq, '+', '')
myeq <- paste(myeq, signif(mysum$coefficients[i,1],6), sep=' ')
if (rownames(mysum$coefficients)[i] != '(Intercept)') {
myeq <- paste(myeq, rownames(mysum$coefficients)[i], sep='')
if (rownames(mysum$coefficients)[i] != 't') myeq <- paste(myeq, '[t]', sep='')
}
}
myeq <- paste(myeq, ' + e[t]')
a<-table.row.start(a)
a<-table.element(a, myeq)
a<-table.row.end(a)
a<-table.row.start(a)
a<-table.element(a, mywarning)
a<-table.row.end(a)
a<-table.end(a)
table.save(a,file='mytable1.tab')
a<-table.start()
a<-table.row.start(a)
a<-table.element(a,hyperlink('ols1.htm','Multiple Linear Regression - Ordinary Least Squares',''), 6, TRUE)
a<-table.row.end(a)
a<-table.row.start(a)
a<-table.element(a,'Variable',header=TRUE)
a<-table.element(a,'Parameter',header=TRUE)
a<-table.element(a,'S.D.',header=TRUE)
a<-table.element(a,'T-STAT
H0: parameter = 0',header=TRUE)
a<-table.element(a,'2-tail p-value',header=TRUE)
a<-table.element(a,'1-tail p-value',header=TRUE)
a<-table.row.end(a)
for (i in 1:k){
a<-table.row.start(a)
a<-table.element(a,rownames(mysum$coefficients)[i],header=TRUE)
a<-table.element(a,formatC(signif(mysum$coefficients[i,1],5),format='g',flag='+'))
a<-table.element(a,formatC(signif(mysum$coefficients[i,2],5),format='g',flag=' '))
a<-table.element(a,formatC(signif(mysum$coefficients[i,3],4),format='e',flag='+'))
a<-table.element(a,formatC(signif(mysum$coefficients[i,4],4),format='g',flag=' '))
a<-table.element(a,formatC(signif(mysum$coefficients[i,4]/2,4),format='g',flag=' '))
a<-table.row.end(a)
}
a<-table.end(a)
table.save(a,file='mytable2.tab')
a<-table.start()
a<-table.row.start(a)
a<-table.element(a, 'Multiple Linear Regression - Regression Statistics', 2, TRUE)
a<-table.row.end(a)
a<-table.row.start(a)
a<-table.element(a, 'Multiple R',1,TRUE)
a<-table.element(a,formatC(signif(sqrt(mysum$r.squared),6),format='g',flag=' '))
a<-table.row.end(a)
a<-table.row.start(a)
a<-table.element(a, 'R-squared',1,TRUE)
a<-table.element(a,formatC(signif(mysum$r.squared,6),format='g',flag=' '))
a<-table.row.end(a)
a<-table.row.start(a)
a<-table.element(a, 'Adjusted R-squared',1,TRUE)
a<-table.element(a,formatC(signif(mysum$adj.r.squared,6),format='g',flag=' '))
a<-table.row.end(a)
a<-table.row.start(a)
a<-table.element(a, 'F-TEST (value)',1,TRUE)
a<-table.element(a,formatC(signif(mysum$fstatistic[1],6),format='g',flag=' '))
a<-table.row.end(a)
a<-table.row.start(a)
a<-table.element(a, 'F-TEST (DF numerator)',1,TRUE)
a<-table.element(a, signif(mysum$fstatistic[2],6))
a<-table.row.end(a)
a<-table.row.start(a)
a<-table.element(a, 'F-TEST (DF denominator)',1,TRUE)
a<-table.element(a, signif(mysum$fstatistic[3],6))
a<-table.row.end(a)
a<-table.row.start(a)
a<-table.element(a, 'p-value',1,TRUE)
a<-table.element(a,formatC(signif(1-pf(mysum$fstatistic[1],mysum$fstatistic[2],mysum$fstatistic[3]),6),format='g',flag=' '))
a<-table.row.end(a)
a<-table.row.start(a)
a<-table.element(a, 'Multiple Linear Regression - Residual Statistics', 2, TRUE)
a<-table.row.end(a)
a<-table.row.start(a)
a<-table.element(a, 'Residual Standard Deviation',1,TRUE)
a<-table.element(a,formatC(signif(mysum$sigma,6),format='g',flag=' '))
a<-table.row.end(a)
a<-table.row.start(a)
a<-table.element(a, 'Sum Squared Residuals',1,TRUE)
a<-table.element(a,formatC(signif(sum(myerror*myerror),6),format='g',flag=' '))
a<-table.row.end(a)
a<-table.end(a)
table.save(a,file='mytable3.tab')
if(n < 200) {
a<-table.start()
a<-table.row.start(a)
a<-table.element(a, 'Multiple Linear Regression - Actuals, Interpolation, and Residuals', 4, TRUE)
a<-table.row.end(a)
a<-table.row.start(a)
a<-table.element(a, 'Time or Index', 1, TRUE)
a<-table.element(a, 'Actuals', 1, TRUE)
a<-table.element(a, 'Interpolation
Forecast', 1, TRUE)
a<-table.element(a, 'Residuals
Prediction Error', 1, TRUE)
a<-table.row.end(a)
for (i in 1:n) {
a<-table.row.start(a)
a<-table.element(a,i, 1, TRUE)
a<-table.element(a,formatC(signif(x[i],6),format='g',flag=' '))
a<-table.element(a,formatC(signif(x[i]-mysum$resid[i],6),format='g',flag=' '))
a<-table.element(a,formatC(signif(mysum$resid[i],6),format='g',flag=' '))
a<-table.row.end(a)
}
a<-table.end(a)
table.save(a,file='mytable4.tab')
if (n > n25) {
a<-table.start()
a<-table.row.start(a)
a<-table.element(a,'Goldfeld-Quandt test for Heteroskedasticity',4,TRUE)
a<-table.row.end(a)
a<-table.row.start(a)
a<-table.element(a,'p-values',header=TRUE)
a<-table.element(a,'Alternative Hypothesis',3,header=TRUE)
a<-table.row.end(a)
a<-table.row.start(a)
a<-table.element(a,'breakpoint index',header=TRUE)
a<-table.element(a,'greater',header=TRUE)
a<-table.element(a,'2-sided',header=TRUE)
a<-table.element(a,'less',header=TRUE)
a<-table.row.end(a)
for (mypoint in kp3:nmkm3) {
a<-table.row.start(a)
a<-table.element(a,mypoint,header=TRUE)
a<-table.element(a,formatC(signif(gqarr[mypoint-kp3+1,1],6),format='g',flag=' '))
a<-table.element(a,formatC(signif(gqarr[mypoint-kp3+1,2],6),format='g',flag=' '))
a<-table.element(a,formatC(signif(gqarr[mypoint-kp3+1,3],6),format='g',flag=' '))
a<-table.row.end(a)
}
a<-table.end(a)
table.save(a,file='mytable5.tab')
a<-table.start()
a<-table.row.start(a)
a<-table.element(a,'Meta Analysis of Goldfeld-Quandt test for Heteroskedasticity',4,TRUE)
a<-table.row.end(a)
a<-table.row.start(a)
a<-table.element(a,'Description',header=TRUE)
a<-table.element(a,'# significant tests',header=TRUE)
a<-table.element(a,'% significant tests',header=TRUE)
a<-table.element(a,'OK/NOK',header=TRUE)
a<-table.row.end(a)
a<-table.row.start(a)
a<-table.element(a,'1% type I error level',header=TRUE)
a<-table.element(a,signif(numsignificant1,6))
a<-table.element(a,formatC(signif(numsignificant1/numgqtests,6),format='g',flag=' '))
if (numsignificant1/numgqtests < 0.01) dum <- 'OK' else dum <- 'NOK'
a<-table.element(a,dum)
a<-table.row.end(a)
a<-table.row.start(a)
a<-table.element(a,'5% type I error level',header=TRUE)
a<-table.element(a,signif(numsignificant5,6))
a<-table.element(a,signif(numsignificant5/numgqtests,6))
if (numsignificant5/numgqtests < 0.05) dum <- 'OK' else dum <- 'NOK'
a<-table.element(a,dum)
a<-table.row.end(a)
a<-table.row.start(a)
a<-table.element(a,'10% type I error level',header=TRUE)
a<-table.element(a,signif(numsignificant10,6))
a<-table.element(a,signif(numsignificant10/numgqtests,6))
if (numsignificant10/numgqtests < 0.1) dum <- 'OK' else dum <- 'NOK'
a<-table.element(a,dum)
a<-table.row.end(a)
a<-table.end(a)
table.save(a,file='mytable6.tab')
}
}