Free Statistics
of Irreproducible Research!
Description of Statistical Computation | |||||||||||||||||||||||||||||||||||||||
|---|---|---|---|---|---|---|---|---|---|---|---|---|---|---|---|---|---|---|---|---|---|---|---|---|---|---|---|---|---|---|---|---|---|---|---|---|---|---|---|
| Author's title | |||||||||||||||||||||||||||||||||||||||
| Author | *The author of this computation has been verified* | ||||||||||||||||||||||||||||||||||||||
| R Software Module | rwasp_fitdistrnorm.wasp | ||||||||||||||||||||||||||||||||||||||
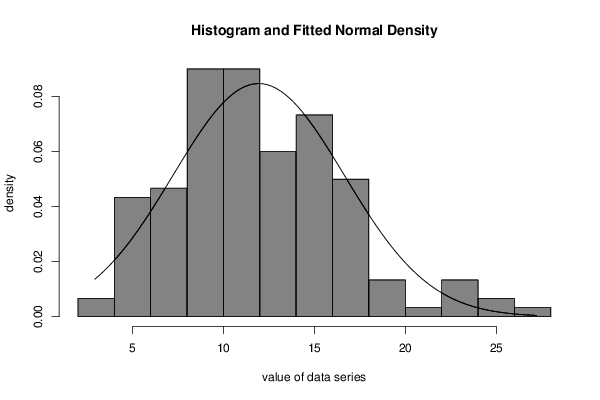
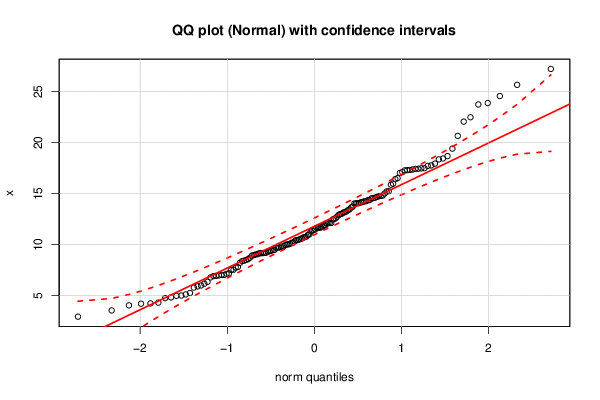
| Title produced by software | ML Fitting and QQ Plot- Normal Distribution | ||||||||||||||||||||||||||||||||||||||
| Date of computation | Tue, 15 Dec 2015 19:19:09 +0000 | ||||||||||||||||||||||||||||||||||||||
| Cite this page as follows | Statistical Computations at FreeStatistics.org, Office for Research Development and Education, URL https://freestatistics.org/blog/index.php?v=date/2015/Dec/15/t1450207282aauuxiqt06m02ev.htm/, Retrieved Sat, 18 May 2024 07:18:09 +0000 | ||||||||||||||||||||||||||||||||||||||
| Statistical Computations at FreeStatistics.org, Office for Research Development and Education, URL https://freestatistics.org/blog/index.php?pk=286570, Retrieved Sat, 18 May 2024 07:18:09 +0000 | |||||||||||||||||||||||||||||||||||||||
| QR Codes: | |||||||||||||||||||||||||||||||||||||||
|
| |||||||||||||||||||||||||||||||||||||||
| Original text written by user: | |||||||||||||||||||||||||||||||||||||||
| IsPrivate? | No (this computation is public) | ||||||||||||||||||||||||||||||||||||||
| User-defined keywords | |||||||||||||||||||||||||||||||||||||||
| Estimated Impact | 72 | ||||||||||||||||||||||||||||||||||||||
Tree of Dependent Computations | |||||||||||||||||||||||||||||||||||||||
| Family? (F = Feedback message, R = changed R code, M = changed R Module, P = changed Parameters, D = changed Data) | |||||||||||||||||||||||||||||||||||||||
| - [ML Fitting and QQ Plot- Normal Distribution] [Ch3-T4] [2015-12-15 19:19:09] [c7d580dabf700704a3d6c2773d62a8e4] [Current] | |||||||||||||||||||||||||||||||||||||||
| Feedback Forum | |||||||||||||||||||||||||||||||||||||||
Post a new message | |||||||||||||||||||||||||||||||||||||||
Dataset | |||||||||||||||||||||||||||||||||||||||
| Dataseries X: | |||||||||||||||||||||||||||||||||||||||
17.47357846 3.542013848 13.45200403 11.89556299 11.41985103 15.00128883 9.055338248 14.76348586 11.87365322 14.01765637 12.90280327 10.9431099 13.17172565 18.67094045 10.43988365 17.70813805 17.4137022 10.17039352 23.72869184 15.20355188 15.22740011 18.35121494 9.337312074 2.931111075 17.93228299 8.912030102 27.21330355 9.140589175 9.96135795 14.13809973 4.302819704 18.43603086 10.31429397 8.378570775 11.75722522 13.63703804 4.038926622 5.903298759 14.05002097 11.2820582 11.65078121 9.471439077 7.133554507 14.35301165 4.818006327 8.963064427 4.20243988 12.11010618 7.79141844 9.195074744 13.37535113 8.203911552 7.745893777 6.348359282 7.021070272 15.96739028 17.35234548 4.974721387 12.74476002 8.488760868 10.02151607 11.65561387 8.713343989 13.25185334 9.018881964 17.42980237 9.795152179 6.969598908 11.63296777 15.8609547 25.6580769 24.55877929 12.98303899 20.65270673 10.42733654 5.779237223 12.4561971 5.990307681 13.71544172 14.55147355 12.51918699 9.692945328 5.248774318 9.784195946 7.513642961 10.20404882 17.09844376 12.11793898 14.52457788 16.41278008 10.49472512 9.688453155 22.47842563 14.79503052 6.931922254 10.78479701 9.185513443 14.729097 17.29042211 11.68269014 10.6060507 12.11132276 6.776139918 11.47128401 9.849883901 8.417209438 4.749964979 14.34869566 9.725708853 9.154985605 10.69891574 14.16743838 23.87156387 9.403166459 13.13920882 17.31022224 17.01486273 10.06314706 10.01780808 8.575416657 17.4842011 7.531590354 4.232554193 16.51106039 6.163239424 14.24202417 9.458077678 17.75681531 10.99148226 7.021952507 10.54289961 5.108512867 7.176913653 14.25320839 9.323693611 10.72721673 5.002502082 19.40081919 22.05198498 13.01805815 12.08769018 6.90555351 11.37856795 17.26663629 14.0311081 14.67195016 14.06354103 9.154089402 14.58796577 12.58551374 | |||||||||||||||||||||||||||||||||||||||
Tables (Output of Computation) | |||||||||||||||||||||||||||||||||||||||
| |||||||||||||||||||||||||||||||||||||||
Figures (Output of Computation) | |||||||||||||||||||||||||||||||||||||||
Input Parameters & R Code | |||||||||||||||||||||||||||||||||||||||
| Parameters (Session): | |||||||||||||||||||||||||||||||||||||||
| par1 = 8 ; par2 = 0 ; | |||||||||||||||||||||||||||||||||||||||
| Parameters (R input): | |||||||||||||||||||||||||||||||||||||||
| par1 = 8 ; par2 = 0 ; | |||||||||||||||||||||||||||||||||||||||
| R code (references can be found in the software module): | |||||||||||||||||||||||||||||||||||||||
par2 <- '0' | |||||||||||||||||||||||||||||||||||||||