Free Statistics

of Irreproducible Research!

Author's title

Author*Unverified author*
R Software Modulerwasp_univariatedataseries.wasp
Title produced by softwareUnivariate Data Series
Date of computationThu, 05 Feb 2015 20:57:49 +0000
Cite this page as followsStatistical Computations at FreeStatistics.org, Office for Research Development and Education, URL https://freestatistics.org/blog/index.php?v=date/2015/Feb/05/t1423169895yqidgd4794fp9vq.htm/, Retrieved Sat, 18 May 2024 10:07:13 +0000
Statistical Computations at FreeStatistics.org, Office for Research Development and Education, URL https://freestatistics.org/blog/index.php?pk=276797, Retrieved Sat, 18 May 2024 10:07:13 +0000
QR Codes:

Original text written by user:
IsPrivate?No (this computation is public)
User-defined keywords
Estimated Impact63
Family? (F = Feedback message, R = changed R code, M = changed R Module, P = changed Parameters, D = changed Data)
-       [Univariate Data Series] [] [2015-02-05 20:57:49] [f6ba6fe2e657f2a4c34c9d874eedca96] [Current]
Feedback Forum

Post a new message
Dataseries X:
80
80
80
80
80
80
80
80
80
80
80
80
80
80
85
85
85
85
85
85
85
85
85
85
85
85
85
85
85
85
85
85
85
85
85
85
90
90
90
90
90
90
90
90
90
90
90
90
90
90
90
90
90
90
90
90
90
90
90
90
90
90
90
90
90
90
90
90
90
90
90
90
90
90
90
90
90
90
90
90
90
90
90
90
90
90
90
90
90
90
90
90
90
90
90
90
90
90
90
90
90
90
100
100
100
100
100
100
100
100
100
100
100
100
100
100
100
110
110
110
110
110
110
110
110
110
110
110
110
110
120
120
120
120
120
120
120
120
120
120
120
120
120
120
120
120
120
120
120
120
120
200
210


Summary of computational transaction
Raw Inputview raw input (R code)
Raw Outputview raw output of R engine
Computing time1 seconds
R Server'Herman Ole Andreas Wold' @ wold.wessa.net

\begin{tabular}{lllllllll}
\hline
Summary of computational transaction \tabularnewline
Raw Input & view raw input (R code)  \tabularnewline
Raw Output & view raw output of R engine  \tabularnewline
Computing time & 1 seconds \tabularnewline
R Server & 'Herman Ole Andreas Wold' @ wold.wessa.net \tabularnewline
\hline
\end{tabular}
%Source: https://freestatistics.org/blog/index.php?pk=276797&T=0

[TABLE]
[ROW][C]Summary of computational transaction[/C][/ROW]
[ROW][C]Raw Input[/C][C]view raw input (R code) [/C][/ROW]
[ROW][C]Raw Output[/C][C]view raw output of R engine [/C][/ROW]
[ROW][C]Computing time[/C][C]1 seconds[/C][/ROW]
[ROW][C]R Server[/C][C]'Herman Ole Andreas Wold' @ wold.wessa.net[/C][/ROW]
[/TABLE]
Source: https://freestatistics.org/blog/index.php?pk=276797&T=0

Globally Unique Identifier (entire table): ba.freestatistics.org/blog/index.php?pk=276797&T=0

As an alternative you can also use a QR Code:  

The GUIDs for individual cells are displayed in the table below:

Summary of computational transaction
Raw Inputview raw input (R code)
Raw Outputview raw output of R engine
Computing time1 seconds
R Server'Herman Ole Andreas Wold' @ wold.wessa.net


Univariate Dataseries
Name of dataseriesGemiddelde wekelijkse uitgaven in een supermarkt. Het bevat
Source
DescriptionDeze cijferreeks geeft weer hoeveel er wekelijks wordt uitgegeven in supermarkten. In de grafiek zijn 153 cijfers weergegeven waarbij de horizontale as het aantal antwoorden omvat en de verticale as het gemiddeld bedrag.
Number of observations153

\begin{tabular}{lllllllll}
\hline
Univariate Dataseries \tabularnewline
Name of dataseries & Gemiddelde wekelijkse uitgaven in een supermarkt. Het bevat  \tabularnewline
Source &  \tabularnewline
Description & Deze cijferreeks geeft weer hoeveel er wekelijks wordt uitgegeven in supermarkten. In de grafiek zijn 153 cijfers weergegeven waarbij de horizontale as het aantal antwoorden omvat en de verticale as het gemiddeld bedrag. \tabularnewline
Number of observations & 153 \tabularnewline
\hline
\end{tabular}
%Source: https://freestatistics.org/blog/index.php?pk=276797&T=1

[TABLE]
[ROW][C]Univariate Dataseries[/C][/ROW]
[ROW][C]Name of dataseries[/C][C]Gemiddelde wekelijkse uitgaven in een supermarkt. Het bevat [/C][/ROW]
[ROW][C]Source[/C][C][/C][/ROW]
[ROW][C]Description[/C][C]Deze cijferreeks geeft weer hoeveel er wekelijks wordt uitgegeven in supermarkten. In de grafiek zijn 153 cijfers weergegeven waarbij de horizontale as het aantal antwoorden omvat en de verticale as het gemiddeld bedrag.[/C][/ROW]
[ROW][C]Number of observations[/C][C]153[/C][/ROW]
[/TABLE]
Source: https://freestatistics.org/blog/index.php?pk=276797&T=1

Globally Unique Identifier (entire table): ba.freestatistics.org/blog/index.php?pk=276797&T=1

As an alternative you can also use a QR Code:  

The GUIDs for individual cells are displayed in the table below:

Univariate Dataseries
Name of dataseriesGemiddelde wekelijkse uitgaven in een supermarkt. Het bevat
Source
DescriptionDeze cijferreeks geeft weer hoeveel er wekelijks wordt uitgegeven in supermarkten. In de grafiek zijn 153 cijfers weergegeven waarbij de horizontale as het aantal antwoorden omvat en de verticale as het gemiddeld bedrag.
Number of observations153


Parameters (Session):
par1 = Gemiddelde wekelijkse uitgaven in een supermarkt. Het bevat ; par3 = Deze cijferreeks geeft weer hoeveel er wekelijks wordt uitgegeven in supermarkten. In de grafiek zijn 153 cijfers weergegeven waarbij de horizontale as het aantal antwoorden omvat en de verticale as het gemiddeld bedrag. ; par4 = 12 ;
Parameters (R input):
par1 = Gemiddelde wekelijkse uitgaven in een supermarkt. Het bevat ; par2 = ; par3 = Deze cijferreeks geeft weer hoeveel er wekelijks wordt uitgegeven in supermarkten. In de grafiek zijn 153 cijfers weergegeven waarbij de horizontale as het aantal antwoorden omvat en de verticale as het gemiddeld bedrag. ; par4 = 12 ;
R code (references can be found in the software module):
par4 <- '12'
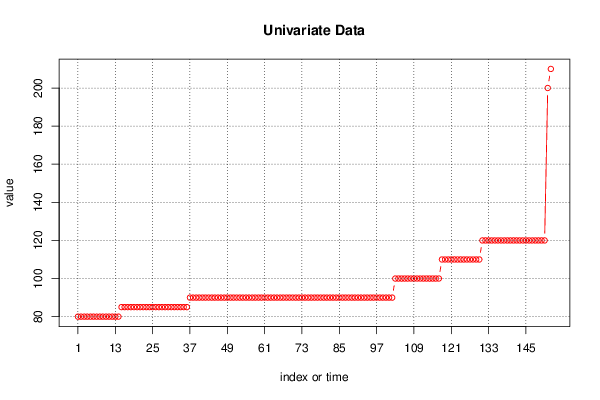
par3 <- 'Deze cijferreeks geeft weer hoeveel er wekelijks wordt uitgegeven in supermarkten. In de grafiek zijn 153 cijfers weergegeven waarbij de horizontale as het aantal antwoorden omvat en de verticale as het gemiddeld bedrag'
par2 <- ''
par1 <- 'Gemiddelde wekelijkse uitgaven in een supermarkt. Het bevat '
if (par4 != 'No season') {
par4 <- as.numeric(par4)
if (par4 < 4) par4 <- 12
}
summary(x)
n <- length(x)
bitmap(file='test1.png')
if (par4=='No season') {
plot(x,col=2,type='b',main=main,xlab=xlab,ylab=ylab,xaxt='n')
axis(1,at=seq(1,n,10))
}
if (par4!='No season') {
plot(x,col=2,type='b',main=main,xlab=xlab,ylab=ylab,xaxt='n')
axis(1,at=seq(1,n,par4))
grid(nx=0,ny=NULL,col='black')
abline(v=seq(1,n,par4),col='black',lty='dotted')
}
dev.off()
load(file='createtable')
a<-table.start()
a<-table.row.start(a)
a<-table.element(a,'Univariate Dataseries',2,TRUE)
a<-table.row.end(a)
a<-table.row.start(a)
a<-table.element(a,'Name of dataseries',header=TRUE)
a<-table.element(a,par1)
a<-table.row.end(a)
a<-table.row.start(a)
a<-table.element(a,'Source',header=TRUE)
a<-table.element(a,par2)
a<-table.row.end(a)
a<-table.row.start(a)
a<-table.element(a,'Description',header=TRUE)
a<-table.element(a,par3)
a<-table.row.end(a)
a<-table.row.start(a)
a<-table.element(a,'Number of observations',header=TRUE)
a<-table.element(a,length(x))
a<-table.row.end(a)
a<-table.end(a)
table.save(a,file='mytable.tab')