Free Statistics
of Irreproducible Research!
Description of Statistical Computation | |||||||||||||||||||||||||||||||||||||||||
|---|---|---|---|---|---|---|---|---|---|---|---|---|---|---|---|---|---|---|---|---|---|---|---|---|---|---|---|---|---|---|---|---|---|---|---|---|---|---|---|---|---|
| Author's title | |||||||||||||||||||||||||||||||||||||||||
| Author | *Unverified author* | ||||||||||||||||||||||||||||||||||||||||
| R Software Module | rwasp_univariatedataseries.wasp | ||||||||||||||||||||||||||||||||||||||||
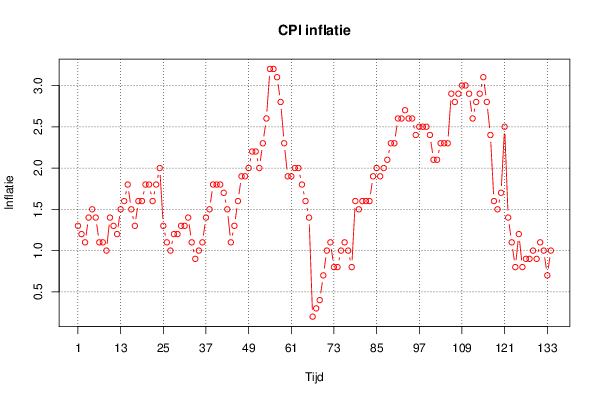
| Title produced by software | Univariate Data Series | ||||||||||||||||||||||||||||||||||||||||
| Date of computation | Tue, 27 Jan 2015 14:48:29 +0000 | ||||||||||||||||||||||||||||||||||||||||
| Cite this page as follows | Statistical Computations at FreeStatistics.org, Office for Research Development and Education, URL https://freestatistics.org/blog/index.php?v=date/2015/Jan/27/t1422370326ehabl5dipcjrgal.htm/, Retrieved Thu, 16 May 2024 08:11:09 +0000 | ||||||||||||||||||||||||||||||||||||||||
| Statistical Computations at FreeStatistics.org, Office for Research Development and Education, URL https://freestatistics.org/blog/index.php?pk=276182, Retrieved Thu, 16 May 2024 08:11:09 +0000 | |||||||||||||||||||||||||||||||||||||||||
| QR Codes: | |||||||||||||||||||||||||||||||||||||||||
|
| |||||||||||||||||||||||||||||||||||||||||
| Original text written by user: | |||||||||||||||||||||||||||||||||||||||||
| IsPrivate? | No (this computation is public) | ||||||||||||||||||||||||||||||||||||||||
| User-defined keywords | Inflatie | ||||||||||||||||||||||||||||||||||||||||
| Estimated Impact | 140 | ||||||||||||||||||||||||||||||||||||||||
Tree of Dependent Computations | |||||||||||||||||||||||||||||||||||||||||
| Family? (F = Feedback message, R = changed R code, M = changed R Module, P = changed Parameters, D = changed Data) | |||||||||||||||||||||||||||||||||||||||||
| - [Univariate Data Series] [CPI Inflatie] [2015-01-27 14:48:29] [944b95db226364abcbc791a2a23b852c] [Current] | |||||||||||||||||||||||||||||||||||||||||
| Feedback Forum | |||||||||||||||||||||||||||||||||||||||||
Post a new message | |||||||||||||||||||||||||||||||||||||||||
Dataset | |||||||||||||||||||||||||||||||||||||||||
| Dataseries X: | |||||||||||||||||||||||||||||||||||||||||
1,3 1,2 1,1 1,4 1,5 1,4 1,1 1,1 1 1,4 1,3 1,2 1,5 1,6 1,8 1,5 1,3 1,6 1,6 1,8 1,8 1,6 1,8 2 1,3 1,1 1 1,2 1,2 1,3 1,3 1,4 1,1 0,9 1 1,1 1,4 1,5 1,8 1,8 1,8 1,7 1,5 1,1 1,3 1,6 1,9 1,9 2 2,2 2,2 2 2,3 2,6 3,2 3,2 3,1 2,8 2,3 1,9 1,9 2 2 1,8 1,6 1,4 0,2 0,3 0,4 0,7 1 1,1 0,8 0,8 1 1,1 1 0,8 1,6 1,5 1,6 1,6 1,6 1,9 2 1,9 2 2,1 2,3 2,3 2,6 2,6 2,7 2,6 2,6 2,4 2,5 2,5 2,5 2,4 2,1 2,1 2,3 2,3 2,3 2,9 2,8 2,9 3 3 2,9 2,6 2,8 2,9 3,1 2,8 2,4 1,6 1,5 1,7 2,5 1,4 1,1 0,8 1,2 0,8 0,9 0,9 1 0,9 1,1 1 0,7 1 | |||||||||||||||||||||||||||||||||||||||||
Tables (Output of Computation) | |||||||||||||||||||||||||||||||||||||||||
| |||||||||||||||||||||||||||||||||||||||||
Figures (Output of Computation) | |||||||||||||||||||||||||||||||||||||||||
Input Parameters & R Code | |||||||||||||||||||||||||||||||||||||||||
| Parameters (Session): | |||||||||||||||||||||||||||||||||||||||||
| par1 = CPI Inflatie Jaar Op Jaar ; par2 = www.cbs.nl ; par3 = CPI Inflatie per maand op jaarbasis ; par4 = 12 ; | |||||||||||||||||||||||||||||||||||||||||
| Parameters (R input): | |||||||||||||||||||||||||||||||||||||||||
| par1 = CPI Inflatie Jaar Op Jaar ; par2 = www.cbs.nl ; par3 = CPI Inflatie per maand op jaarbasis ; par4 = 12 ; | |||||||||||||||||||||||||||||||||||||||||
| R code (references can be found in the software module): | |||||||||||||||||||||||||||||||||||||||||
if (par4 != 'No season') { | |||||||||||||||||||||||||||||||||||||||||