Free Statistics

of Irreproducible Research!

Author's title

Author*Unverified author*
R Software Modulerwasp_autocorrelation.wasp
Title produced by software(Partial) Autocorrelation Function
Date of computationMon, 02 Mar 2015 10:11:20 +0000
Cite this page as followsStatistical Computations at FreeStatistics.org, Office for Research Development and Education, URL https://freestatistics.org/blog/index.php?v=date/2015/Mar/02/t14252911415hbd3myeld1r6ce.htm/, Retrieved Fri, 17 May 2024 12:38:58 +0000
Statistical Computations at FreeStatistics.org, Office for Research Development and Education, URL https://freestatistics.org/blog/index.php?pk=277777, Retrieved Fri, 17 May 2024 12:38:58 +0000
QR Codes:

Original text written by user:
IsPrivate?No (this computation is public)
User-defined keywords
Estimated Impact101
Family? (F = Feedback message, R = changed R code, M = changed R Module, P = changed Parameters, D = changed Data)
-       [(Partial) Autocorrelation Function] [] [2015-03-02 10:11:20] [9d11e60232d68c92754922ab1f7d0739] [Current]
Feedback Forum

Post a new message
Dataseries X:
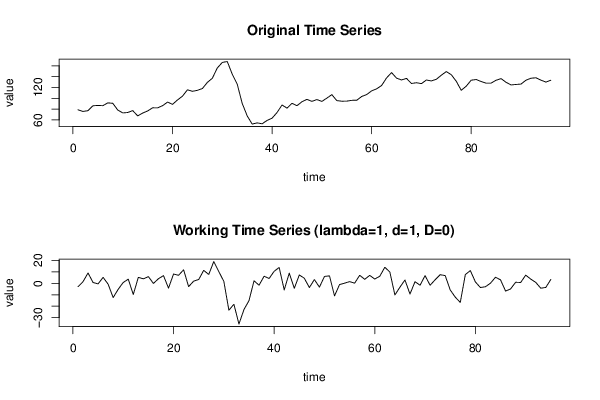
78,7
75,7
77,1
86,1
86,8
86,3
91,5
90,7
78,2
73
73,7
77,3
67,5
72,7
76,6
82,4
82,3
86,3
93
88,8
96,9
103,9
115,7
112,8
114,7
118
129,3
137
156
166,2
167,8
144,3
126
90,4
67,5
52,4
54,6
52,9
59,1
63,3
73,8
87,6
81,8
90,7
86,3
93,6
98
94,3
97,6
94,2
100,2
106,7
95,7
94,6
94,7
96,2
96,3
103,3
106,8
113,7
117,4
123,6
137,6
147,4
137,2
133,8
136,7
127,3
128,7
127
133,7
132
135,1
142,6
149,3
143,5
131,4
114,7
122,3
133,4
134,6
130,9
127,9
128
133,3
136,3
129,5
124,6
125,5
126,2
133,3
137
137,8
133,5
129,9
133,3


Summary of computational transaction
Raw Inputview raw input (R code)
Raw Outputview raw output of R engine
Computing time2 seconds
R Server'Gwilym Jenkins' @ jenkins.wessa.net

\begin{tabular}{lllllllll}
\hline
Summary of computational transaction \tabularnewline
Raw Input & view raw input (R code)  \tabularnewline
Raw Output & view raw output of R engine  \tabularnewline
Computing time & 2 seconds \tabularnewline
R Server & 'Gwilym Jenkins' @ jenkins.wessa.net \tabularnewline
\hline
\end{tabular}
%Source: https://freestatistics.org/blog/index.php?pk=277777&T=0

[TABLE]
[ROW][C]Summary of computational transaction[/C][/ROW]
[ROW][C]Raw Input[/C][C]view raw input (R code) [/C][/ROW]
[ROW][C]Raw Output[/C][C]view raw output of R engine [/C][/ROW]
[ROW][C]Computing time[/C][C]2 seconds[/C][/ROW]
[ROW][C]R Server[/C][C]'Gwilym Jenkins' @ jenkins.wessa.net[/C][/ROW]
[/TABLE]
Source: https://freestatistics.org/blog/index.php?pk=277777&T=0

Globally Unique Identifier (entire table): ba.freestatistics.org/blog/index.php?pk=277777&T=0

As an alternative you can also use a QR Code:  

The GUIDs for individual cells are displayed in the table below:

Summary of computational transaction
Raw Inputview raw input (R code)
Raw Outputview raw output of R engine
Computing time2 seconds
R Server'Gwilym Jenkins' @ jenkins.wessa.net


Autocorrelation Function
Time lag kACF(k)T-STATP-value
10.4639694.52229e-06
20.2478332.41560.008811
3-0.013702-0.13360.447019
4-0.064049-0.62430.266971
5-0.194721-1.89790.030372
6-0.243756-2.37580.009758
7-0.21378-2.08370.019938
8-0.161765-1.57670.059096
9-0.158379-1.54370.062994
10-0.051021-0.49730.310067
110.0357140.34810.364267
120.0078010.0760.469775
13-0.095312-0.9290.177626
14-0.136096-1.32650.093927
15-0.0389-0.37920.352711
16-0.029158-0.28420.388439
170.0133740.13040.44828
18-0.019377-0.18890.4253
190.0399710.38960.348855
20-0.035573-0.34670.364782
210.0744570.72570.234899
220.1123131.09470.13821
230.1300911.2680.103954
24-0.030604-0.29830.383066
250.0617660.6020.274296
26-0.109695-1.06920.143851
27-0.11041-1.07610.142294
28-0.126346-1.23150.110594
29-0.093686-0.91310.181741
30-0.053497-0.52140.301642
31-0.074194-0.72320.235681
320.0183720.17910.429132
330.1610761.570.059873
340.1399431.3640.087896
350.0492560.48010.316133
36-0.030768-0.29990.382459
37-0.039568-0.38570.350305
38-0.040473-0.39450.347055
39-0.082115-0.80040.212751
400.0147410.14370.44303
410.0076840.07490.470229
420.0819740.7990.213146
430.0831410.81040.209879
440.1684731.64210.051941
450.0625070.60920.271909
46-0.01806-0.1760.430322
47-0.074879-0.72980.233644
48-0.03436-0.33490.369218

\begin{tabular}{lllllllll}
\hline
Autocorrelation Function \tabularnewline
Time lag k & ACF(k) & T-STAT & P-value \tabularnewline
1 & 0.463969 & 4.5222 & 9e-06 \tabularnewline
2 & 0.247833 & 2.4156 & 0.008811 \tabularnewline
3 & -0.013702 & -0.1336 & 0.447019 \tabularnewline
4 & -0.064049 & -0.6243 & 0.266971 \tabularnewline
5 & -0.194721 & -1.8979 & 0.030372 \tabularnewline
6 & -0.243756 & -2.3758 & 0.009758 \tabularnewline
7 & -0.21378 & -2.0837 & 0.019938 \tabularnewline
8 & -0.161765 & -1.5767 & 0.059096 \tabularnewline
9 & -0.158379 & -1.5437 & 0.062994 \tabularnewline
10 & -0.051021 & -0.4973 & 0.310067 \tabularnewline
11 & 0.035714 & 0.3481 & 0.364267 \tabularnewline
12 & 0.007801 & 0.076 & 0.469775 \tabularnewline
13 & -0.095312 & -0.929 & 0.177626 \tabularnewline
14 & -0.136096 & -1.3265 & 0.093927 \tabularnewline
15 & -0.0389 & -0.3792 & 0.352711 \tabularnewline
16 & -0.029158 & -0.2842 & 0.388439 \tabularnewline
17 & 0.013374 & 0.1304 & 0.44828 \tabularnewline
18 & -0.019377 & -0.1889 & 0.4253 \tabularnewline
19 & 0.039971 & 0.3896 & 0.348855 \tabularnewline
20 & -0.035573 & -0.3467 & 0.364782 \tabularnewline
21 & 0.074457 & 0.7257 & 0.234899 \tabularnewline
22 & 0.112313 & 1.0947 & 0.13821 \tabularnewline
23 & 0.130091 & 1.268 & 0.103954 \tabularnewline
24 & -0.030604 & -0.2983 & 0.383066 \tabularnewline
25 & 0.061766 & 0.602 & 0.274296 \tabularnewline
26 & -0.109695 & -1.0692 & 0.143851 \tabularnewline
27 & -0.11041 & -1.0761 & 0.142294 \tabularnewline
28 & -0.126346 & -1.2315 & 0.110594 \tabularnewline
29 & -0.093686 & -0.9131 & 0.181741 \tabularnewline
30 & -0.053497 & -0.5214 & 0.301642 \tabularnewline
31 & -0.074194 & -0.7232 & 0.235681 \tabularnewline
32 & 0.018372 & 0.1791 & 0.429132 \tabularnewline
33 & 0.161076 & 1.57 & 0.059873 \tabularnewline
34 & 0.139943 & 1.364 & 0.087896 \tabularnewline
35 & 0.049256 & 0.4801 & 0.316133 \tabularnewline
36 & -0.030768 & -0.2999 & 0.382459 \tabularnewline
37 & -0.039568 & -0.3857 & 0.350305 \tabularnewline
38 & -0.040473 & -0.3945 & 0.347055 \tabularnewline
39 & -0.082115 & -0.8004 & 0.212751 \tabularnewline
40 & 0.014741 & 0.1437 & 0.44303 \tabularnewline
41 & 0.007684 & 0.0749 & 0.470229 \tabularnewline
42 & 0.081974 & 0.799 & 0.213146 \tabularnewline
43 & 0.083141 & 0.8104 & 0.209879 \tabularnewline
44 & 0.168473 & 1.6421 & 0.051941 \tabularnewline
45 & 0.062507 & 0.6092 & 0.271909 \tabularnewline
46 & -0.01806 & -0.176 & 0.430322 \tabularnewline
47 & -0.074879 & -0.7298 & 0.233644 \tabularnewline
48 & -0.03436 & -0.3349 & 0.369218 \tabularnewline
\hline
\end{tabular}
%Source: https://freestatistics.org/blog/index.php?pk=277777&T=1

[TABLE]
[ROW][C]Autocorrelation Function[/C][/ROW]
[ROW][C]Time lag k[/C][C]ACF(k)[/C][C]T-STAT[/C][C]P-value[/C][/ROW]
[ROW][C]1[/C][C]0.463969[/C][C]4.5222[/C][C]9e-06[/C][/ROW]
[ROW][C]2[/C][C]0.247833[/C][C]2.4156[/C][C]0.008811[/C][/ROW]
[ROW][C]3[/C][C]-0.013702[/C][C]-0.1336[/C][C]0.447019[/C][/ROW]
[ROW][C]4[/C][C]-0.064049[/C][C]-0.6243[/C][C]0.266971[/C][/ROW]
[ROW][C]5[/C][C]-0.194721[/C][C]-1.8979[/C][C]0.030372[/C][/ROW]
[ROW][C]6[/C][C]-0.243756[/C][C]-2.3758[/C][C]0.009758[/C][/ROW]
[ROW][C]7[/C][C]-0.21378[/C][C]-2.0837[/C][C]0.019938[/C][/ROW]
[ROW][C]8[/C][C]-0.161765[/C][C]-1.5767[/C][C]0.059096[/C][/ROW]
[ROW][C]9[/C][C]-0.158379[/C][C]-1.5437[/C][C]0.062994[/C][/ROW]
[ROW][C]10[/C][C]-0.051021[/C][C]-0.4973[/C][C]0.310067[/C][/ROW]
[ROW][C]11[/C][C]0.035714[/C][C]0.3481[/C][C]0.364267[/C][/ROW]
[ROW][C]12[/C][C]0.007801[/C][C]0.076[/C][C]0.469775[/C][/ROW]
[ROW][C]13[/C][C]-0.095312[/C][C]-0.929[/C][C]0.177626[/C][/ROW]
[ROW][C]14[/C][C]-0.136096[/C][C]-1.3265[/C][C]0.093927[/C][/ROW]
[ROW][C]15[/C][C]-0.0389[/C][C]-0.3792[/C][C]0.352711[/C][/ROW]
[ROW][C]16[/C][C]-0.029158[/C][C]-0.2842[/C][C]0.388439[/C][/ROW]
[ROW][C]17[/C][C]0.013374[/C][C]0.1304[/C][C]0.44828[/C][/ROW]
[ROW][C]18[/C][C]-0.019377[/C][C]-0.1889[/C][C]0.4253[/C][/ROW]
[ROW][C]19[/C][C]0.039971[/C][C]0.3896[/C][C]0.348855[/C][/ROW]
[ROW][C]20[/C][C]-0.035573[/C][C]-0.3467[/C][C]0.364782[/C][/ROW]
[ROW][C]21[/C][C]0.074457[/C][C]0.7257[/C][C]0.234899[/C][/ROW]
[ROW][C]22[/C][C]0.112313[/C][C]1.0947[/C][C]0.13821[/C][/ROW]
[ROW][C]23[/C][C]0.130091[/C][C]1.268[/C][C]0.103954[/C][/ROW]
[ROW][C]24[/C][C]-0.030604[/C][C]-0.2983[/C][C]0.383066[/C][/ROW]
[ROW][C]25[/C][C]0.061766[/C][C]0.602[/C][C]0.274296[/C][/ROW]
[ROW][C]26[/C][C]-0.109695[/C][C]-1.0692[/C][C]0.143851[/C][/ROW]
[ROW][C]27[/C][C]-0.11041[/C][C]-1.0761[/C][C]0.142294[/C][/ROW]
[ROW][C]28[/C][C]-0.126346[/C][C]-1.2315[/C][C]0.110594[/C][/ROW]
[ROW][C]29[/C][C]-0.093686[/C][C]-0.9131[/C][C]0.181741[/C][/ROW]
[ROW][C]30[/C][C]-0.053497[/C][C]-0.5214[/C][C]0.301642[/C][/ROW]
[ROW][C]31[/C][C]-0.074194[/C][C]-0.7232[/C][C]0.235681[/C][/ROW]
[ROW][C]32[/C][C]0.018372[/C][C]0.1791[/C][C]0.429132[/C][/ROW]
[ROW][C]33[/C][C]0.161076[/C][C]1.57[/C][C]0.059873[/C][/ROW]
[ROW][C]34[/C][C]0.139943[/C][C]1.364[/C][C]0.087896[/C][/ROW]
[ROW][C]35[/C][C]0.049256[/C][C]0.4801[/C][C]0.316133[/C][/ROW]
[ROW][C]36[/C][C]-0.030768[/C][C]-0.2999[/C][C]0.382459[/C][/ROW]
[ROW][C]37[/C][C]-0.039568[/C][C]-0.3857[/C][C]0.350305[/C][/ROW]
[ROW][C]38[/C][C]-0.040473[/C][C]-0.3945[/C][C]0.347055[/C][/ROW]
[ROW][C]39[/C][C]-0.082115[/C][C]-0.8004[/C][C]0.212751[/C][/ROW]
[ROW][C]40[/C][C]0.014741[/C][C]0.1437[/C][C]0.44303[/C][/ROW]
[ROW][C]41[/C][C]0.007684[/C][C]0.0749[/C][C]0.470229[/C][/ROW]
[ROW][C]42[/C][C]0.081974[/C][C]0.799[/C][C]0.213146[/C][/ROW]
[ROW][C]43[/C][C]0.083141[/C][C]0.8104[/C][C]0.209879[/C][/ROW]
[ROW][C]44[/C][C]0.168473[/C][C]1.6421[/C][C]0.051941[/C][/ROW]
[ROW][C]45[/C][C]0.062507[/C][C]0.6092[/C][C]0.271909[/C][/ROW]
[ROW][C]46[/C][C]-0.01806[/C][C]-0.176[/C][C]0.430322[/C][/ROW]
[ROW][C]47[/C][C]-0.074879[/C][C]-0.7298[/C][C]0.233644[/C][/ROW]
[ROW][C]48[/C][C]-0.03436[/C][C]-0.3349[/C][C]0.369218[/C][/ROW]
[/TABLE]
Source: https://freestatistics.org/blog/index.php?pk=277777&T=1

Globally Unique Identifier (entire table): ba.freestatistics.org/blog/index.php?pk=277777&T=1

As an alternative you can also use a QR Code:  

The GUIDs for individual cells are displayed in the table below:

Autocorrelation Function
Time lag kACF(k)T-STATP-value
10.4639694.52229e-06
20.2478332.41560.008811
3-0.013702-0.13360.447019
4-0.064049-0.62430.266971
5-0.194721-1.89790.030372
6-0.243756-2.37580.009758
7-0.21378-2.08370.019938
8-0.161765-1.57670.059096
9-0.158379-1.54370.062994
10-0.051021-0.49730.310067
110.0357140.34810.364267
120.0078010.0760.469775
13-0.095312-0.9290.177626
14-0.136096-1.32650.093927
15-0.0389-0.37920.352711
16-0.029158-0.28420.388439
170.0133740.13040.44828
18-0.019377-0.18890.4253
190.0399710.38960.348855
20-0.035573-0.34670.364782
210.0744570.72570.234899
220.1123131.09470.13821
230.1300911.2680.103954
24-0.030604-0.29830.383066
250.0617660.6020.274296
26-0.109695-1.06920.143851
27-0.11041-1.07610.142294
28-0.126346-1.23150.110594
29-0.093686-0.91310.181741
30-0.053497-0.52140.301642
31-0.074194-0.72320.235681
320.0183720.17910.429132
330.1610761.570.059873
340.1399431.3640.087896
350.0492560.48010.316133
36-0.030768-0.29990.382459
37-0.039568-0.38570.350305
38-0.040473-0.39450.347055
39-0.082115-0.80040.212751
400.0147410.14370.44303
410.0076840.07490.470229
420.0819740.7990.213146
430.0831410.81040.209879
440.1684731.64210.051941
450.0625070.60920.271909
46-0.01806-0.1760.430322
47-0.074879-0.72980.233644
48-0.03436-0.33490.369218


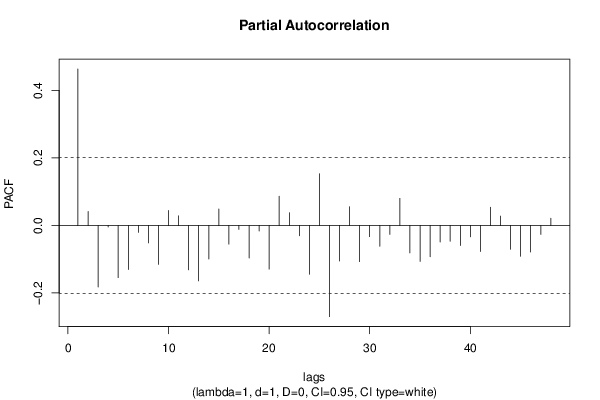
Partial Autocorrelation Function
Time lag kPACF(k)T-STATP-value
10.4639694.52229e-06
20.0414990.40450.343385
3-0.182761-1.78130.039027
4-0.004601-0.04480.482161
5-0.154784-1.50870.067353
6-0.130509-1.2720.10323
7-0.020514-0.20.420973
8-0.051758-0.50450.307547
9-0.11552-1.12590.131512
100.0444580.43330.332882
110.0284030.27680.391254
12-0.131636-1.2830.101301
13-0.164478-1.60310.056113
14-0.09929-0.96780.167812
150.0486070.47380.318377
16-0.055466-0.54060.295019
17-0.011711-0.11410.45468
18-0.096482-0.94040.174701
19-0.016377-0.15960.436759
20-0.129546-1.26270.104901
210.0865690.84380.200459
220.0375510.3660.357589
23-0.030567-0.29790.383202
24-0.14483-1.41160.080664
250.1533381.49460.069172
26-0.270397-2.63550.004906
27-0.105534-1.02860.153136
280.0552620.53860.295701
29-0.107206-1.04490.149356
30-0.033158-0.32320.373632
31-0.061903-0.60340.273854
32-0.026475-0.2580.398466
330.0802230.78190.218103
34-0.081454-0.79390.214612
35-0.106479-1.03780.150992
36-0.092976-0.90620.183557
37-0.048962-0.47720.31715
38-0.046673-0.45490.325105
39-0.059498-0.57990.281673
40-0.033801-0.32950.37127
41-0.077094-0.75140.227129
420.0541320.52760.2995
430.0276340.26930.394124
44-0.070694-0.6890.246239
45-0.091532-0.89210.187286
46-0.078652-0.76660.222609
47-0.026536-0.25860.398234
480.0214690.20930.417349

\begin{tabular}{lllllllll}
\hline
Partial Autocorrelation Function \tabularnewline
Time lag k & PACF(k) & T-STAT & P-value \tabularnewline
1 & 0.463969 & 4.5222 & 9e-06 \tabularnewline
2 & 0.041499 & 0.4045 & 0.343385 \tabularnewline
3 & -0.182761 & -1.7813 & 0.039027 \tabularnewline
4 & -0.004601 & -0.0448 & 0.482161 \tabularnewline
5 & -0.154784 & -1.5087 & 0.067353 \tabularnewline
6 & -0.130509 & -1.272 & 0.10323 \tabularnewline
7 & -0.020514 & -0.2 & 0.420973 \tabularnewline
8 & -0.051758 & -0.5045 & 0.307547 \tabularnewline
9 & -0.11552 & -1.1259 & 0.131512 \tabularnewline
10 & 0.044458 & 0.4333 & 0.332882 \tabularnewline
11 & 0.028403 & 0.2768 & 0.391254 \tabularnewline
12 & -0.131636 & -1.283 & 0.101301 \tabularnewline
13 & -0.164478 & -1.6031 & 0.056113 \tabularnewline
14 & -0.09929 & -0.9678 & 0.167812 \tabularnewline
15 & 0.048607 & 0.4738 & 0.318377 \tabularnewline
16 & -0.055466 & -0.5406 & 0.295019 \tabularnewline
17 & -0.011711 & -0.1141 & 0.45468 \tabularnewline
18 & -0.096482 & -0.9404 & 0.174701 \tabularnewline
19 & -0.016377 & -0.1596 & 0.436759 \tabularnewline
20 & -0.129546 & -1.2627 & 0.104901 \tabularnewline
21 & 0.086569 & 0.8438 & 0.200459 \tabularnewline
22 & 0.037551 & 0.366 & 0.357589 \tabularnewline
23 & -0.030567 & -0.2979 & 0.383202 \tabularnewline
24 & -0.14483 & -1.4116 & 0.080664 \tabularnewline
25 & 0.153338 & 1.4946 & 0.069172 \tabularnewline
26 & -0.270397 & -2.6355 & 0.004906 \tabularnewline
27 & -0.105534 & -1.0286 & 0.153136 \tabularnewline
28 & 0.055262 & 0.5386 & 0.295701 \tabularnewline
29 & -0.107206 & -1.0449 & 0.149356 \tabularnewline
30 & -0.033158 & -0.3232 & 0.373632 \tabularnewline
31 & -0.061903 & -0.6034 & 0.273854 \tabularnewline
32 & -0.026475 & -0.258 & 0.398466 \tabularnewline
33 & 0.080223 & 0.7819 & 0.218103 \tabularnewline
34 & -0.081454 & -0.7939 & 0.214612 \tabularnewline
35 & -0.106479 & -1.0378 & 0.150992 \tabularnewline
36 & -0.092976 & -0.9062 & 0.183557 \tabularnewline
37 & -0.048962 & -0.4772 & 0.31715 \tabularnewline
38 & -0.046673 & -0.4549 & 0.325105 \tabularnewline
39 & -0.059498 & -0.5799 & 0.281673 \tabularnewline
40 & -0.033801 & -0.3295 & 0.37127 \tabularnewline
41 & -0.077094 & -0.7514 & 0.227129 \tabularnewline
42 & 0.054132 & 0.5276 & 0.2995 \tabularnewline
43 & 0.027634 & 0.2693 & 0.394124 \tabularnewline
44 & -0.070694 & -0.689 & 0.246239 \tabularnewline
45 & -0.091532 & -0.8921 & 0.187286 \tabularnewline
46 & -0.078652 & -0.7666 & 0.222609 \tabularnewline
47 & -0.026536 & -0.2586 & 0.398234 \tabularnewline
48 & 0.021469 & 0.2093 & 0.417349 \tabularnewline
\hline
\end{tabular}
%Source: https://freestatistics.org/blog/index.php?pk=277777&T=2

[TABLE]
[ROW][C]Partial Autocorrelation Function[/C][/ROW]
[ROW][C]Time lag k[/C][C]PACF(k)[/C][C]T-STAT[/C][C]P-value[/C][/ROW]
[ROW][C]1[/C][C]0.463969[/C][C]4.5222[/C][C]9e-06[/C][/ROW]
[ROW][C]2[/C][C]0.041499[/C][C]0.4045[/C][C]0.343385[/C][/ROW]
[ROW][C]3[/C][C]-0.182761[/C][C]-1.7813[/C][C]0.039027[/C][/ROW]
[ROW][C]4[/C][C]-0.004601[/C][C]-0.0448[/C][C]0.482161[/C][/ROW]
[ROW][C]5[/C][C]-0.154784[/C][C]-1.5087[/C][C]0.067353[/C][/ROW]
[ROW][C]6[/C][C]-0.130509[/C][C]-1.272[/C][C]0.10323[/C][/ROW]
[ROW][C]7[/C][C]-0.020514[/C][C]-0.2[/C][C]0.420973[/C][/ROW]
[ROW][C]8[/C][C]-0.051758[/C][C]-0.5045[/C][C]0.307547[/C][/ROW]
[ROW][C]9[/C][C]-0.11552[/C][C]-1.1259[/C][C]0.131512[/C][/ROW]
[ROW][C]10[/C][C]0.044458[/C][C]0.4333[/C][C]0.332882[/C][/ROW]
[ROW][C]11[/C][C]0.028403[/C][C]0.2768[/C][C]0.391254[/C][/ROW]
[ROW][C]12[/C][C]-0.131636[/C][C]-1.283[/C][C]0.101301[/C][/ROW]
[ROW][C]13[/C][C]-0.164478[/C][C]-1.6031[/C][C]0.056113[/C][/ROW]
[ROW][C]14[/C][C]-0.09929[/C][C]-0.9678[/C][C]0.167812[/C][/ROW]
[ROW][C]15[/C][C]0.048607[/C][C]0.4738[/C][C]0.318377[/C][/ROW]
[ROW][C]16[/C][C]-0.055466[/C][C]-0.5406[/C][C]0.295019[/C][/ROW]
[ROW][C]17[/C][C]-0.011711[/C][C]-0.1141[/C][C]0.45468[/C][/ROW]
[ROW][C]18[/C][C]-0.096482[/C][C]-0.9404[/C][C]0.174701[/C][/ROW]
[ROW][C]19[/C][C]-0.016377[/C][C]-0.1596[/C][C]0.436759[/C][/ROW]
[ROW][C]20[/C][C]-0.129546[/C][C]-1.2627[/C][C]0.104901[/C][/ROW]
[ROW][C]21[/C][C]0.086569[/C][C]0.8438[/C][C]0.200459[/C][/ROW]
[ROW][C]22[/C][C]0.037551[/C][C]0.366[/C][C]0.357589[/C][/ROW]
[ROW][C]23[/C][C]-0.030567[/C][C]-0.2979[/C][C]0.383202[/C][/ROW]
[ROW][C]24[/C][C]-0.14483[/C][C]-1.4116[/C][C]0.080664[/C][/ROW]
[ROW][C]25[/C][C]0.153338[/C][C]1.4946[/C][C]0.069172[/C][/ROW]
[ROW][C]26[/C][C]-0.270397[/C][C]-2.6355[/C][C]0.004906[/C][/ROW]
[ROW][C]27[/C][C]-0.105534[/C][C]-1.0286[/C][C]0.153136[/C][/ROW]
[ROW][C]28[/C][C]0.055262[/C][C]0.5386[/C][C]0.295701[/C][/ROW]
[ROW][C]29[/C][C]-0.107206[/C][C]-1.0449[/C][C]0.149356[/C][/ROW]
[ROW][C]30[/C][C]-0.033158[/C][C]-0.3232[/C][C]0.373632[/C][/ROW]
[ROW][C]31[/C][C]-0.061903[/C][C]-0.6034[/C][C]0.273854[/C][/ROW]
[ROW][C]32[/C][C]-0.026475[/C][C]-0.258[/C][C]0.398466[/C][/ROW]
[ROW][C]33[/C][C]0.080223[/C][C]0.7819[/C][C]0.218103[/C][/ROW]
[ROW][C]34[/C][C]-0.081454[/C][C]-0.7939[/C][C]0.214612[/C][/ROW]
[ROW][C]35[/C][C]-0.106479[/C][C]-1.0378[/C][C]0.150992[/C][/ROW]
[ROW][C]36[/C][C]-0.092976[/C][C]-0.9062[/C][C]0.183557[/C][/ROW]
[ROW][C]37[/C][C]-0.048962[/C][C]-0.4772[/C][C]0.31715[/C][/ROW]
[ROW][C]38[/C][C]-0.046673[/C][C]-0.4549[/C][C]0.325105[/C][/ROW]
[ROW][C]39[/C][C]-0.059498[/C][C]-0.5799[/C][C]0.281673[/C][/ROW]
[ROW][C]40[/C][C]-0.033801[/C][C]-0.3295[/C][C]0.37127[/C][/ROW]
[ROW][C]41[/C][C]-0.077094[/C][C]-0.7514[/C][C]0.227129[/C][/ROW]
[ROW][C]42[/C][C]0.054132[/C][C]0.5276[/C][C]0.2995[/C][/ROW]
[ROW][C]43[/C][C]0.027634[/C][C]0.2693[/C][C]0.394124[/C][/ROW]
[ROW][C]44[/C][C]-0.070694[/C][C]-0.689[/C][C]0.246239[/C][/ROW]
[ROW][C]45[/C][C]-0.091532[/C][C]-0.8921[/C][C]0.187286[/C][/ROW]
[ROW][C]46[/C][C]-0.078652[/C][C]-0.7666[/C][C]0.222609[/C][/ROW]
[ROW][C]47[/C][C]-0.026536[/C][C]-0.2586[/C][C]0.398234[/C][/ROW]
[ROW][C]48[/C][C]0.021469[/C][C]0.2093[/C][C]0.417349[/C][/ROW]
[/TABLE]
Source: https://freestatistics.org/blog/index.php?pk=277777&T=2

Globally Unique Identifier (entire table): ba.freestatistics.org/blog/index.php?pk=277777&T=2

As an alternative you can also use a QR Code:  

The GUIDs for individual cells are displayed in the table below:

Partial Autocorrelation Function
Time lag kPACF(k)T-STATP-value
10.4639694.52229e-06
20.0414990.40450.343385
3-0.182761-1.78130.039027
4-0.004601-0.04480.482161
5-0.154784-1.50870.067353
6-0.130509-1.2720.10323
7-0.020514-0.20.420973
8-0.051758-0.50450.307547
9-0.11552-1.12590.131512
100.0444580.43330.332882
110.0284030.27680.391254
12-0.131636-1.2830.101301
13-0.164478-1.60310.056113
14-0.09929-0.96780.167812
150.0486070.47380.318377
16-0.055466-0.54060.295019
17-0.011711-0.11410.45468
18-0.096482-0.94040.174701
19-0.016377-0.15960.436759
20-0.129546-1.26270.104901
210.0865690.84380.200459
220.0375510.3660.357589
23-0.030567-0.29790.383202
24-0.14483-1.41160.080664
250.1533381.49460.069172
26-0.270397-2.63550.004906
27-0.105534-1.02860.153136
280.0552620.53860.295701
29-0.107206-1.04490.149356
30-0.033158-0.32320.373632
31-0.061903-0.60340.273854
32-0.026475-0.2580.398466
330.0802230.78190.218103
34-0.081454-0.79390.214612
35-0.106479-1.03780.150992
36-0.092976-0.90620.183557
37-0.048962-0.47720.31715
38-0.046673-0.45490.325105
39-0.059498-0.57990.281673
40-0.033801-0.32950.37127
41-0.077094-0.75140.227129
420.0541320.52760.2995
430.0276340.26930.394124
44-0.070694-0.6890.246239
45-0.091532-0.89210.187286
46-0.078652-0.76660.222609
47-0.026536-0.25860.398234
480.0214690.20930.417349


Parameters (Session):
par1 = 48 ; par2 = 1 ; par3 = 1 ; par4 = 0 ; par5 = 12 ; par6 = White Noise ; par7 = 0.95 ;
Parameters (R input):
par1 = 48 ; par2 = 1 ; par3 = 1 ; par4 = 0 ; par5 = 12 ; par6 = White Noise ; par7 = 0.95 ; par8 = ;
R code (references can be found in the software module):
if (par1 == 'Default') {
par1 = 10*log10(length(x))
} else {
par1 <- as.numeric(par1)
}
par2 <- as.numeric(par2)
par3 <- as.numeric(par3)
par4 <- as.numeric(par4)
par5 <- as.numeric(par5)
if (par6 == 'White Noise') par6 <- 'white' else par6 <- 'ma'
par7 <- as.numeric(par7)
if (par8 != '') par8 <- as.numeric(par8)
ox <- x
if (par8 == '') {
if (par2 == 0) {
x <- log(x)
} else {
x <- (x ^ par2 - 1) / par2
}
} else {
x <- log(x,base=par8)
}
if (par3 > 0) x <- diff(x,lag=1,difference=par3)
if (par4 > 0) x <- diff(x,lag=par5,difference=par4)
bitmap(file='picts.png')
op <- par(mfrow=c(2,1))
plot(ox,type='l',main='Original Time Series',xlab='time',ylab='value')
if (par8=='') {
mytitle <- paste('Working Time Series (lambda=',par2,', d=',par3,', D=',par4,')',sep='')
mysub <- paste('(lambda=',par2,', d=',par3,', D=',par4,', CI=', par7, ', CI type=',par6,')',sep='')
} else {
mytitle <- paste('Working Time Series (base=',par8,', d=',par3,', D=',par4,')',sep='')
mysub <- paste('(base=',par8,', d=',par3,', D=',par4,', CI=', par7, ', CI type=',par6,')',sep='')
}
plot(x,type='l', main=mytitle,xlab='time',ylab='value')
par(op)
dev.off()
bitmap(file='pic1.png')
racf <- acf(x, par1, main='Autocorrelation', xlab='time lag', ylab='ACF', ci.type=par6, ci=par7, sub=mysub)
dev.off()
bitmap(file='pic2.png')
rpacf <- pacf(x,par1,main='Partial Autocorrelation',xlab='lags',ylab='PACF',sub=mysub)
dev.off()
(myacf <- c(racf$acf))
(mypacf <- c(rpacf$acf))
lengthx <- length(x)
sqrtn <- sqrt(lengthx)
load(file='createtable')
a<-table.start()
a<-table.row.start(a)
a<-table.element(a,'Autocorrelation Function',4,TRUE)
a<-table.row.end(a)
a<-table.row.start(a)
a<-table.element(a,'Time lag k',header=TRUE)
a<-table.element(a,hyperlink('basics.htm','ACF(k)','click here for more information about the Autocorrelation Function'),header=TRUE)
a<-table.element(a,'T-STAT',header=TRUE)
a<-table.element(a,'P-value',header=TRUE)
a<-table.row.end(a)
for (i in 2:(par1+1)) {
a<-table.row.start(a)
a<-table.element(a,i-1,header=TRUE)
a<-table.element(a,round(myacf[i],6))
mytstat <- myacf[i]*sqrtn
a<-table.element(a,round(mytstat,4))
a<-table.element(a,round(1-pt(abs(mytstat),lengthx),6))
a<-table.row.end(a)
}
a<-table.end(a)
table.save(a,file='mytable.tab')
a<-table.start()
a<-table.row.start(a)
a<-table.element(a,'Partial Autocorrelation Function',4,TRUE)
a<-table.row.end(a)
a<-table.row.start(a)
a<-table.element(a,'Time lag k',header=TRUE)
a<-table.element(a,hyperlink('basics.htm','PACF(k)','click here for more information about the Partial Autocorrelation Function'),header=TRUE)
a<-table.element(a,'T-STAT',header=TRUE)
a<-table.element(a,'P-value',header=TRUE)
a<-table.row.end(a)
for (i in 1:par1) {
a<-table.row.start(a)
a<-table.element(a,i,header=TRUE)
a<-table.element(a,round(mypacf[i],6))
mytstat <- mypacf[i]*sqrtn
a<-table.element(a,round(mytstat,4))
a<-table.element(a,round(1-pt(abs(mytstat),lengthx),6))
a<-table.row.end(a)
}
a<-table.end(a)
table.save(a,file='mytable1.tab')