Free Statistics

of Irreproducible Research!

Author's title

Author*Unverified author*
R Software Modulerwasp_autocorrelation.wasp
Title produced by software(Partial) Autocorrelation Function
Date of computationMon, 02 Mar 2015 14:57:39 +0000
Cite this page as followsStatistical Computations at FreeStatistics.org, Office for Research Development and Education, URL https://freestatistics.org/blog/index.php?v=date/2015/Mar/02/t1425308288f2p12tvbd386t6q.htm/, Retrieved Fri, 17 May 2024 15:30:25 +0000
Statistical Computations at FreeStatistics.org, Office for Research Development and Education, URL https://freestatistics.org/blog/index.php?pk=277817, Retrieved Fri, 17 May 2024 15:30:25 +0000
QR Codes:

Original text written by user:
IsPrivate?No (this computation is public)
User-defined keywordsGlenn Waem
Estimated Impact58
Family? (F = Feedback message, R = changed R code, M = changed R Module, P = changed Parameters, D = changed Data)
-       [(Partial) Autocorrelation Function] [] [2015-03-02 14:57:39] [3d92bf785db8aeb0f2ab1bed7b74f49c] [Current]
Feedback Forum

Post a new message
Dataseries X:
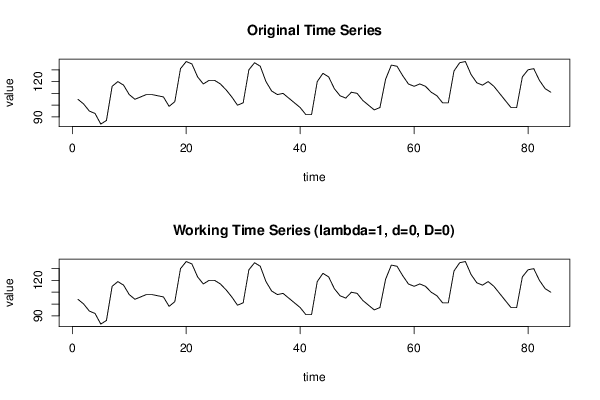
105
101
95
93
84
87
116
120
117
109
105
107
109
109
108
107
99
103
131
137
135
124
118
121
121
118
113
107
100
102
130
136
133
120
112
109
110
106
102
98
92
92
120
127
124
114
108
106
111
110
104
100
96
98
122
134
133
125
118
116
118
116
111
108
102
102
129
136
137
126
119
117
120
116
110
104
98
98
124
130
131
121
114
111


Summary of computational transaction
Raw Inputview raw input (R code)
Raw Outputview raw output of R engine
Computing time1 seconds
R Server'Gertrude Mary Cox' @ cox.wessa.net

\begin{tabular}{lllllllll}
\hline
Summary of computational transaction \tabularnewline
Raw Input & view raw input (R code)  \tabularnewline
Raw Output & view raw output of R engine  \tabularnewline
Computing time & 1 seconds \tabularnewline
R Server & 'Gertrude Mary Cox' @ cox.wessa.net \tabularnewline
\hline
\end{tabular}
%Source: https://freestatistics.org/blog/index.php?pk=277817&T=0

[TABLE]
[ROW][C]Summary of computational transaction[/C][/ROW]
[ROW][C]Raw Input[/C][C]view raw input (R code) [/C][/ROW]
[ROW][C]Raw Output[/C][C]view raw output of R engine [/C][/ROW]
[ROW][C]Computing time[/C][C]1 seconds[/C][/ROW]
[ROW][C]R Server[/C][C]'Gertrude Mary Cox' @ cox.wessa.net[/C][/ROW]
[/TABLE]
Source: https://freestatistics.org/blog/index.php?pk=277817&T=0

Globally Unique Identifier (entire table): ba.freestatistics.org/blog/index.php?pk=277817&T=0

As an alternative you can also use a QR Code:  

The GUIDs for individual cells are displayed in the table below:

Summary of computational transaction
Raw Inputview raw input (R code)
Raw Outputview raw output of R engine
Computing time1 seconds
R Server'Gertrude Mary Cox' @ cox.wessa.net


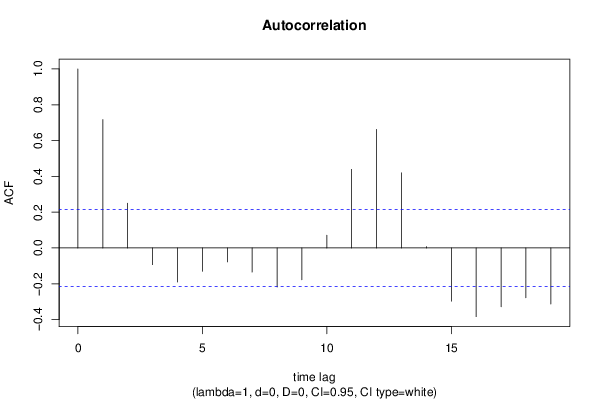
Autocorrelation Function
Time lag kACF(k)T-STATP-value
10.7170866.57220
20.2494662.28640.012374
3-0.093095-0.85320.197978
4-0.189858-1.74010.042754
5-0.129748-1.18920.118864
6-0.07762-0.71140.239403
7-0.134761-1.23510.110118
8-0.217666-1.99490.024646
9-0.17776-1.62920.053508
100.0711160.65180.258159
110.4390824.02436.2e-05
120.6623166.07020
130.419413.8440.000117
140.0075020.06880.472674
15-0.296774-2.720.003966
16-0.383614-3.51590.000355
17-0.328026-3.00640.001743
18-0.277999-2.54790.006329
19-0.312587-2.86490.002634

\begin{tabular}{lllllllll}
\hline
Autocorrelation Function \tabularnewline
Time lag k & ACF(k) & T-STAT & P-value \tabularnewline
1 & 0.717086 & 6.5722 & 0 \tabularnewline
2 & 0.249466 & 2.2864 & 0.012374 \tabularnewline
3 & -0.093095 & -0.8532 & 0.197978 \tabularnewline
4 & -0.189858 & -1.7401 & 0.042754 \tabularnewline
5 & -0.129748 & -1.1892 & 0.118864 \tabularnewline
6 & -0.07762 & -0.7114 & 0.239403 \tabularnewline
7 & -0.134761 & -1.2351 & 0.110118 \tabularnewline
8 & -0.217666 & -1.9949 & 0.024646 \tabularnewline
9 & -0.17776 & -1.6292 & 0.053508 \tabularnewline
10 & 0.071116 & 0.6518 & 0.258159 \tabularnewline
11 & 0.439082 & 4.0243 & 6.2e-05 \tabularnewline
12 & 0.662316 & 6.0702 & 0 \tabularnewline
13 & 0.41941 & 3.844 & 0.000117 \tabularnewline
14 & 0.007502 & 0.0688 & 0.472674 \tabularnewline
15 & -0.296774 & -2.72 & 0.003966 \tabularnewline
16 & -0.383614 & -3.5159 & 0.000355 \tabularnewline
17 & -0.328026 & -3.0064 & 0.001743 \tabularnewline
18 & -0.277999 & -2.5479 & 0.006329 \tabularnewline
19 & -0.312587 & -2.8649 & 0.002634 \tabularnewline
\hline
\end{tabular}
%Source: https://freestatistics.org/blog/index.php?pk=277817&T=1

[TABLE]
[ROW][C]Autocorrelation Function[/C][/ROW]
[ROW][C]Time lag k[/C][C]ACF(k)[/C][C]T-STAT[/C][C]P-value[/C][/ROW]
[ROW][C]1[/C][C]0.717086[/C][C]6.5722[/C][C]0[/C][/ROW]
[ROW][C]2[/C][C]0.249466[/C][C]2.2864[/C][C]0.012374[/C][/ROW]
[ROW][C]3[/C][C]-0.093095[/C][C]-0.8532[/C][C]0.197978[/C][/ROW]
[ROW][C]4[/C][C]-0.189858[/C][C]-1.7401[/C][C]0.042754[/C][/ROW]
[ROW][C]5[/C][C]-0.129748[/C][C]-1.1892[/C][C]0.118864[/C][/ROW]
[ROW][C]6[/C][C]-0.07762[/C][C]-0.7114[/C][C]0.239403[/C][/ROW]
[ROW][C]7[/C][C]-0.134761[/C][C]-1.2351[/C][C]0.110118[/C][/ROW]
[ROW][C]8[/C][C]-0.217666[/C][C]-1.9949[/C][C]0.024646[/C][/ROW]
[ROW][C]9[/C][C]-0.17776[/C][C]-1.6292[/C][C]0.053508[/C][/ROW]
[ROW][C]10[/C][C]0.071116[/C][C]0.6518[/C][C]0.258159[/C][/ROW]
[ROW][C]11[/C][C]0.439082[/C][C]4.0243[/C][C]6.2e-05[/C][/ROW]
[ROW][C]12[/C][C]0.662316[/C][C]6.0702[/C][C]0[/C][/ROW]
[ROW][C]13[/C][C]0.41941[/C][C]3.844[/C][C]0.000117[/C][/ROW]
[ROW][C]14[/C][C]0.007502[/C][C]0.0688[/C][C]0.472674[/C][/ROW]
[ROW][C]15[/C][C]-0.296774[/C][C]-2.72[/C][C]0.003966[/C][/ROW]
[ROW][C]16[/C][C]-0.383614[/C][C]-3.5159[/C][C]0.000355[/C][/ROW]
[ROW][C]17[/C][C]-0.328026[/C][C]-3.0064[/C][C]0.001743[/C][/ROW]
[ROW][C]18[/C][C]-0.277999[/C][C]-2.5479[/C][C]0.006329[/C][/ROW]
[ROW][C]19[/C][C]-0.312587[/C][C]-2.8649[/C][C]0.002634[/C][/ROW]
[/TABLE]
Source: https://freestatistics.org/blog/index.php?pk=277817&T=1

Globally Unique Identifier (entire table): ba.freestatistics.org/blog/index.php?pk=277817&T=1

As an alternative you can also use a QR Code:  

The GUIDs for individual cells are displayed in the table below:

Autocorrelation Function
Time lag kACF(k)T-STATP-value
10.7170866.57220
20.2494662.28640.012374
3-0.093095-0.85320.197978
4-0.189858-1.74010.042754
5-0.129748-1.18920.118864
6-0.07762-0.71140.239403
7-0.134761-1.23510.110118
8-0.217666-1.99490.024646
9-0.17776-1.62920.053508
100.0711160.65180.258159
110.4390824.02436.2e-05
120.6623166.07020
130.419413.8440.000117
140.0075020.06880.472674
15-0.296774-2.720.003966
16-0.383614-3.51590.000355
17-0.328026-3.00640.001743
18-0.277999-2.54790.006329
19-0.312587-2.86490.002634


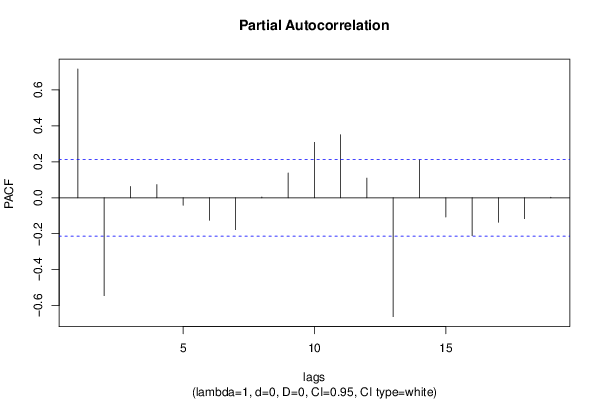
Partial Autocorrelation Function
Time lag kPACF(k)T-STATP-value
10.7170866.57220
2-0.544985-4.99492e-06
30.0624460.57230.284314
40.073150.67040.25221
5-0.04138-0.37930.352729
6-0.125445-1.14970.126761
7-0.177696-1.62860.05357
80.0045440.04160.48344
90.1379981.26480.104725
100.3082862.82550.002948
110.3511963.21880.000915
120.1092481.00130.159785
13-0.661905-6.06650
140.2098961.92370.028888
15-0.106794-0.97880.165248
16-0.210933-1.93320.028288
17-0.136383-1.250.10739
18-0.116379-1.06660.144596
190.0031090.02850.488669

\begin{tabular}{lllllllll}
\hline
Partial Autocorrelation Function \tabularnewline
Time lag k & PACF(k) & T-STAT & P-value \tabularnewline
1 & 0.717086 & 6.5722 & 0 \tabularnewline
2 & -0.544985 & -4.9949 & 2e-06 \tabularnewline
3 & 0.062446 & 0.5723 & 0.284314 \tabularnewline
4 & 0.07315 & 0.6704 & 0.25221 \tabularnewline
5 & -0.04138 & -0.3793 & 0.352729 \tabularnewline
6 & -0.125445 & -1.1497 & 0.126761 \tabularnewline
7 & -0.177696 & -1.6286 & 0.05357 \tabularnewline
8 & 0.004544 & 0.0416 & 0.48344 \tabularnewline
9 & 0.137998 & 1.2648 & 0.104725 \tabularnewline
10 & 0.308286 & 2.8255 & 0.002948 \tabularnewline
11 & 0.351196 & 3.2188 & 0.000915 \tabularnewline
12 & 0.109248 & 1.0013 & 0.159785 \tabularnewline
13 & -0.661905 & -6.0665 & 0 \tabularnewline
14 & 0.209896 & 1.9237 & 0.028888 \tabularnewline
15 & -0.106794 & -0.9788 & 0.165248 \tabularnewline
16 & -0.210933 & -1.9332 & 0.028288 \tabularnewline
17 & -0.136383 & -1.25 & 0.10739 \tabularnewline
18 & -0.116379 & -1.0666 & 0.144596 \tabularnewline
19 & 0.003109 & 0.0285 & 0.488669 \tabularnewline
\hline
\end{tabular}
%Source: https://freestatistics.org/blog/index.php?pk=277817&T=2

[TABLE]
[ROW][C]Partial Autocorrelation Function[/C][/ROW]
[ROW][C]Time lag k[/C][C]PACF(k)[/C][C]T-STAT[/C][C]P-value[/C][/ROW]
[ROW][C]1[/C][C]0.717086[/C][C]6.5722[/C][C]0[/C][/ROW]
[ROW][C]2[/C][C]-0.544985[/C][C]-4.9949[/C][C]2e-06[/C][/ROW]
[ROW][C]3[/C][C]0.062446[/C][C]0.5723[/C][C]0.284314[/C][/ROW]
[ROW][C]4[/C][C]0.07315[/C][C]0.6704[/C][C]0.25221[/C][/ROW]
[ROW][C]5[/C][C]-0.04138[/C][C]-0.3793[/C][C]0.352729[/C][/ROW]
[ROW][C]6[/C][C]-0.125445[/C][C]-1.1497[/C][C]0.126761[/C][/ROW]
[ROW][C]7[/C][C]-0.177696[/C][C]-1.6286[/C][C]0.05357[/C][/ROW]
[ROW][C]8[/C][C]0.004544[/C][C]0.0416[/C][C]0.48344[/C][/ROW]
[ROW][C]9[/C][C]0.137998[/C][C]1.2648[/C][C]0.104725[/C][/ROW]
[ROW][C]10[/C][C]0.308286[/C][C]2.8255[/C][C]0.002948[/C][/ROW]
[ROW][C]11[/C][C]0.351196[/C][C]3.2188[/C][C]0.000915[/C][/ROW]
[ROW][C]12[/C][C]0.109248[/C][C]1.0013[/C][C]0.159785[/C][/ROW]
[ROW][C]13[/C][C]-0.661905[/C][C]-6.0665[/C][C]0[/C][/ROW]
[ROW][C]14[/C][C]0.209896[/C][C]1.9237[/C][C]0.028888[/C][/ROW]
[ROW][C]15[/C][C]-0.106794[/C][C]-0.9788[/C][C]0.165248[/C][/ROW]
[ROW][C]16[/C][C]-0.210933[/C][C]-1.9332[/C][C]0.028288[/C][/ROW]
[ROW][C]17[/C][C]-0.136383[/C][C]-1.25[/C][C]0.10739[/C][/ROW]
[ROW][C]18[/C][C]-0.116379[/C][C]-1.0666[/C][C]0.144596[/C][/ROW]
[ROW][C]19[/C][C]0.003109[/C][C]0.0285[/C][C]0.488669[/C][/ROW]
[/TABLE]
Source: https://freestatistics.org/blog/index.php?pk=277817&T=2

Globally Unique Identifier (entire table): ba.freestatistics.org/blog/index.php?pk=277817&T=2

As an alternative you can also use a QR Code:  

The GUIDs for individual cells are displayed in the table below:

Partial Autocorrelation Function
Time lag kPACF(k)T-STATP-value
10.7170866.57220
2-0.544985-4.99492e-06
30.0624460.57230.284314
40.073150.67040.25221
5-0.04138-0.37930.352729
6-0.125445-1.14970.126761
7-0.177696-1.62860.05357
80.0045440.04160.48344
90.1379981.26480.104725
100.3082862.82550.002948
110.3511963.21880.000915
120.1092481.00130.159785
13-0.661905-6.06650
140.2098961.92370.028888
15-0.106794-0.97880.165248
16-0.210933-1.93320.028288
17-0.136383-1.250.10739
18-0.116379-1.06660.144596
190.0031090.02850.488669


Parameters (Session):
par1 = Default ; par2 = 1 ; par3 = 0 ; par4 = 0 ; par5 = 12 ; par6 = White Noise ; par7 = 0.95 ;
Parameters (R input):
par1 = Default ; par2 = 1 ; par3 = 0 ; par4 = 0 ; par5 = 12 ; par6 = White Noise ; par7 = 0.95 ; par8 = ;
R code (references can be found in the software module):
if (par1 == 'Default') {
par1 = 10*log10(length(x))
} else {
par1 <- as.numeric(par1)
}
par2 <- as.numeric(par2)
par3 <- as.numeric(par3)
par4 <- as.numeric(par4)
par5 <- as.numeric(par5)
if (par6 == 'White Noise') par6 <- 'white' else par6 <- 'ma'
par7 <- as.numeric(par7)
if (par8 != '') par8 <- as.numeric(par8)
ox <- x
if (par8 == '') {
if (par2 == 0) {
x <- log(x)
} else {
x <- (x ^ par2 - 1) / par2
}
} else {
x <- log(x,base=par8)
}
if (par3 > 0) x <- diff(x,lag=1,difference=par3)
if (par4 > 0) x <- diff(x,lag=par5,difference=par4)
bitmap(file='picts.png')
op <- par(mfrow=c(2,1))
plot(ox,type='l',main='Original Time Series',xlab='time',ylab='value')
if (par8=='') {
mytitle <- paste('Working Time Series (lambda=',par2,', d=',par3,', D=',par4,')',sep='')
mysub <- paste('(lambda=',par2,', d=',par3,', D=',par4,', CI=', par7, ', CI type=',par6,')',sep='')
} else {
mytitle <- paste('Working Time Series (base=',par8,', d=',par3,', D=',par4,')',sep='')
mysub <- paste('(base=',par8,', d=',par3,', D=',par4,', CI=', par7, ', CI type=',par6,')',sep='')
}
plot(x,type='l', main=mytitle,xlab='time',ylab='value')
par(op)
dev.off()
bitmap(file='pic1.png')
racf <- acf(x, par1, main='Autocorrelation', xlab='time lag', ylab='ACF', ci.type=par6, ci=par7, sub=mysub)
dev.off()
bitmap(file='pic2.png')
rpacf <- pacf(x,par1,main='Partial Autocorrelation',xlab='lags',ylab='PACF',sub=mysub)
dev.off()
(myacf <- c(racf$acf))
(mypacf <- c(rpacf$acf))
lengthx <- length(x)
sqrtn <- sqrt(lengthx)
load(file='createtable')
a<-table.start()
a<-table.row.start(a)
a<-table.element(a,'Autocorrelation Function',4,TRUE)
a<-table.row.end(a)
a<-table.row.start(a)
a<-table.element(a,'Time lag k',header=TRUE)
a<-table.element(a,hyperlink('basics.htm','ACF(k)','click here for more information about the Autocorrelation Function'),header=TRUE)
a<-table.element(a,'T-STAT',header=TRUE)
a<-table.element(a,'P-value',header=TRUE)
a<-table.row.end(a)
for (i in 2:(par1+1)) {
a<-table.row.start(a)
a<-table.element(a,i-1,header=TRUE)
a<-table.element(a,round(myacf[i],6))
mytstat <- myacf[i]*sqrtn
a<-table.element(a,round(mytstat,4))
a<-table.element(a,round(1-pt(abs(mytstat),lengthx),6))
a<-table.row.end(a)
}
a<-table.end(a)
table.save(a,file='mytable.tab')
a<-table.start()
a<-table.row.start(a)
a<-table.element(a,'Partial Autocorrelation Function',4,TRUE)
a<-table.row.end(a)
a<-table.row.start(a)
a<-table.element(a,'Time lag k',header=TRUE)
a<-table.element(a,hyperlink('basics.htm','PACF(k)','click here for more information about the Partial Autocorrelation Function'),header=TRUE)
a<-table.element(a,'T-STAT',header=TRUE)
a<-table.element(a,'P-value',header=TRUE)
a<-table.row.end(a)
for (i in 1:par1) {
a<-table.row.start(a)
a<-table.element(a,i,header=TRUE)
a<-table.element(a,round(mypacf[i],6))
mytstat <- mypacf[i]*sqrtn
a<-table.element(a,round(mytstat,4))
a<-table.element(a,round(1-pt(abs(mytstat),lengthx),6))
a<-table.row.end(a)
}
a<-table.end(a)
table.save(a,file='mytable1.tab')