Free Statistics

of Irreproducible Research!

Author's title

Author*Unverified author*
R Software Modulerwasp_autocorrelation.wasp
Title produced by software(Partial) Autocorrelation Function
Date of computationMon, 02 Mar 2015 18:53:56 +0000
Cite this page as followsStatistical Computations at FreeStatistics.org, Office for Research Development and Education, URL https://freestatistics.org/blog/index.php?v=date/2015/Mar/02/t1425322466txu8ofxiptisqu8.htm/, Retrieved Fri, 17 May 2024 12:40:58 +0000
Statistical Computations at FreeStatistics.org, Office for Research Development and Education, URL https://freestatistics.org/blog/index.php?pk=277833, Retrieved Fri, 17 May 2024 12:40:58 +0000
QR Codes:

Original text written by user:
IsPrivate?No (this computation is public)
User-defined keywords
Estimated Impact72
Family? (F = Feedback message, R = changed R code, M = changed R Module, P = changed Parameters, D = changed Data)
-       [(Partial) Autocorrelation Function] [] [2015-03-02 18:53:56] [76397d743865651feb25fadce13a6a2d] [Current]
Feedback Forum

Post a new message
Dataseries X:
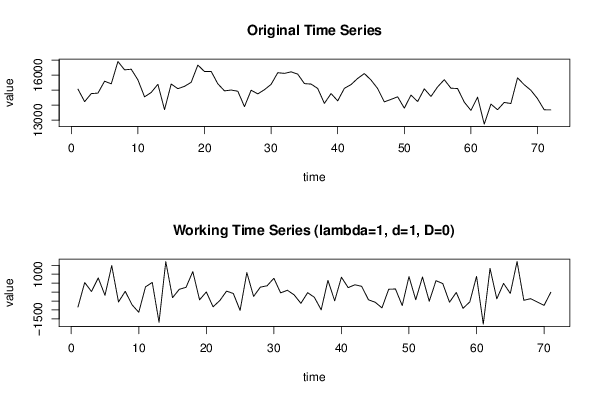
15071
14236
14771
14804
15597
15418
16903
16350
16393
15685
14556
14850
15391
13704
15409
15098
15254
15522
16669
16238
16246
15424
14952
15008
14929
13905
14994
14753
15031
15386
16160
16116
16219
16064
15436
15404
15112
14119
14775
14289
15121
15371
15782
16104
15674
15105
14223
14385
14558
13804
14672
14244
15089
14580
15218
15696
15129
15110
14204
13655
14534
12746
14074
13699
14184
14110
15820
15362
14993
14437
13694
13688


Summary of computational transaction
Raw Inputview raw input (R code)
Raw Outputview raw output of R engine
Computing time1 seconds
R Server'Gertrude Mary Cox' @ cox.wessa.net

\begin{tabular}{lllllllll}
\hline
Summary of computational transaction \tabularnewline
Raw Input & view raw input (R code)  \tabularnewline
Raw Output & view raw output of R engine  \tabularnewline
Computing time & 1 seconds \tabularnewline
R Server & 'Gertrude Mary Cox' @ cox.wessa.net \tabularnewline
\hline
\end{tabular}
%Source: https://freestatistics.org/blog/index.php?pk=277833&T=0

[TABLE]
[ROW][C]Summary of computational transaction[/C][/ROW]
[ROW][C]Raw Input[/C][C]view raw input (R code) [/C][/ROW]
[ROW][C]Raw Output[/C][C]view raw output of R engine [/C][/ROW]
[ROW][C]Computing time[/C][C]1 seconds[/C][/ROW]
[ROW][C]R Server[/C][C]'Gertrude Mary Cox' @ cox.wessa.net[/C][/ROW]
[/TABLE]
Source: https://freestatistics.org/blog/index.php?pk=277833&T=0

Globally Unique Identifier (entire table): ba.freestatistics.org/blog/index.php?pk=277833&T=0

As an alternative you can also use a QR Code:  

The GUIDs for individual cells are displayed in the table below:

Summary of computational transaction
Raw Inputview raw input (R code)
Raw Outputview raw output of R engine
Computing time1 seconds
R Server'Gertrude Mary Cox' @ cox.wessa.net


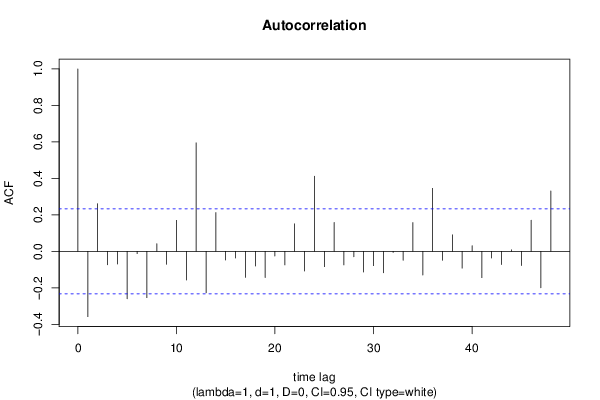
Autocorrelation Function
Time lag kACF(k)T-STATP-value
1-0.358111-3.01750.001768
20.2610842.19990.015534
3-0.073672-0.62080.26837
4-0.069783-0.5880.279198
5-0.259634-2.18770.015992
6-0.012799-0.10780.457211
7-0.253689-2.13760.017996
80.0416880.35130.363214
9-0.070832-0.59680.276256
100.1698021.43080.07844
11-0.157074-1.32350.094953
120.5948045.01192e-06
13-0.227181-1.91430.029809
140.2123981.78970.038884
15-0.047838-0.40310.344048
16-0.03689-0.31080.378415
17-0.143018-1.20510.116085
18-0.080196-0.67570.250699
19-0.143205-1.20670.115783
20-0.026039-0.21940.413481
21-0.074488-0.62760.266125
220.1508211.27080.103967
23-0.107556-0.90630.183925
240.4117373.46940.000445
25-0.083968-0.70750.240779
260.1580191.33150.093643
27-0.074252-0.62570.266773
28-0.029541-0.24890.402072
29-0.113386-0.95540.171307
30-0.078495-0.66140.255246
31-0.117615-0.9910.162515
32-0.005622-0.04740.481174
33-0.04895-0.41250.340624
340.1573551.32590.094562
35-0.129671-1.09260.139125
360.3453132.90970.002414
37-0.049129-0.4140.340072
380.090370.76150.224449
39-0.092112-0.77620.220119
400.0309060.26040.397648
41-0.144107-1.21430.114334
42-0.036346-0.30630.380153
43-0.071794-0.60490.273571
440.0082410.06940.472419
45-0.078005-0.65730.256562
460.1703671.43550.077762
47-0.200097-1.6860.048089
480.3305562.78530.003426

\begin{tabular}{lllllllll}
\hline
Autocorrelation Function \tabularnewline
Time lag k & ACF(k) & T-STAT & P-value \tabularnewline
1 & -0.358111 & -3.0175 & 0.001768 \tabularnewline
2 & 0.261084 & 2.1999 & 0.015534 \tabularnewline
3 & -0.073672 & -0.6208 & 0.26837 \tabularnewline
4 & -0.069783 & -0.588 & 0.279198 \tabularnewline
5 & -0.259634 & -2.1877 & 0.015992 \tabularnewline
6 & -0.012799 & -0.1078 & 0.457211 \tabularnewline
7 & -0.253689 & -2.1376 & 0.017996 \tabularnewline
8 & 0.041688 & 0.3513 & 0.363214 \tabularnewline
9 & -0.070832 & -0.5968 & 0.276256 \tabularnewline
10 & 0.169802 & 1.4308 & 0.07844 \tabularnewline
11 & -0.157074 & -1.3235 & 0.094953 \tabularnewline
12 & 0.594804 & 5.0119 & 2e-06 \tabularnewline
13 & -0.227181 & -1.9143 & 0.029809 \tabularnewline
14 & 0.212398 & 1.7897 & 0.038884 \tabularnewline
15 & -0.047838 & -0.4031 & 0.344048 \tabularnewline
16 & -0.03689 & -0.3108 & 0.378415 \tabularnewline
17 & -0.143018 & -1.2051 & 0.116085 \tabularnewline
18 & -0.080196 & -0.6757 & 0.250699 \tabularnewline
19 & -0.143205 & -1.2067 & 0.115783 \tabularnewline
20 & -0.026039 & -0.2194 & 0.413481 \tabularnewline
21 & -0.074488 & -0.6276 & 0.266125 \tabularnewline
22 & 0.150821 & 1.2708 & 0.103967 \tabularnewline
23 & -0.107556 & -0.9063 & 0.183925 \tabularnewline
24 & 0.411737 & 3.4694 & 0.000445 \tabularnewline
25 & -0.083968 & -0.7075 & 0.240779 \tabularnewline
26 & 0.158019 & 1.3315 & 0.093643 \tabularnewline
27 & -0.074252 & -0.6257 & 0.266773 \tabularnewline
28 & -0.029541 & -0.2489 & 0.402072 \tabularnewline
29 & -0.113386 & -0.9554 & 0.171307 \tabularnewline
30 & -0.078495 & -0.6614 & 0.255246 \tabularnewline
31 & -0.117615 & -0.991 & 0.162515 \tabularnewline
32 & -0.005622 & -0.0474 & 0.481174 \tabularnewline
33 & -0.04895 & -0.4125 & 0.340624 \tabularnewline
34 & 0.157355 & 1.3259 & 0.094562 \tabularnewline
35 & -0.129671 & -1.0926 & 0.139125 \tabularnewline
36 & 0.345313 & 2.9097 & 0.002414 \tabularnewline
37 & -0.049129 & -0.414 & 0.340072 \tabularnewline
38 & 0.09037 & 0.7615 & 0.224449 \tabularnewline
39 & -0.092112 & -0.7762 & 0.220119 \tabularnewline
40 & 0.030906 & 0.2604 & 0.397648 \tabularnewline
41 & -0.144107 & -1.2143 & 0.114334 \tabularnewline
42 & -0.036346 & -0.3063 & 0.380153 \tabularnewline
43 & -0.071794 & -0.6049 & 0.273571 \tabularnewline
44 & 0.008241 & 0.0694 & 0.472419 \tabularnewline
45 & -0.078005 & -0.6573 & 0.256562 \tabularnewline
46 & 0.170367 & 1.4355 & 0.077762 \tabularnewline
47 & -0.200097 & -1.686 & 0.048089 \tabularnewline
48 & 0.330556 & 2.7853 & 0.003426 \tabularnewline
\hline
\end{tabular}
%Source: https://freestatistics.org/blog/index.php?pk=277833&T=1

[TABLE]
[ROW][C]Autocorrelation Function[/C][/ROW]
[ROW][C]Time lag k[/C][C]ACF(k)[/C][C]T-STAT[/C][C]P-value[/C][/ROW]
[ROW][C]1[/C][C]-0.358111[/C][C]-3.0175[/C][C]0.001768[/C][/ROW]
[ROW][C]2[/C][C]0.261084[/C][C]2.1999[/C][C]0.015534[/C][/ROW]
[ROW][C]3[/C][C]-0.073672[/C][C]-0.6208[/C][C]0.26837[/C][/ROW]
[ROW][C]4[/C][C]-0.069783[/C][C]-0.588[/C][C]0.279198[/C][/ROW]
[ROW][C]5[/C][C]-0.259634[/C][C]-2.1877[/C][C]0.015992[/C][/ROW]
[ROW][C]6[/C][C]-0.012799[/C][C]-0.1078[/C][C]0.457211[/C][/ROW]
[ROW][C]7[/C][C]-0.253689[/C][C]-2.1376[/C][C]0.017996[/C][/ROW]
[ROW][C]8[/C][C]0.041688[/C][C]0.3513[/C][C]0.363214[/C][/ROW]
[ROW][C]9[/C][C]-0.070832[/C][C]-0.5968[/C][C]0.276256[/C][/ROW]
[ROW][C]10[/C][C]0.169802[/C][C]1.4308[/C][C]0.07844[/C][/ROW]
[ROW][C]11[/C][C]-0.157074[/C][C]-1.3235[/C][C]0.094953[/C][/ROW]
[ROW][C]12[/C][C]0.594804[/C][C]5.0119[/C][C]2e-06[/C][/ROW]
[ROW][C]13[/C][C]-0.227181[/C][C]-1.9143[/C][C]0.029809[/C][/ROW]
[ROW][C]14[/C][C]0.212398[/C][C]1.7897[/C][C]0.038884[/C][/ROW]
[ROW][C]15[/C][C]-0.047838[/C][C]-0.4031[/C][C]0.344048[/C][/ROW]
[ROW][C]16[/C][C]-0.03689[/C][C]-0.3108[/C][C]0.378415[/C][/ROW]
[ROW][C]17[/C][C]-0.143018[/C][C]-1.2051[/C][C]0.116085[/C][/ROW]
[ROW][C]18[/C][C]-0.080196[/C][C]-0.6757[/C][C]0.250699[/C][/ROW]
[ROW][C]19[/C][C]-0.143205[/C][C]-1.2067[/C][C]0.115783[/C][/ROW]
[ROW][C]20[/C][C]-0.026039[/C][C]-0.2194[/C][C]0.413481[/C][/ROW]
[ROW][C]21[/C][C]-0.074488[/C][C]-0.6276[/C][C]0.266125[/C][/ROW]
[ROW][C]22[/C][C]0.150821[/C][C]1.2708[/C][C]0.103967[/C][/ROW]
[ROW][C]23[/C][C]-0.107556[/C][C]-0.9063[/C][C]0.183925[/C][/ROW]
[ROW][C]24[/C][C]0.411737[/C][C]3.4694[/C][C]0.000445[/C][/ROW]
[ROW][C]25[/C][C]-0.083968[/C][C]-0.7075[/C][C]0.240779[/C][/ROW]
[ROW][C]26[/C][C]0.158019[/C][C]1.3315[/C][C]0.093643[/C][/ROW]
[ROW][C]27[/C][C]-0.074252[/C][C]-0.6257[/C][C]0.266773[/C][/ROW]
[ROW][C]28[/C][C]-0.029541[/C][C]-0.2489[/C][C]0.402072[/C][/ROW]
[ROW][C]29[/C][C]-0.113386[/C][C]-0.9554[/C][C]0.171307[/C][/ROW]
[ROW][C]30[/C][C]-0.078495[/C][C]-0.6614[/C][C]0.255246[/C][/ROW]
[ROW][C]31[/C][C]-0.117615[/C][C]-0.991[/C][C]0.162515[/C][/ROW]
[ROW][C]32[/C][C]-0.005622[/C][C]-0.0474[/C][C]0.481174[/C][/ROW]
[ROW][C]33[/C][C]-0.04895[/C][C]-0.4125[/C][C]0.340624[/C][/ROW]
[ROW][C]34[/C][C]0.157355[/C][C]1.3259[/C][C]0.094562[/C][/ROW]
[ROW][C]35[/C][C]-0.129671[/C][C]-1.0926[/C][C]0.139125[/C][/ROW]
[ROW][C]36[/C][C]0.345313[/C][C]2.9097[/C][C]0.002414[/C][/ROW]
[ROW][C]37[/C][C]-0.049129[/C][C]-0.414[/C][C]0.340072[/C][/ROW]
[ROW][C]38[/C][C]0.09037[/C][C]0.7615[/C][C]0.224449[/C][/ROW]
[ROW][C]39[/C][C]-0.092112[/C][C]-0.7762[/C][C]0.220119[/C][/ROW]
[ROW][C]40[/C][C]0.030906[/C][C]0.2604[/C][C]0.397648[/C][/ROW]
[ROW][C]41[/C][C]-0.144107[/C][C]-1.2143[/C][C]0.114334[/C][/ROW]
[ROW][C]42[/C][C]-0.036346[/C][C]-0.3063[/C][C]0.380153[/C][/ROW]
[ROW][C]43[/C][C]-0.071794[/C][C]-0.6049[/C][C]0.273571[/C][/ROW]
[ROW][C]44[/C][C]0.008241[/C][C]0.0694[/C][C]0.472419[/C][/ROW]
[ROW][C]45[/C][C]-0.078005[/C][C]-0.6573[/C][C]0.256562[/C][/ROW]
[ROW][C]46[/C][C]0.170367[/C][C]1.4355[/C][C]0.077762[/C][/ROW]
[ROW][C]47[/C][C]-0.200097[/C][C]-1.686[/C][C]0.048089[/C][/ROW]
[ROW][C]48[/C][C]0.330556[/C][C]2.7853[/C][C]0.003426[/C][/ROW]
[/TABLE]
Source: https://freestatistics.org/blog/index.php?pk=277833&T=1

Globally Unique Identifier (entire table): ba.freestatistics.org/blog/index.php?pk=277833&T=1

As an alternative you can also use a QR Code:  

The GUIDs for individual cells are displayed in the table below:

Autocorrelation Function
Time lag kACF(k)T-STATP-value
1-0.358111-3.01750.001768
20.2610842.19990.015534
3-0.073672-0.62080.26837
4-0.069783-0.5880.279198
5-0.259634-2.18770.015992
6-0.012799-0.10780.457211
7-0.253689-2.13760.017996
80.0416880.35130.363214
9-0.070832-0.59680.276256
100.1698021.43080.07844
11-0.157074-1.32350.094953
120.5948045.01192e-06
13-0.227181-1.91430.029809
140.2123981.78970.038884
15-0.047838-0.40310.344048
16-0.03689-0.31080.378415
17-0.143018-1.20510.116085
18-0.080196-0.67570.250699
19-0.143205-1.20670.115783
20-0.026039-0.21940.413481
21-0.074488-0.62760.266125
220.1508211.27080.103967
23-0.107556-0.90630.183925
240.4117373.46940.000445
25-0.083968-0.70750.240779
260.1580191.33150.093643
27-0.074252-0.62570.266773
28-0.029541-0.24890.402072
29-0.113386-0.95540.171307
30-0.078495-0.66140.255246
31-0.117615-0.9910.162515
32-0.005622-0.04740.481174
33-0.04895-0.41250.340624
340.1573551.32590.094562
35-0.129671-1.09260.139125
360.3453132.90970.002414
37-0.049129-0.4140.340072
380.090370.76150.224449
39-0.092112-0.77620.220119
400.0309060.26040.397648
41-0.144107-1.21430.114334
42-0.036346-0.30630.380153
43-0.071794-0.60490.273571
440.0082410.06940.472419
45-0.078005-0.65730.256562
460.1703671.43550.077762
47-0.200097-1.6860.048089
480.3305562.78530.003426


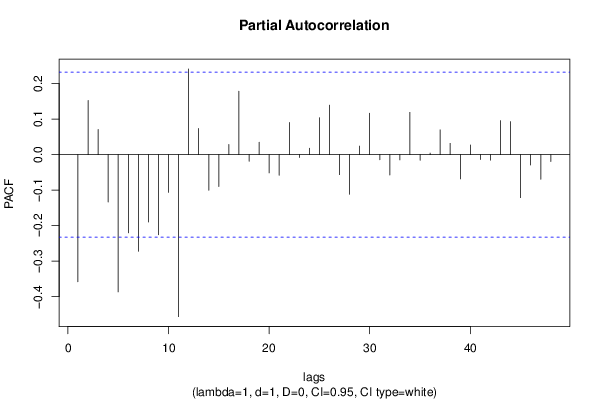
Partial Autocorrelation Function
Time lag kPACF(k)T-STATP-value
1-0.358111-3.01750.001768
20.1523821.2840.101659
30.0706360.59520.276804
4-0.1334-1.1240.132389
5-0.386526-3.25690.000864
6-0.22027-1.8560.0338
7-0.272226-2.29380.012382
8-0.18955-1.59720.057334
9-0.225539-1.90040.030719
10-0.106281-0.89550.186763
11-0.456285-3.84470.00013
120.2413442.03360.022865
130.0738720.62250.267818
14-0.100184-0.84420.200706
15-0.089674-0.75560.226192
160.0284490.23970.405621
170.1787621.50630.068217
18-0.018465-0.15560.438401
190.0348780.29390.384851
20-0.051478-0.43380.332888
21-0.058286-0.49110.312424
220.0906440.76380.223764
23-0.007905-0.06660.473541
240.0182190.15350.439214
250.1038580.87510.19223
260.1393741.17440.122082
27-0.056418-0.47540.317984
28-0.111356-0.93830.175635
290.0239630.20190.420281
300.1166570.9830.16448
31-0.014665-0.12360.451004
32-0.057557-0.4850.314592
33-0.014828-0.12490.450459
340.119171.00410.15936
35-0.016035-0.13510.446454
360.0043010.03620.485594
370.0697210.58750.279372
380.0317740.26770.394841
39-0.068363-0.5760.283205
400.0274040.23090.409024
41-0.013546-0.11410.454723
42-0.015578-0.13130.44797
430.0958940.8080.21089
440.0929490.78320.218055
45-0.121141-1.02080.155419
46-0.029379-0.24760.402596
47-0.069469-0.58540.280083
48-0.019478-0.16410.435051

\begin{tabular}{lllllllll}
\hline
Partial Autocorrelation Function \tabularnewline
Time lag k & PACF(k) & T-STAT & P-value \tabularnewline
1 & -0.358111 & -3.0175 & 0.001768 \tabularnewline
2 & 0.152382 & 1.284 & 0.101659 \tabularnewline
3 & 0.070636 & 0.5952 & 0.276804 \tabularnewline
4 & -0.1334 & -1.124 & 0.132389 \tabularnewline
5 & -0.386526 & -3.2569 & 0.000864 \tabularnewline
6 & -0.22027 & -1.856 & 0.0338 \tabularnewline
7 & -0.272226 & -2.2938 & 0.012382 \tabularnewline
8 & -0.18955 & -1.5972 & 0.057334 \tabularnewline
9 & -0.225539 & -1.9004 & 0.030719 \tabularnewline
10 & -0.106281 & -0.8955 & 0.186763 \tabularnewline
11 & -0.456285 & -3.8447 & 0.00013 \tabularnewline
12 & 0.241344 & 2.0336 & 0.022865 \tabularnewline
13 & 0.073872 & 0.6225 & 0.267818 \tabularnewline
14 & -0.100184 & -0.8442 & 0.200706 \tabularnewline
15 & -0.089674 & -0.7556 & 0.226192 \tabularnewline
16 & 0.028449 & 0.2397 & 0.405621 \tabularnewline
17 & 0.178762 & 1.5063 & 0.068217 \tabularnewline
18 & -0.018465 & -0.1556 & 0.438401 \tabularnewline
19 & 0.034878 & 0.2939 & 0.384851 \tabularnewline
20 & -0.051478 & -0.4338 & 0.332888 \tabularnewline
21 & -0.058286 & -0.4911 & 0.312424 \tabularnewline
22 & 0.090644 & 0.7638 & 0.223764 \tabularnewline
23 & -0.007905 & -0.0666 & 0.473541 \tabularnewline
24 & 0.018219 & 0.1535 & 0.439214 \tabularnewline
25 & 0.103858 & 0.8751 & 0.19223 \tabularnewline
26 & 0.139374 & 1.1744 & 0.122082 \tabularnewline
27 & -0.056418 & -0.4754 & 0.317984 \tabularnewline
28 & -0.111356 & -0.9383 & 0.175635 \tabularnewline
29 & 0.023963 & 0.2019 & 0.420281 \tabularnewline
30 & 0.116657 & 0.983 & 0.16448 \tabularnewline
31 & -0.014665 & -0.1236 & 0.451004 \tabularnewline
32 & -0.057557 & -0.485 & 0.314592 \tabularnewline
33 & -0.014828 & -0.1249 & 0.450459 \tabularnewline
34 & 0.11917 & 1.0041 & 0.15936 \tabularnewline
35 & -0.016035 & -0.1351 & 0.446454 \tabularnewline
36 & 0.004301 & 0.0362 & 0.485594 \tabularnewline
37 & 0.069721 & 0.5875 & 0.279372 \tabularnewline
38 & 0.031774 & 0.2677 & 0.394841 \tabularnewline
39 & -0.068363 & -0.576 & 0.283205 \tabularnewline
40 & 0.027404 & 0.2309 & 0.409024 \tabularnewline
41 & -0.013546 & -0.1141 & 0.454723 \tabularnewline
42 & -0.015578 & -0.1313 & 0.44797 \tabularnewline
43 & 0.095894 & 0.808 & 0.21089 \tabularnewline
44 & 0.092949 & 0.7832 & 0.218055 \tabularnewline
45 & -0.121141 & -1.0208 & 0.155419 \tabularnewline
46 & -0.029379 & -0.2476 & 0.402596 \tabularnewline
47 & -0.069469 & -0.5854 & 0.280083 \tabularnewline
48 & -0.019478 & -0.1641 & 0.435051 \tabularnewline
\hline
\end{tabular}
%Source: https://freestatistics.org/blog/index.php?pk=277833&T=2

[TABLE]
[ROW][C]Partial Autocorrelation Function[/C][/ROW]
[ROW][C]Time lag k[/C][C]PACF(k)[/C][C]T-STAT[/C][C]P-value[/C][/ROW]
[ROW][C]1[/C][C]-0.358111[/C][C]-3.0175[/C][C]0.001768[/C][/ROW]
[ROW][C]2[/C][C]0.152382[/C][C]1.284[/C][C]0.101659[/C][/ROW]
[ROW][C]3[/C][C]0.070636[/C][C]0.5952[/C][C]0.276804[/C][/ROW]
[ROW][C]4[/C][C]-0.1334[/C][C]-1.124[/C][C]0.132389[/C][/ROW]
[ROW][C]5[/C][C]-0.386526[/C][C]-3.2569[/C][C]0.000864[/C][/ROW]
[ROW][C]6[/C][C]-0.22027[/C][C]-1.856[/C][C]0.0338[/C][/ROW]
[ROW][C]7[/C][C]-0.272226[/C][C]-2.2938[/C][C]0.012382[/C][/ROW]
[ROW][C]8[/C][C]-0.18955[/C][C]-1.5972[/C][C]0.057334[/C][/ROW]
[ROW][C]9[/C][C]-0.225539[/C][C]-1.9004[/C][C]0.030719[/C][/ROW]
[ROW][C]10[/C][C]-0.106281[/C][C]-0.8955[/C][C]0.186763[/C][/ROW]
[ROW][C]11[/C][C]-0.456285[/C][C]-3.8447[/C][C]0.00013[/C][/ROW]
[ROW][C]12[/C][C]0.241344[/C][C]2.0336[/C][C]0.022865[/C][/ROW]
[ROW][C]13[/C][C]0.073872[/C][C]0.6225[/C][C]0.267818[/C][/ROW]
[ROW][C]14[/C][C]-0.100184[/C][C]-0.8442[/C][C]0.200706[/C][/ROW]
[ROW][C]15[/C][C]-0.089674[/C][C]-0.7556[/C][C]0.226192[/C][/ROW]
[ROW][C]16[/C][C]0.028449[/C][C]0.2397[/C][C]0.405621[/C][/ROW]
[ROW][C]17[/C][C]0.178762[/C][C]1.5063[/C][C]0.068217[/C][/ROW]
[ROW][C]18[/C][C]-0.018465[/C][C]-0.1556[/C][C]0.438401[/C][/ROW]
[ROW][C]19[/C][C]0.034878[/C][C]0.2939[/C][C]0.384851[/C][/ROW]
[ROW][C]20[/C][C]-0.051478[/C][C]-0.4338[/C][C]0.332888[/C][/ROW]
[ROW][C]21[/C][C]-0.058286[/C][C]-0.4911[/C][C]0.312424[/C][/ROW]
[ROW][C]22[/C][C]0.090644[/C][C]0.7638[/C][C]0.223764[/C][/ROW]
[ROW][C]23[/C][C]-0.007905[/C][C]-0.0666[/C][C]0.473541[/C][/ROW]
[ROW][C]24[/C][C]0.018219[/C][C]0.1535[/C][C]0.439214[/C][/ROW]
[ROW][C]25[/C][C]0.103858[/C][C]0.8751[/C][C]0.19223[/C][/ROW]
[ROW][C]26[/C][C]0.139374[/C][C]1.1744[/C][C]0.122082[/C][/ROW]
[ROW][C]27[/C][C]-0.056418[/C][C]-0.4754[/C][C]0.317984[/C][/ROW]
[ROW][C]28[/C][C]-0.111356[/C][C]-0.9383[/C][C]0.175635[/C][/ROW]
[ROW][C]29[/C][C]0.023963[/C][C]0.2019[/C][C]0.420281[/C][/ROW]
[ROW][C]30[/C][C]0.116657[/C][C]0.983[/C][C]0.16448[/C][/ROW]
[ROW][C]31[/C][C]-0.014665[/C][C]-0.1236[/C][C]0.451004[/C][/ROW]
[ROW][C]32[/C][C]-0.057557[/C][C]-0.485[/C][C]0.314592[/C][/ROW]
[ROW][C]33[/C][C]-0.014828[/C][C]-0.1249[/C][C]0.450459[/C][/ROW]
[ROW][C]34[/C][C]0.11917[/C][C]1.0041[/C][C]0.15936[/C][/ROW]
[ROW][C]35[/C][C]-0.016035[/C][C]-0.1351[/C][C]0.446454[/C][/ROW]
[ROW][C]36[/C][C]0.004301[/C][C]0.0362[/C][C]0.485594[/C][/ROW]
[ROW][C]37[/C][C]0.069721[/C][C]0.5875[/C][C]0.279372[/C][/ROW]
[ROW][C]38[/C][C]0.031774[/C][C]0.2677[/C][C]0.394841[/C][/ROW]
[ROW][C]39[/C][C]-0.068363[/C][C]-0.576[/C][C]0.283205[/C][/ROW]
[ROW][C]40[/C][C]0.027404[/C][C]0.2309[/C][C]0.409024[/C][/ROW]
[ROW][C]41[/C][C]-0.013546[/C][C]-0.1141[/C][C]0.454723[/C][/ROW]
[ROW][C]42[/C][C]-0.015578[/C][C]-0.1313[/C][C]0.44797[/C][/ROW]
[ROW][C]43[/C][C]0.095894[/C][C]0.808[/C][C]0.21089[/C][/ROW]
[ROW][C]44[/C][C]0.092949[/C][C]0.7832[/C][C]0.218055[/C][/ROW]
[ROW][C]45[/C][C]-0.121141[/C][C]-1.0208[/C][C]0.155419[/C][/ROW]
[ROW][C]46[/C][C]-0.029379[/C][C]-0.2476[/C][C]0.402596[/C][/ROW]
[ROW][C]47[/C][C]-0.069469[/C][C]-0.5854[/C][C]0.280083[/C][/ROW]
[ROW][C]48[/C][C]-0.019478[/C][C]-0.1641[/C][C]0.435051[/C][/ROW]
[/TABLE]
Source: https://freestatistics.org/blog/index.php?pk=277833&T=2

Globally Unique Identifier (entire table): ba.freestatistics.org/blog/index.php?pk=277833&T=2

As an alternative you can also use a QR Code:  

The GUIDs for individual cells are displayed in the table below:

Partial Autocorrelation Function
Time lag kPACF(k)T-STATP-value
1-0.358111-3.01750.001768
20.1523821.2840.101659
30.0706360.59520.276804
4-0.1334-1.1240.132389
5-0.386526-3.25690.000864
6-0.22027-1.8560.0338
7-0.272226-2.29380.012382
8-0.18955-1.59720.057334
9-0.225539-1.90040.030719
10-0.106281-0.89550.186763
11-0.456285-3.84470.00013
120.2413442.03360.022865
130.0738720.62250.267818
14-0.100184-0.84420.200706
15-0.089674-0.75560.226192
160.0284490.23970.405621
170.1787621.50630.068217
18-0.018465-0.15560.438401
190.0348780.29390.384851
20-0.051478-0.43380.332888
21-0.058286-0.49110.312424
220.0906440.76380.223764
23-0.007905-0.06660.473541
240.0182190.15350.439214
250.1038580.87510.19223
260.1393741.17440.122082
27-0.056418-0.47540.317984
28-0.111356-0.93830.175635
290.0239630.20190.420281
300.1166570.9830.16448
31-0.014665-0.12360.451004
32-0.057557-0.4850.314592
33-0.014828-0.12490.450459
340.119171.00410.15936
35-0.016035-0.13510.446454
360.0043010.03620.485594
370.0697210.58750.279372
380.0317740.26770.394841
39-0.068363-0.5760.283205
400.0274040.23090.409024
41-0.013546-0.11410.454723
42-0.015578-0.13130.44797
430.0958940.8080.21089
440.0929490.78320.218055
45-0.121141-1.02080.155419
46-0.029379-0.24760.402596
47-0.069469-0.58540.280083
48-0.019478-0.16410.435051


Parameters (Session):
par1 = 48 ; par2 = 1 ; par3 = 1 ; par4 = 0 ; par5 = 12 ; par6 = White Noise ; par7 = 0.95 ;
Parameters (R input):
par1 = 48 ; par2 = 1 ; par3 = 1 ; par4 = 0 ; par5 = 12 ; par6 = White Noise ; par7 = 0.95 ; par8 = ;
R code (references can be found in the software module):
par8 <- ''
par7 <- '0.95'
par6 <- 'White Noise'
par5 <- '12'
par4 <- '0'
par3 <- '1'
par2 <- '1'
par1 <- '48'
if (par1 == 'Default') {
par1 = 10*log10(length(x))
} else {
par1 <- as.numeric(par1)
}
par2 <- as.numeric(par2)
par3 <- as.numeric(par3)
par4 <- as.numeric(par4)
par5 <- as.numeric(par5)
if (par6 == 'White Noise') par6 <- 'white' else par6 <- 'ma'
par7 <- as.numeric(par7)
if (par8 != '') par8 <- as.numeric(par8)
ox <- x
if (par8 == '') {
if (par2 == 0) {
x <- log(x)
} else {
x <- (x ^ par2 - 1) / par2
}
} else {
x <- log(x,base=par8)
}
if (par3 > 0) x <- diff(x,lag=1,difference=par3)
if (par4 > 0) x <- diff(x,lag=par5,difference=par4)
bitmap(file='picts.png')
op <- par(mfrow=c(2,1))
plot(ox,type='l',main='Original Time Series',xlab='time',ylab='value')
if (par8=='') {
mytitle <- paste('Working Time Series (lambda=',par2,', d=',par3,', D=',par4,')',sep='')
mysub <- paste('(lambda=',par2,', d=',par3,', D=',par4,', CI=', par7, ', CI type=',par6,')',sep='')
} else {
mytitle <- paste('Working Time Series (base=',par8,', d=',par3,', D=',par4,')',sep='')
mysub <- paste('(base=',par8,', d=',par3,', D=',par4,', CI=', par7, ', CI type=',par6,')',sep='')
}
plot(x,type='l', main=mytitle,xlab='time',ylab='value')
par(op)
dev.off()
bitmap(file='pic1.png')
racf <- acf(x, par1, main='Autocorrelation', xlab='time lag', ylab='ACF', ci.type=par6, ci=par7, sub=mysub)
dev.off()
bitmap(file='pic2.png')
rpacf <- pacf(x,par1,main='Partial Autocorrelation',xlab='lags',ylab='PACF',sub=mysub)
dev.off()
(myacf <- c(racf$acf))
(mypacf <- c(rpacf$acf))
lengthx <- length(x)
sqrtn <- sqrt(lengthx)
load(file='createtable')
a<-table.start()
a<-table.row.start(a)
a<-table.element(a,'Autocorrelation Function',4,TRUE)
a<-table.row.end(a)
a<-table.row.start(a)
a<-table.element(a,'Time lag k',header=TRUE)
a<-table.element(a,hyperlink('basics.htm','ACF(k)','click here for more information about the Autocorrelation Function'),header=TRUE)
a<-table.element(a,'T-STAT',header=TRUE)
a<-table.element(a,'P-value',header=TRUE)
a<-table.row.end(a)
for (i in 2:(par1+1)) {
a<-table.row.start(a)
a<-table.element(a,i-1,header=TRUE)
a<-table.element(a,round(myacf[i],6))
mytstat <- myacf[i]*sqrtn
a<-table.element(a,round(mytstat,4))
a<-table.element(a,round(1-pt(abs(mytstat),lengthx),6))
a<-table.row.end(a)
}
a<-table.end(a)
table.save(a,file='mytable.tab')
a<-table.start()
a<-table.row.start(a)
a<-table.element(a,'Partial Autocorrelation Function',4,TRUE)
a<-table.row.end(a)
a<-table.row.start(a)
a<-table.element(a,'Time lag k',header=TRUE)
a<-table.element(a,hyperlink('basics.htm','PACF(k)','click here for more information about the Partial Autocorrelation Function'),header=TRUE)
a<-table.element(a,'T-STAT',header=TRUE)
a<-table.element(a,'P-value',header=TRUE)
a<-table.row.end(a)
for (i in 1:par1) {
a<-table.row.start(a)
a<-table.element(a,i,header=TRUE)
a<-table.element(a,round(mypacf[i],6))
mytstat <- mypacf[i]*sqrtn
a<-table.element(a,round(mytstat,4))
a<-table.element(a,round(1-pt(abs(mytstat),lengthx),6))
a<-table.row.end(a)
}
a<-table.end(a)
table.save(a,file='mytable1.tab')