Free Statistics

of Irreproducible Research!

Author's title

Author*Unverified author*
R Software Modulerwasp_autocorrelation.wasp
Title produced by software(Partial) Autocorrelation Function
Date of computationWed, 04 Mar 2015 15:03:14 +0000
Cite this page as followsStatistical Computations at FreeStatistics.org, Office for Research Development and Education, URL https://freestatistics.org/blog/index.php?v=date/2015/Mar/04/t1425481451f6gc9v7w117ddef.htm/, Retrieved Tue, 21 May 2024 18:35:28 +0000
Statistical Computations at FreeStatistics.org, Office for Research Development and Education, URL https://freestatistics.org/blog/index.php?pk=277880, Retrieved Tue, 21 May 2024 18:35:28 +0000
QR Codes:

Original text written by user:
IsPrivate?No (this computation is public)
User-defined keywords
Estimated Impact152
Family? (F = Feedback message, R = changed R code, M = changed R Module, P = changed Parameters, D = changed Data)
-       [(Partial) Autocorrelation Function] [] [2015-03-04 15:03:14] [8e46ac5a02f6c72569c3bd9e9d260f29] [Current]
Feedback Forum

Post a new message
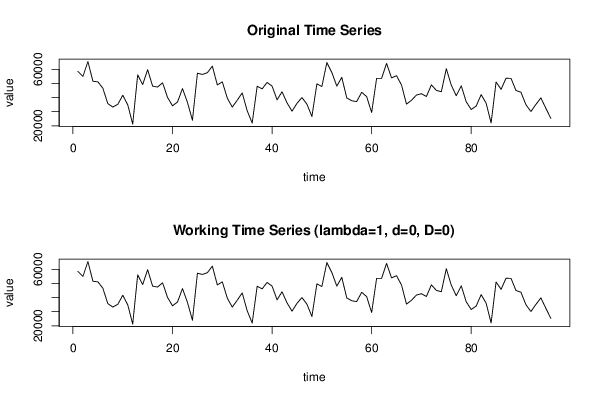
Dataseries X:
58552
54955
65540
51570
51145
46641
35704
33253
35193
41668
34865
21210
56126
49231
59723
48103
47472
50497
40059
34149
36860
46356
36577
23872
57276
56389
57657
62300
48929
51168
39636
33213
38127
43291
30600
21956
48033
46148
50736
48114
38390
44112
36287
30333
35908
40005
35263
26591
49709
47840
64781
57802
48154
54353
39737
37732
37163
43782
40649
29412
53597
53588
64172
53955
55509
48908
35331
38073
41776
42717
40736
49020
45099
44114
60487
48760
41281
48346
37025
31514
33977
42060
36036
22012
51048
45834
53712
53577
45022
43740
34898
30103
35137
39752
32348
25198


Summary of computational transaction
Raw Inputview raw input (R code)
Raw Outputview raw output of R engine
Computing time1 seconds
R Server'Herman Ole Andreas Wold' @ wold.wessa.net

\begin{tabular}{lllllllll}
\hline
Summary of computational transaction \tabularnewline
Raw Input & view raw input (R code)  \tabularnewline
Raw Output & view raw output of R engine  \tabularnewline
Computing time & 1 seconds \tabularnewline
R Server & 'Herman Ole Andreas Wold' @ wold.wessa.net \tabularnewline
\hline
\end{tabular}
%Source: https://freestatistics.org/blog/index.php?pk=277880&T=0

[TABLE]
[ROW][C]Summary of computational transaction[/C][/ROW]
[ROW][C]Raw Input[/C][C]view raw input (R code) [/C][/ROW]
[ROW][C]Raw Output[/C][C]view raw output of R engine [/C][/ROW]
[ROW][C]Computing time[/C][C]1 seconds[/C][/ROW]
[ROW][C]R Server[/C][C]'Herman Ole Andreas Wold' @ wold.wessa.net[/C][/ROW]
[/TABLE]
Source: https://freestatistics.org/blog/index.php?pk=277880&T=0

Globally Unique Identifier (entire table): ba.freestatistics.org/blog/index.php?pk=277880&T=0

As an alternative you can also use a QR Code:  

The GUIDs for individual cells are displayed in the table below:

Summary of computational transaction
Raw Inputview raw input (R code)
Raw Outputview raw output of R engine
Computing time1 seconds
R Server'Herman Ole Andreas Wold' @ wold.wessa.net


Autocorrelation Function
Time lag kACF(k)T-STATP-value
10.4444874.35511.7e-05
20.2252982.20750.014832
30.079760.78150.21822
4-0.142497-1.39620.08294
5-0.288515-2.82690.00286
6-0.464772-4.55388e-06
7-0.289636-2.83780.002771
8-0.229369-2.24730.013454
9-0.079775-0.78160.218176
100.1063311.04180.150053
110.2716412.66150.00456
120.6631986.4980
130.3210443.14560.001104
140.1233791.20890.114842
15-0.032077-0.31430.376991
16-0.197121-1.93140.028193
17-0.276539-2.70950.00399
18-0.448181-4.39131.5e-05
19-0.316726-3.10330.001257
20-0.217978-2.13570.017622
21-0.104491-1.02380.154251
220.0484240.47450.318125
230.2337652.29040.012093
240.5539235.42730
250.2934192.87490.002489
260.1360411.33290.092856
27-0.0373-0.36550.357784
28-0.185788-1.82030.035911
29-0.232273-2.27580.01254
30-0.398133-3.90098.9e-05
31-0.269741-2.64290.0048
32-0.171011-1.67560.04854
33-0.075496-0.73970.230643
340.0453180.4440.329012
350.1895691.85740.033161
360.4675254.58087e-06
370.224332.1980.015178
380.1082151.06030.145837
39-0.053266-0.52190.30147
40-0.17003-1.66590.049492
41-0.209644-2.05410.021343
42-0.320247-3.13780.001131
43-0.198552-1.94540.027326
44-0.123633-1.21140.114367
45-0.046774-0.45830.323889
460.0595890.58390.280344
470.1731591.69660.046506
480.4001033.92028.3e-05

\begin{tabular}{lllllllll}
\hline
Autocorrelation Function \tabularnewline
Time lag k & ACF(k) & T-STAT & P-value \tabularnewline
1 & 0.444487 & 4.3551 & 1.7e-05 \tabularnewline
2 & 0.225298 & 2.2075 & 0.014832 \tabularnewline
3 & 0.07976 & 0.7815 & 0.21822 \tabularnewline
4 & -0.142497 & -1.3962 & 0.08294 \tabularnewline
5 & -0.288515 & -2.8269 & 0.00286 \tabularnewline
6 & -0.464772 & -4.5538 & 8e-06 \tabularnewline
7 & -0.289636 & -2.8378 & 0.002771 \tabularnewline
8 & -0.229369 & -2.2473 & 0.013454 \tabularnewline
9 & -0.079775 & -0.7816 & 0.218176 \tabularnewline
10 & 0.106331 & 1.0418 & 0.150053 \tabularnewline
11 & 0.271641 & 2.6615 & 0.00456 \tabularnewline
12 & 0.663198 & 6.498 & 0 \tabularnewline
13 & 0.321044 & 3.1456 & 0.001104 \tabularnewline
14 & 0.123379 & 1.2089 & 0.114842 \tabularnewline
15 & -0.032077 & -0.3143 & 0.376991 \tabularnewline
16 & -0.197121 & -1.9314 & 0.028193 \tabularnewline
17 & -0.276539 & -2.7095 & 0.00399 \tabularnewline
18 & -0.448181 & -4.3913 & 1.5e-05 \tabularnewline
19 & -0.316726 & -3.1033 & 0.001257 \tabularnewline
20 & -0.217978 & -2.1357 & 0.017622 \tabularnewline
21 & -0.104491 & -1.0238 & 0.154251 \tabularnewline
22 & 0.048424 & 0.4745 & 0.318125 \tabularnewline
23 & 0.233765 & 2.2904 & 0.012093 \tabularnewline
24 & 0.553923 & 5.4273 & 0 \tabularnewline
25 & 0.293419 & 2.8749 & 0.002489 \tabularnewline
26 & 0.136041 & 1.3329 & 0.092856 \tabularnewline
27 & -0.0373 & -0.3655 & 0.357784 \tabularnewline
28 & -0.185788 & -1.8203 & 0.035911 \tabularnewline
29 & -0.232273 & -2.2758 & 0.01254 \tabularnewline
30 & -0.398133 & -3.9009 & 8.9e-05 \tabularnewline
31 & -0.269741 & -2.6429 & 0.0048 \tabularnewline
32 & -0.171011 & -1.6756 & 0.04854 \tabularnewline
33 & -0.075496 & -0.7397 & 0.230643 \tabularnewline
34 & 0.045318 & 0.444 & 0.329012 \tabularnewline
35 & 0.189569 & 1.8574 & 0.033161 \tabularnewline
36 & 0.467525 & 4.5808 & 7e-06 \tabularnewline
37 & 0.22433 & 2.198 & 0.015178 \tabularnewline
38 & 0.108215 & 1.0603 & 0.145837 \tabularnewline
39 & -0.053266 & -0.5219 & 0.30147 \tabularnewline
40 & -0.17003 & -1.6659 & 0.049492 \tabularnewline
41 & -0.209644 & -2.0541 & 0.021343 \tabularnewline
42 & -0.320247 & -3.1378 & 0.001131 \tabularnewline
43 & -0.198552 & -1.9454 & 0.027326 \tabularnewline
44 & -0.123633 & -1.2114 & 0.114367 \tabularnewline
45 & -0.046774 & -0.4583 & 0.323889 \tabularnewline
46 & 0.059589 & 0.5839 & 0.280344 \tabularnewline
47 & 0.173159 & 1.6966 & 0.046506 \tabularnewline
48 & 0.400103 & 3.9202 & 8.3e-05 \tabularnewline
\hline
\end{tabular}
%Source: https://freestatistics.org/blog/index.php?pk=277880&T=1

[TABLE]
[ROW][C]Autocorrelation Function[/C][/ROW]
[ROW][C]Time lag k[/C][C]ACF(k)[/C][C]T-STAT[/C][C]P-value[/C][/ROW]
[ROW][C]1[/C][C]0.444487[/C][C]4.3551[/C][C]1.7e-05[/C][/ROW]
[ROW][C]2[/C][C]0.225298[/C][C]2.2075[/C][C]0.014832[/C][/ROW]
[ROW][C]3[/C][C]0.07976[/C][C]0.7815[/C][C]0.21822[/C][/ROW]
[ROW][C]4[/C][C]-0.142497[/C][C]-1.3962[/C][C]0.08294[/C][/ROW]
[ROW][C]5[/C][C]-0.288515[/C][C]-2.8269[/C][C]0.00286[/C][/ROW]
[ROW][C]6[/C][C]-0.464772[/C][C]-4.5538[/C][C]8e-06[/C][/ROW]
[ROW][C]7[/C][C]-0.289636[/C][C]-2.8378[/C][C]0.002771[/C][/ROW]
[ROW][C]8[/C][C]-0.229369[/C][C]-2.2473[/C][C]0.013454[/C][/ROW]
[ROW][C]9[/C][C]-0.079775[/C][C]-0.7816[/C][C]0.218176[/C][/ROW]
[ROW][C]10[/C][C]0.106331[/C][C]1.0418[/C][C]0.150053[/C][/ROW]
[ROW][C]11[/C][C]0.271641[/C][C]2.6615[/C][C]0.00456[/C][/ROW]
[ROW][C]12[/C][C]0.663198[/C][C]6.498[/C][C]0[/C][/ROW]
[ROW][C]13[/C][C]0.321044[/C][C]3.1456[/C][C]0.001104[/C][/ROW]
[ROW][C]14[/C][C]0.123379[/C][C]1.2089[/C][C]0.114842[/C][/ROW]
[ROW][C]15[/C][C]-0.032077[/C][C]-0.3143[/C][C]0.376991[/C][/ROW]
[ROW][C]16[/C][C]-0.197121[/C][C]-1.9314[/C][C]0.028193[/C][/ROW]
[ROW][C]17[/C][C]-0.276539[/C][C]-2.7095[/C][C]0.00399[/C][/ROW]
[ROW][C]18[/C][C]-0.448181[/C][C]-4.3913[/C][C]1.5e-05[/C][/ROW]
[ROW][C]19[/C][C]-0.316726[/C][C]-3.1033[/C][C]0.001257[/C][/ROW]
[ROW][C]20[/C][C]-0.217978[/C][C]-2.1357[/C][C]0.017622[/C][/ROW]
[ROW][C]21[/C][C]-0.104491[/C][C]-1.0238[/C][C]0.154251[/C][/ROW]
[ROW][C]22[/C][C]0.048424[/C][C]0.4745[/C][C]0.318125[/C][/ROW]
[ROW][C]23[/C][C]0.233765[/C][C]2.2904[/C][C]0.012093[/C][/ROW]
[ROW][C]24[/C][C]0.553923[/C][C]5.4273[/C][C]0[/C][/ROW]
[ROW][C]25[/C][C]0.293419[/C][C]2.8749[/C][C]0.002489[/C][/ROW]
[ROW][C]26[/C][C]0.136041[/C][C]1.3329[/C][C]0.092856[/C][/ROW]
[ROW][C]27[/C][C]-0.0373[/C][C]-0.3655[/C][C]0.357784[/C][/ROW]
[ROW][C]28[/C][C]-0.185788[/C][C]-1.8203[/C][C]0.035911[/C][/ROW]
[ROW][C]29[/C][C]-0.232273[/C][C]-2.2758[/C][C]0.01254[/C][/ROW]
[ROW][C]30[/C][C]-0.398133[/C][C]-3.9009[/C][C]8.9e-05[/C][/ROW]
[ROW][C]31[/C][C]-0.269741[/C][C]-2.6429[/C][C]0.0048[/C][/ROW]
[ROW][C]32[/C][C]-0.171011[/C][C]-1.6756[/C][C]0.04854[/C][/ROW]
[ROW][C]33[/C][C]-0.075496[/C][C]-0.7397[/C][C]0.230643[/C][/ROW]
[ROW][C]34[/C][C]0.045318[/C][C]0.444[/C][C]0.329012[/C][/ROW]
[ROW][C]35[/C][C]0.189569[/C][C]1.8574[/C][C]0.033161[/C][/ROW]
[ROW][C]36[/C][C]0.467525[/C][C]4.5808[/C][C]7e-06[/C][/ROW]
[ROW][C]37[/C][C]0.22433[/C][C]2.198[/C][C]0.015178[/C][/ROW]
[ROW][C]38[/C][C]0.108215[/C][C]1.0603[/C][C]0.145837[/C][/ROW]
[ROW][C]39[/C][C]-0.053266[/C][C]-0.5219[/C][C]0.30147[/C][/ROW]
[ROW][C]40[/C][C]-0.17003[/C][C]-1.6659[/C][C]0.049492[/C][/ROW]
[ROW][C]41[/C][C]-0.209644[/C][C]-2.0541[/C][C]0.021343[/C][/ROW]
[ROW][C]42[/C][C]-0.320247[/C][C]-3.1378[/C][C]0.001131[/C][/ROW]
[ROW][C]43[/C][C]-0.198552[/C][C]-1.9454[/C][C]0.027326[/C][/ROW]
[ROW][C]44[/C][C]-0.123633[/C][C]-1.2114[/C][C]0.114367[/C][/ROW]
[ROW][C]45[/C][C]-0.046774[/C][C]-0.4583[/C][C]0.323889[/C][/ROW]
[ROW][C]46[/C][C]0.059589[/C][C]0.5839[/C][C]0.280344[/C][/ROW]
[ROW][C]47[/C][C]0.173159[/C][C]1.6966[/C][C]0.046506[/C][/ROW]
[ROW][C]48[/C][C]0.400103[/C][C]3.9202[/C][C]8.3e-05[/C][/ROW]
[/TABLE]
Source: https://freestatistics.org/blog/index.php?pk=277880&T=1

Globally Unique Identifier (entire table): ba.freestatistics.org/blog/index.php?pk=277880&T=1

As an alternative you can also use a QR Code:  

The GUIDs for individual cells are displayed in the table below:

Autocorrelation Function
Time lag kACF(k)T-STATP-value
10.4444874.35511.7e-05
20.2252982.20750.014832
30.079760.78150.21822
4-0.142497-1.39620.08294
5-0.288515-2.82690.00286
6-0.464772-4.55388e-06
7-0.289636-2.83780.002771
8-0.229369-2.24730.013454
9-0.079775-0.78160.218176
100.1063311.04180.150053
110.2716412.66150.00456
120.6631986.4980
130.3210443.14560.001104
140.1233791.20890.114842
15-0.032077-0.31430.376991
16-0.197121-1.93140.028193
17-0.276539-2.70950.00399
18-0.448181-4.39131.5e-05
19-0.316726-3.10330.001257
20-0.217978-2.13570.017622
21-0.104491-1.02380.154251
220.0484240.47450.318125
230.2337652.29040.012093
240.5539235.42730
250.2934192.87490.002489
260.1360411.33290.092856
27-0.0373-0.36550.357784
28-0.185788-1.82030.035911
29-0.232273-2.27580.01254
30-0.398133-3.90098.9e-05
31-0.269741-2.64290.0048
32-0.171011-1.67560.04854
33-0.075496-0.73970.230643
340.0453180.4440.329012
350.1895691.85740.033161
360.4675254.58087e-06
370.224332.1980.015178
380.1082151.06030.145837
39-0.053266-0.52190.30147
40-0.17003-1.66590.049492
41-0.209644-2.05410.021343
42-0.320247-3.13780.001131
43-0.198552-1.94540.027326
44-0.123633-1.21140.114367
45-0.046774-0.45830.323889
460.0595890.58390.280344
470.1731591.69660.046506
480.4001033.92028.3e-05


Partial Autocorrelation Function
Time lag kPACF(k)T-STATP-value
10.4444874.35511.7e-05
20.0345560.33860.367832
3-0.040277-0.39460.346995
4-0.213219-2.08910.019671
5-0.196703-1.92730.02845
6-0.317412-3.110.001232
70.0694530.68050.248913
8-0.078568-0.76980.221652
90.0565340.55390.290462
100.050760.49730.310041
110.1442221.41310.080432
120.5427985.31830
13-0.278563-2.72940.003775
14-0.214975-2.10630.018893
15-0.260495-2.55230.006139
16-0.010126-0.09920.460588
170.1381681.35380.089495
180.0046940.0460.481707
19-0.131507-1.28850.100334
20-0.003639-0.03560.485818
21-0.001146-0.01120.495531
22-0.035544-0.34830.364203
230.0596440.58440.280163
240.0466440.4570.324346
25-0.069706-0.6830.248133
260.0059460.05830.476832
27-0.143762-1.40860.081096
28-0.038538-0.37760.353283
290.0409840.40160.344451
30-0.033802-0.33120.370612
310.0632160.61940.268563
320.011530.1130.455144
33-0.033021-0.32350.373497
34-0.05677-0.55620.289673
35-0.100346-0.98320.163994
36-0.011905-0.11660.453692
37-0.105186-1.03060.152658
380.0258610.25340.400257
39-0.021978-0.21530.414978
400.0542990.5320.297972
41-0.073431-0.71950.236798
420.046170.45240.326011
43-0.035571-0.34850.364106
44-0.019812-0.19410.423248
45-0.052758-0.51690.3032
46-0.038653-0.37870.352864
470.0014990.01470.494157
480.0143190.14030.444358

\begin{tabular}{lllllllll}
\hline
Partial Autocorrelation Function \tabularnewline
Time lag k & PACF(k) & T-STAT & P-value \tabularnewline
1 & 0.444487 & 4.3551 & 1.7e-05 \tabularnewline
2 & 0.034556 & 0.3386 & 0.367832 \tabularnewline
3 & -0.040277 & -0.3946 & 0.346995 \tabularnewline
4 & -0.213219 & -2.0891 & 0.019671 \tabularnewline
5 & -0.196703 & -1.9273 & 0.02845 \tabularnewline
6 & -0.317412 & -3.11 & 0.001232 \tabularnewline
7 & 0.069453 & 0.6805 & 0.248913 \tabularnewline
8 & -0.078568 & -0.7698 & 0.221652 \tabularnewline
9 & 0.056534 & 0.5539 & 0.290462 \tabularnewline
10 & 0.05076 & 0.4973 & 0.310041 \tabularnewline
11 & 0.144222 & 1.4131 & 0.080432 \tabularnewline
12 & 0.542798 & 5.3183 & 0 \tabularnewline
13 & -0.278563 & -2.7294 & 0.003775 \tabularnewline
14 & -0.214975 & -2.1063 & 0.018893 \tabularnewline
15 & -0.260495 & -2.5523 & 0.006139 \tabularnewline
16 & -0.010126 & -0.0992 & 0.460588 \tabularnewline
17 & 0.138168 & 1.3538 & 0.089495 \tabularnewline
18 & 0.004694 & 0.046 & 0.481707 \tabularnewline
19 & -0.131507 & -1.2885 & 0.100334 \tabularnewline
20 & -0.003639 & -0.0356 & 0.485818 \tabularnewline
21 & -0.001146 & -0.0112 & 0.495531 \tabularnewline
22 & -0.035544 & -0.3483 & 0.364203 \tabularnewline
23 & 0.059644 & 0.5844 & 0.280163 \tabularnewline
24 & 0.046644 & 0.457 & 0.324346 \tabularnewline
25 & -0.069706 & -0.683 & 0.248133 \tabularnewline
26 & 0.005946 & 0.0583 & 0.476832 \tabularnewline
27 & -0.143762 & -1.4086 & 0.081096 \tabularnewline
28 & -0.038538 & -0.3776 & 0.353283 \tabularnewline
29 & 0.040984 & 0.4016 & 0.344451 \tabularnewline
30 & -0.033802 & -0.3312 & 0.370612 \tabularnewline
31 & 0.063216 & 0.6194 & 0.268563 \tabularnewline
32 & 0.01153 & 0.113 & 0.455144 \tabularnewline
33 & -0.033021 & -0.3235 & 0.373497 \tabularnewline
34 & -0.05677 & -0.5562 & 0.289673 \tabularnewline
35 & -0.100346 & -0.9832 & 0.163994 \tabularnewline
36 & -0.011905 & -0.1166 & 0.453692 \tabularnewline
37 & -0.105186 & -1.0306 & 0.152658 \tabularnewline
38 & 0.025861 & 0.2534 & 0.400257 \tabularnewline
39 & -0.021978 & -0.2153 & 0.414978 \tabularnewline
40 & 0.054299 & 0.532 & 0.297972 \tabularnewline
41 & -0.073431 & -0.7195 & 0.236798 \tabularnewline
42 & 0.04617 & 0.4524 & 0.326011 \tabularnewline
43 & -0.035571 & -0.3485 & 0.364106 \tabularnewline
44 & -0.019812 & -0.1941 & 0.423248 \tabularnewline
45 & -0.052758 & -0.5169 & 0.3032 \tabularnewline
46 & -0.038653 & -0.3787 & 0.352864 \tabularnewline
47 & 0.001499 & 0.0147 & 0.494157 \tabularnewline
48 & 0.014319 & 0.1403 & 0.444358 \tabularnewline
\hline
\end{tabular}
%Source: https://freestatistics.org/blog/index.php?pk=277880&T=2

[TABLE]
[ROW][C]Partial Autocorrelation Function[/C][/ROW]
[ROW][C]Time lag k[/C][C]PACF(k)[/C][C]T-STAT[/C][C]P-value[/C][/ROW]
[ROW][C]1[/C][C]0.444487[/C][C]4.3551[/C][C]1.7e-05[/C][/ROW]
[ROW][C]2[/C][C]0.034556[/C][C]0.3386[/C][C]0.367832[/C][/ROW]
[ROW][C]3[/C][C]-0.040277[/C][C]-0.3946[/C][C]0.346995[/C][/ROW]
[ROW][C]4[/C][C]-0.213219[/C][C]-2.0891[/C][C]0.019671[/C][/ROW]
[ROW][C]5[/C][C]-0.196703[/C][C]-1.9273[/C][C]0.02845[/C][/ROW]
[ROW][C]6[/C][C]-0.317412[/C][C]-3.11[/C][C]0.001232[/C][/ROW]
[ROW][C]7[/C][C]0.069453[/C][C]0.6805[/C][C]0.248913[/C][/ROW]
[ROW][C]8[/C][C]-0.078568[/C][C]-0.7698[/C][C]0.221652[/C][/ROW]
[ROW][C]9[/C][C]0.056534[/C][C]0.5539[/C][C]0.290462[/C][/ROW]
[ROW][C]10[/C][C]0.05076[/C][C]0.4973[/C][C]0.310041[/C][/ROW]
[ROW][C]11[/C][C]0.144222[/C][C]1.4131[/C][C]0.080432[/C][/ROW]
[ROW][C]12[/C][C]0.542798[/C][C]5.3183[/C][C]0[/C][/ROW]
[ROW][C]13[/C][C]-0.278563[/C][C]-2.7294[/C][C]0.003775[/C][/ROW]
[ROW][C]14[/C][C]-0.214975[/C][C]-2.1063[/C][C]0.018893[/C][/ROW]
[ROW][C]15[/C][C]-0.260495[/C][C]-2.5523[/C][C]0.006139[/C][/ROW]
[ROW][C]16[/C][C]-0.010126[/C][C]-0.0992[/C][C]0.460588[/C][/ROW]
[ROW][C]17[/C][C]0.138168[/C][C]1.3538[/C][C]0.089495[/C][/ROW]
[ROW][C]18[/C][C]0.004694[/C][C]0.046[/C][C]0.481707[/C][/ROW]
[ROW][C]19[/C][C]-0.131507[/C][C]-1.2885[/C][C]0.100334[/C][/ROW]
[ROW][C]20[/C][C]-0.003639[/C][C]-0.0356[/C][C]0.485818[/C][/ROW]
[ROW][C]21[/C][C]-0.001146[/C][C]-0.0112[/C][C]0.495531[/C][/ROW]
[ROW][C]22[/C][C]-0.035544[/C][C]-0.3483[/C][C]0.364203[/C][/ROW]
[ROW][C]23[/C][C]0.059644[/C][C]0.5844[/C][C]0.280163[/C][/ROW]
[ROW][C]24[/C][C]0.046644[/C][C]0.457[/C][C]0.324346[/C][/ROW]
[ROW][C]25[/C][C]-0.069706[/C][C]-0.683[/C][C]0.248133[/C][/ROW]
[ROW][C]26[/C][C]0.005946[/C][C]0.0583[/C][C]0.476832[/C][/ROW]
[ROW][C]27[/C][C]-0.143762[/C][C]-1.4086[/C][C]0.081096[/C][/ROW]
[ROW][C]28[/C][C]-0.038538[/C][C]-0.3776[/C][C]0.353283[/C][/ROW]
[ROW][C]29[/C][C]0.040984[/C][C]0.4016[/C][C]0.344451[/C][/ROW]
[ROW][C]30[/C][C]-0.033802[/C][C]-0.3312[/C][C]0.370612[/C][/ROW]
[ROW][C]31[/C][C]0.063216[/C][C]0.6194[/C][C]0.268563[/C][/ROW]
[ROW][C]32[/C][C]0.01153[/C][C]0.113[/C][C]0.455144[/C][/ROW]
[ROW][C]33[/C][C]-0.033021[/C][C]-0.3235[/C][C]0.373497[/C][/ROW]
[ROW][C]34[/C][C]-0.05677[/C][C]-0.5562[/C][C]0.289673[/C][/ROW]
[ROW][C]35[/C][C]-0.100346[/C][C]-0.9832[/C][C]0.163994[/C][/ROW]
[ROW][C]36[/C][C]-0.011905[/C][C]-0.1166[/C][C]0.453692[/C][/ROW]
[ROW][C]37[/C][C]-0.105186[/C][C]-1.0306[/C][C]0.152658[/C][/ROW]
[ROW][C]38[/C][C]0.025861[/C][C]0.2534[/C][C]0.400257[/C][/ROW]
[ROW][C]39[/C][C]-0.021978[/C][C]-0.2153[/C][C]0.414978[/C][/ROW]
[ROW][C]40[/C][C]0.054299[/C][C]0.532[/C][C]0.297972[/C][/ROW]
[ROW][C]41[/C][C]-0.073431[/C][C]-0.7195[/C][C]0.236798[/C][/ROW]
[ROW][C]42[/C][C]0.04617[/C][C]0.4524[/C][C]0.326011[/C][/ROW]
[ROW][C]43[/C][C]-0.035571[/C][C]-0.3485[/C][C]0.364106[/C][/ROW]
[ROW][C]44[/C][C]-0.019812[/C][C]-0.1941[/C][C]0.423248[/C][/ROW]
[ROW][C]45[/C][C]-0.052758[/C][C]-0.5169[/C][C]0.3032[/C][/ROW]
[ROW][C]46[/C][C]-0.038653[/C][C]-0.3787[/C][C]0.352864[/C][/ROW]
[ROW][C]47[/C][C]0.001499[/C][C]0.0147[/C][C]0.494157[/C][/ROW]
[ROW][C]48[/C][C]0.014319[/C][C]0.1403[/C][C]0.444358[/C][/ROW]
[/TABLE]
Source: https://freestatistics.org/blog/index.php?pk=277880&T=2

Globally Unique Identifier (entire table): ba.freestatistics.org/blog/index.php?pk=277880&T=2

As an alternative you can also use a QR Code:  

The GUIDs for individual cells are displayed in the table below:

Partial Autocorrelation Function
Time lag kPACF(k)T-STATP-value
10.4444874.35511.7e-05
20.0345560.33860.367832
3-0.040277-0.39460.346995
4-0.213219-2.08910.019671
5-0.196703-1.92730.02845
6-0.317412-3.110.001232
70.0694530.68050.248913
8-0.078568-0.76980.221652
90.0565340.55390.290462
100.050760.49730.310041
110.1442221.41310.080432
120.5427985.31830
13-0.278563-2.72940.003775
14-0.214975-2.10630.018893
15-0.260495-2.55230.006139
16-0.010126-0.09920.460588
170.1381681.35380.089495
180.0046940.0460.481707
19-0.131507-1.28850.100334
20-0.003639-0.03560.485818
21-0.001146-0.01120.495531
22-0.035544-0.34830.364203
230.0596440.58440.280163
240.0466440.4570.324346
25-0.069706-0.6830.248133
260.0059460.05830.476832
27-0.143762-1.40860.081096
28-0.038538-0.37760.353283
290.0409840.40160.344451
30-0.033802-0.33120.370612
310.0632160.61940.268563
320.011530.1130.455144
33-0.033021-0.32350.373497
34-0.05677-0.55620.289673
35-0.100346-0.98320.163994
36-0.011905-0.11660.453692
37-0.105186-1.03060.152658
380.0258610.25340.400257
39-0.021978-0.21530.414978
400.0542990.5320.297972
41-0.073431-0.71950.236798
420.046170.45240.326011
43-0.035571-0.34850.364106
44-0.019812-0.19410.423248
45-0.052758-0.51690.3032
46-0.038653-0.37870.352864
470.0014990.01470.494157
480.0143190.14030.444358


Parameters (Session):
par1 = 48 ; par2 = 1 ; par3 = 0 ; par4 = 0 ; par5 = 12 ; par6 = White Noise ; par7 = 0.95 ;
Parameters (R input):
par1 = 48 ; par2 = 1 ; par3 = 0 ; par4 = 0 ; par5 = 12 ; par6 = White Noise ; par7 = 0.95 ; par8 = ;
R code (references can be found in the software module):
if (par1 == 'Default') {
par1 = 10*log10(length(x))
} else {
par1 <- as.numeric(par1)
}
par2 <- as.numeric(par2)
par3 <- as.numeric(par3)
par4 <- as.numeric(par4)
par5 <- as.numeric(par5)
if (par6 == 'White Noise') par6 <- 'white' else par6 <- 'ma'
par7 <- as.numeric(par7)
if (par8 != '') par8 <- as.numeric(par8)
ox <- x
if (par8 == '') {
if (par2 == 0) {
x <- log(x)
} else {
x <- (x ^ par2 - 1) / par2
}
} else {
x <- log(x,base=par8)
}
if (par3 > 0) x <- diff(x,lag=1,difference=par3)
if (par4 > 0) x <- diff(x,lag=par5,difference=par4)
bitmap(file='picts.png')
op <- par(mfrow=c(2,1))
plot(ox,type='l',main='Original Time Series',xlab='time',ylab='value')
if (par8=='') {
mytitle <- paste('Working Time Series (lambda=',par2,', d=',par3,', D=',par4,')',sep='')
mysub <- paste('(lambda=',par2,', d=',par3,', D=',par4,', CI=', par7, ', CI type=',par6,')',sep='')
} else {
mytitle <- paste('Working Time Series (base=',par8,', d=',par3,', D=',par4,')',sep='')
mysub <- paste('(base=',par8,', d=',par3,', D=',par4,', CI=', par7, ', CI type=',par6,')',sep='')
}
plot(x,type='l', main=mytitle,xlab='time',ylab='value')
par(op)
dev.off()
bitmap(file='pic1.png')
racf <- acf(x, par1, main='Autocorrelation', xlab='time lag', ylab='ACF', ci.type=par6, ci=par7, sub=mysub)
dev.off()
bitmap(file='pic2.png')
rpacf <- pacf(x,par1,main='Partial Autocorrelation',xlab='lags',ylab='PACF',sub=mysub)
dev.off()
(myacf <- c(racf$acf))
(mypacf <- c(rpacf$acf))
lengthx <- length(x)
sqrtn <- sqrt(lengthx)
load(file='createtable')
a<-table.start()
a<-table.row.start(a)
a<-table.element(a,'Autocorrelation Function',4,TRUE)
a<-table.row.end(a)
a<-table.row.start(a)
a<-table.element(a,'Time lag k',header=TRUE)
a<-table.element(a,hyperlink('basics.htm','ACF(k)','click here for more information about the Autocorrelation Function'),header=TRUE)
a<-table.element(a,'T-STAT',header=TRUE)
a<-table.element(a,'P-value',header=TRUE)
a<-table.row.end(a)
for (i in 2:(par1+1)) {
a<-table.row.start(a)
a<-table.element(a,i-1,header=TRUE)
a<-table.element(a,round(myacf[i],6))
mytstat <- myacf[i]*sqrtn
a<-table.element(a,round(mytstat,4))
a<-table.element(a,round(1-pt(abs(mytstat),lengthx),6))
a<-table.row.end(a)
}
a<-table.end(a)
table.save(a,file='mytable.tab')
a<-table.start()
a<-table.row.start(a)
a<-table.element(a,'Partial Autocorrelation Function',4,TRUE)
a<-table.row.end(a)
a<-table.row.start(a)
a<-table.element(a,'Time lag k',header=TRUE)
a<-table.element(a,hyperlink('basics.htm','PACF(k)','click here for more information about the Partial Autocorrelation Function'),header=TRUE)
a<-table.element(a,'T-STAT',header=TRUE)
a<-table.element(a,'P-value',header=TRUE)
a<-table.row.end(a)
for (i in 1:par1) {
a<-table.row.start(a)
a<-table.element(a,i,header=TRUE)
a<-table.element(a,round(mypacf[i],6))
mytstat <- mypacf[i]*sqrtn
a<-table.element(a,round(mytstat,4))
a<-table.element(a,round(1-pt(abs(mytstat),lengthx),6))
a<-table.row.end(a)
}
a<-table.end(a)
table.save(a,file='mytable1.tab')