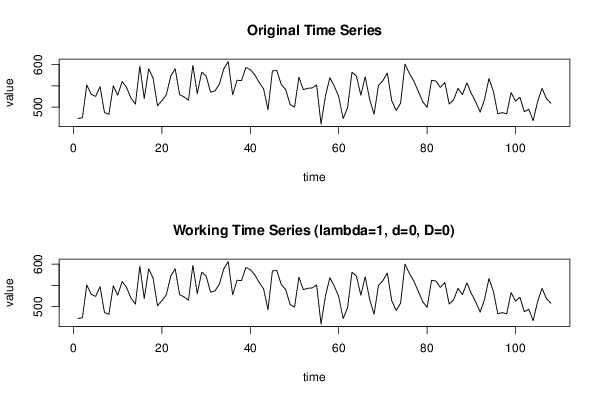
Free Statistics

of Irreproducible Research!

Author's title

Author*Unverified author*
R Software Modulerwasp_autocorrelation.wasp
Title produced by software(Partial) Autocorrelation Function
Date of computationThu, 05 Mar 2015 08:17:45 +0000
Cite this page as followsStatistical Computations at FreeStatistics.org, Office for Research Development and Education, URL https://freestatistics.org/blog/index.php?v=date/2015/Mar/05/t14255435906y6d8tdszqkmewb.htm/, Retrieved Fri, 17 May 2024 19:21:34 +0000
Statistical Computations at FreeStatistics.org, Office for Research Development and Education, URL https://freestatistics.org/blog/index.php?pk=277918, Retrieved Fri, 17 May 2024 19:21:34 +0000
QR Codes:

Original text written by user:
IsPrivate?No (this computation is public)
User-defined keywords
Estimated Impact97
Family? (F = Feedback message, R = changed R code, M = changed R Module, P = changed Parameters, D = changed Data)
-       [(Partial) Autocorrelation Function] [Afzet autodiesel ...] [2015-03-05 08:17:45] [642cc750ae8ad788b94759782886fa51] [Current]
Feedback Forum

Post a new message
Dataseries X:
473
475
552
530
525
548
487
483
550
528
560
546
521
507
596
520
590
568
503
515
529
573
590
529
524
516
598
532
582
573
535
538
554
590
607
529
563
562
593
588
576
558
543
494
585
586
553
541
506
500
570
541
544
545
552
460
526
569
549
525
473
498
582
573
528
571
518
483
551
562
580
515
492
509
601
579
561
537
513
499
563
561
546
558
507
517
544
529
557
532
512
488
518
567
537
484
487
484
534
514
523
489
495
468
513
544
520
509


Summary of computational transaction
Raw Inputview raw input (R code)
Raw Outputview raw output of R engine
Computing time2 seconds
R Server'Sir Maurice George Kendall' @ kendall.wessa.net

\begin{tabular}{lllllllll}
\hline
Summary of computational transaction \tabularnewline
Raw Input & view raw input (R code)  \tabularnewline
Raw Output & view raw output of R engine  \tabularnewline
Computing time & 2 seconds \tabularnewline
R Server & 'Sir Maurice George Kendall' @ kendall.wessa.net \tabularnewline
\hline
\end{tabular}
%Source: https://freestatistics.org/blog/index.php?pk=277918&T=0

[TABLE]
[ROW][C]Summary of computational transaction[/C][/ROW]
[ROW][C]Raw Input[/C][C]view raw input (R code) [/C][/ROW]
[ROW][C]Raw Output[/C][C]view raw output of R engine [/C][/ROW]
[ROW][C]Computing time[/C][C]2 seconds[/C][/ROW]
[ROW][C]R Server[/C][C]'Sir Maurice George Kendall' @ kendall.wessa.net[/C][/ROW]
[/TABLE]
Source: https://freestatistics.org/blog/index.php?pk=277918&T=0

Globally Unique Identifier (entire table): ba.freestatistics.org/blog/index.php?pk=277918&T=0

As an alternative you can also use a QR Code:  

The GUIDs for individual cells are displayed in the table below:

Summary of computational transaction
Raw Inputview raw input (R code)
Raw Outputview raw output of R engine
Computing time2 seconds
R Server'Sir Maurice George Kendall' @ kendall.wessa.net


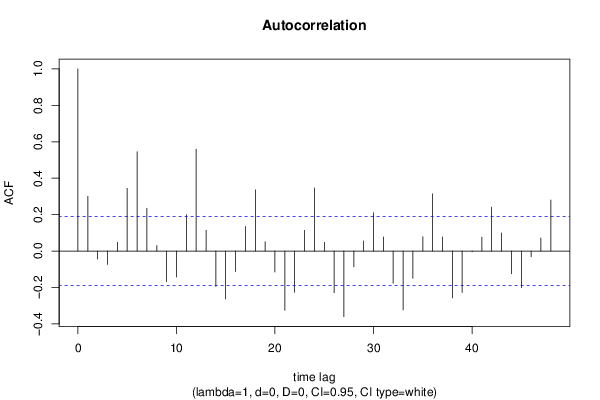
Autocorrelation Function
Time lag kACF(k)T-STATP-value
10.3005773.12370.001147
2-0.043504-0.45210.326049
3-0.073753-0.76650.222537
40.0478410.49720.310035
50.3443663.57880.000259
60.5452465.66640
70.2353032.44530.008044
80.0299870.31160.377959
9-0.16754-1.74110.042254
10-0.142174-1.47750.071224
110.1998542.07690.020089
120.5595415.81490
130.1147231.19220.117892
14-0.193785-2.01390.023255
15-0.262414-2.72710.003729
16-0.111741-1.16120.124052
170.1351911.40490.081454
180.336163.49350.000346
190.0515920.53620.296476
20-0.114497-1.18990.11835
21-0.324648-3.37380.000515
22-0.225811-2.34670.010382
230.1137911.18250.119793
240.3461333.59710.000243
250.0478620.49740.309961
26-0.228288-2.37240.00972
27-0.35993-3.74050.000148
28-0.085983-0.89360.186771
290.0557230.57910.281865
300.2105462.18810.01541
310.0772620.80290.211889
32-0.177002-1.83950.034298
33-0.322971-3.35640.000545
34-0.149089-1.54940.062108
350.0790230.82120.20666
360.3141273.26450.000735
370.0770510.80070.21252
38-0.256854-2.66930.004387
39-0.227633-2.36560.009892
40-0.003295-0.03420.486375
410.0760520.79040.215526
420.2407982.50240.006916
430.0993711.03270.152027
44-0.124548-1.29430.099154
45-0.200528-2.0840.019762
46-0.030853-0.32060.374552
470.0716020.74410.229212
480.2806262.91640.002154

\begin{tabular}{lllllllll}
\hline
Autocorrelation Function \tabularnewline
Time lag k & ACF(k) & T-STAT & P-value \tabularnewline
1 & 0.300577 & 3.1237 & 0.001147 \tabularnewline
2 & -0.043504 & -0.4521 & 0.326049 \tabularnewline
3 & -0.073753 & -0.7665 & 0.222537 \tabularnewline
4 & 0.047841 & 0.4972 & 0.310035 \tabularnewline
5 & 0.344366 & 3.5788 & 0.000259 \tabularnewline
6 & 0.545246 & 5.6664 & 0 \tabularnewline
7 & 0.235303 & 2.4453 & 0.008044 \tabularnewline
8 & 0.029987 & 0.3116 & 0.377959 \tabularnewline
9 & -0.16754 & -1.7411 & 0.042254 \tabularnewline
10 & -0.142174 & -1.4775 & 0.071224 \tabularnewline
11 & 0.199854 & 2.0769 & 0.020089 \tabularnewline
12 & 0.559541 & 5.8149 & 0 \tabularnewline
13 & 0.114723 & 1.1922 & 0.117892 \tabularnewline
14 & -0.193785 & -2.0139 & 0.023255 \tabularnewline
15 & -0.262414 & -2.7271 & 0.003729 \tabularnewline
16 & -0.111741 & -1.1612 & 0.124052 \tabularnewline
17 & 0.135191 & 1.4049 & 0.081454 \tabularnewline
18 & 0.33616 & 3.4935 & 0.000346 \tabularnewline
19 & 0.051592 & 0.5362 & 0.296476 \tabularnewline
20 & -0.114497 & -1.1899 & 0.11835 \tabularnewline
21 & -0.324648 & -3.3738 & 0.000515 \tabularnewline
22 & -0.225811 & -2.3467 & 0.010382 \tabularnewline
23 & 0.113791 & 1.1825 & 0.119793 \tabularnewline
24 & 0.346133 & 3.5971 & 0.000243 \tabularnewline
25 & 0.047862 & 0.4974 & 0.309961 \tabularnewline
26 & -0.228288 & -2.3724 & 0.00972 \tabularnewline
27 & -0.35993 & -3.7405 & 0.000148 \tabularnewline
28 & -0.085983 & -0.8936 & 0.186771 \tabularnewline
29 & 0.055723 & 0.5791 & 0.281865 \tabularnewline
30 & 0.210546 & 2.1881 & 0.01541 \tabularnewline
31 & 0.077262 & 0.8029 & 0.211889 \tabularnewline
32 & -0.177002 & -1.8395 & 0.034298 \tabularnewline
33 & -0.322971 & -3.3564 & 0.000545 \tabularnewline
34 & -0.149089 & -1.5494 & 0.062108 \tabularnewline
35 & 0.079023 & 0.8212 & 0.20666 \tabularnewline
36 & 0.314127 & 3.2645 & 0.000735 \tabularnewline
37 & 0.077051 & 0.8007 & 0.21252 \tabularnewline
38 & -0.256854 & -2.6693 & 0.004387 \tabularnewline
39 & -0.227633 & -2.3656 & 0.009892 \tabularnewline
40 & -0.003295 & -0.0342 & 0.486375 \tabularnewline
41 & 0.076052 & 0.7904 & 0.215526 \tabularnewline
42 & 0.240798 & 2.5024 & 0.006916 \tabularnewline
43 & 0.099371 & 1.0327 & 0.152027 \tabularnewline
44 & -0.124548 & -1.2943 & 0.099154 \tabularnewline
45 & -0.200528 & -2.084 & 0.019762 \tabularnewline
46 & -0.030853 & -0.3206 & 0.374552 \tabularnewline
47 & 0.071602 & 0.7441 & 0.229212 \tabularnewline
48 & 0.280626 & 2.9164 & 0.002154 \tabularnewline
\hline
\end{tabular}
%Source: https://freestatistics.org/blog/index.php?pk=277918&T=1

[TABLE]
[ROW][C]Autocorrelation Function[/C][/ROW]
[ROW][C]Time lag k[/C][C]ACF(k)[/C][C]T-STAT[/C][C]P-value[/C][/ROW]
[ROW][C]1[/C][C]0.300577[/C][C]3.1237[/C][C]0.001147[/C][/ROW]
[ROW][C]2[/C][C]-0.043504[/C][C]-0.4521[/C][C]0.326049[/C][/ROW]
[ROW][C]3[/C][C]-0.073753[/C][C]-0.7665[/C][C]0.222537[/C][/ROW]
[ROW][C]4[/C][C]0.047841[/C][C]0.4972[/C][C]0.310035[/C][/ROW]
[ROW][C]5[/C][C]0.344366[/C][C]3.5788[/C][C]0.000259[/C][/ROW]
[ROW][C]6[/C][C]0.545246[/C][C]5.6664[/C][C]0[/C][/ROW]
[ROW][C]7[/C][C]0.235303[/C][C]2.4453[/C][C]0.008044[/C][/ROW]
[ROW][C]8[/C][C]0.029987[/C][C]0.3116[/C][C]0.377959[/C][/ROW]
[ROW][C]9[/C][C]-0.16754[/C][C]-1.7411[/C][C]0.042254[/C][/ROW]
[ROW][C]10[/C][C]-0.142174[/C][C]-1.4775[/C][C]0.071224[/C][/ROW]
[ROW][C]11[/C][C]0.199854[/C][C]2.0769[/C][C]0.020089[/C][/ROW]
[ROW][C]12[/C][C]0.559541[/C][C]5.8149[/C][C]0[/C][/ROW]
[ROW][C]13[/C][C]0.114723[/C][C]1.1922[/C][C]0.117892[/C][/ROW]
[ROW][C]14[/C][C]-0.193785[/C][C]-2.0139[/C][C]0.023255[/C][/ROW]
[ROW][C]15[/C][C]-0.262414[/C][C]-2.7271[/C][C]0.003729[/C][/ROW]
[ROW][C]16[/C][C]-0.111741[/C][C]-1.1612[/C][C]0.124052[/C][/ROW]
[ROW][C]17[/C][C]0.135191[/C][C]1.4049[/C][C]0.081454[/C][/ROW]
[ROW][C]18[/C][C]0.33616[/C][C]3.4935[/C][C]0.000346[/C][/ROW]
[ROW][C]19[/C][C]0.051592[/C][C]0.5362[/C][C]0.296476[/C][/ROW]
[ROW][C]20[/C][C]-0.114497[/C][C]-1.1899[/C][C]0.11835[/C][/ROW]
[ROW][C]21[/C][C]-0.324648[/C][C]-3.3738[/C][C]0.000515[/C][/ROW]
[ROW][C]22[/C][C]-0.225811[/C][C]-2.3467[/C][C]0.010382[/C][/ROW]
[ROW][C]23[/C][C]0.113791[/C][C]1.1825[/C][C]0.119793[/C][/ROW]
[ROW][C]24[/C][C]0.346133[/C][C]3.5971[/C][C]0.000243[/C][/ROW]
[ROW][C]25[/C][C]0.047862[/C][C]0.4974[/C][C]0.309961[/C][/ROW]
[ROW][C]26[/C][C]-0.228288[/C][C]-2.3724[/C][C]0.00972[/C][/ROW]
[ROW][C]27[/C][C]-0.35993[/C][C]-3.7405[/C][C]0.000148[/C][/ROW]
[ROW][C]28[/C][C]-0.085983[/C][C]-0.8936[/C][C]0.186771[/C][/ROW]
[ROW][C]29[/C][C]0.055723[/C][C]0.5791[/C][C]0.281865[/C][/ROW]
[ROW][C]30[/C][C]0.210546[/C][C]2.1881[/C][C]0.01541[/C][/ROW]
[ROW][C]31[/C][C]0.077262[/C][C]0.8029[/C][C]0.211889[/C][/ROW]
[ROW][C]32[/C][C]-0.177002[/C][C]-1.8395[/C][C]0.034298[/C][/ROW]
[ROW][C]33[/C][C]-0.322971[/C][C]-3.3564[/C][C]0.000545[/C][/ROW]
[ROW][C]34[/C][C]-0.149089[/C][C]-1.5494[/C][C]0.062108[/C][/ROW]
[ROW][C]35[/C][C]0.079023[/C][C]0.8212[/C][C]0.20666[/C][/ROW]
[ROW][C]36[/C][C]0.314127[/C][C]3.2645[/C][C]0.000735[/C][/ROW]
[ROW][C]37[/C][C]0.077051[/C][C]0.8007[/C][C]0.21252[/C][/ROW]
[ROW][C]38[/C][C]-0.256854[/C][C]-2.6693[/C][C]0.004387[/C][/ROW]
[ROW][C]39[/C][C]-0.227633[/C][C]-2.3656[/C][C]0.009892[/C][/ROW]
[ROW][C]40[/C][C]-0.003295[/C][C]-0.0342[/C][C]0.486375[/C][/ROW]
[ROW][C]41[/C][C]0.076052[/C][C]0.7904[/C][C]0.215526[/C][/ROW]
[ROW][C]42[/C][C]0.240798[/C][C]2.5024[/C][C]0.006916[/C][/ROW]
[ROW][C]43[/C][C]0.099371[/C][C]1.0327[/C][C]0.152027[/C][/ROW]
[ROW][C]44[/C][C]-0.124548[/C][C]-1.2943[/C][C]0.099154[/C][/ROW]
[ROW][C]45[/C][C]-0.200528[/C][C]-2.084[/C][C]0.019762[/C][/ROW]
[ROW][C]46[/C][C]-0.030853[/C][C]-0.3206[/C][C]0.374552[/C][/ROW]
[ROW][C]47[/C][C]0.071602[/C][C]0.7441[/C][C]0.229212[/C][/ROW]
[ROW][C]48[/C][C]0.280626[/C][C]2.9164[/C][C]0.002154[/C][/ROW]
[/TABLE]
Source: https://freestatistics.org/blog/index.php?pk=277918&T=1

Globally Unique Identifier (entire table): ba.freestatistics.org/blog/index.php?pk=277918&T=1

As an alternative you can also use a QR Code:  

The GUIDs for individual cells are displayed in the table below:

Autocorrelation Function
Time lag kACF(k)T-STATP-value
10.3005773.12370.001147
2-0.043504-0.45210.326049
3-0.073753-0.76650.222537
40.0478410.49720.310035
50.3443663.57880.000259
60.5452465.66640
70.2353032.44530.008044
80.0299870.31160.377959
9-0.16754-1.74110.042254
10-0.142174-1.47750.071224
110.1998542.07690.020089
120.5595415.81490
130.1147231.19220.117892
14-0.193785-2.01390.023255
15-0.262414-2.72710.003729
16-0.111741-1.16120.124052
170.1351911.40490.081454
180.336163.49350.000346
190.0515920.53620.296476
20-0.114497-1.18990.11835
21-0.324648-3.37380.000515
22-0.225811-2.34670.010382
230.1137911.18250.119793
240.3461333.59710.000243
250.0478620.49740.309961
26-0.228288-2.37240.00972
27-0.35993-3.74050.000148
28-0.085983-0.89360.186771
290.0557230.57910.281865
300.2105462.18810.01541
310.0772620.80290.211889
32-0.177002-1.83950.034298
33-0.322971-3.35640.000545
34-0.149089-1.54940.062108
350.0790230.82120.20666
360.3141273.26450.000735
370.0770510.80070.21252
38-0.256854-2.66930.004387
39-0.227633-2.36560.009892
40-0.003295-0.03420.486375
410.0760520.79040.215526
420.2407982.50240.006916
430.0993711.03270.152027
44-0.124548-1.29430.099154
45-0.200528-2.0840.019762
46-0.030853-0.32060.374552
470.0716020.74410.229212
480.2806262.91640.002154


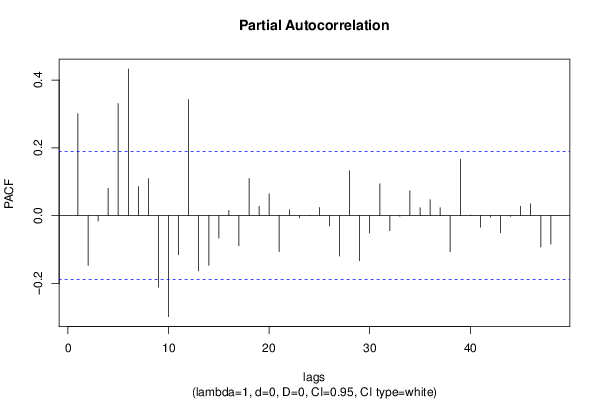
Partial Autocorrelation Function
Time lag kPACF(k)T-STATP-value
10.3005773.12370.001147
2-0.147145-1.52920.064572
3-0.01632-0.16960.432822
40.0807480.83920.201616
50.3305093.43480.000421
60.4327784.49769e-06
70.0858710.89240.187082
80.1090011.13280.129909
9-0.211351-2.19640.015099
10-0.298401-3.10110.00123
11-0.115629-1.20170.116063
120.3418333.55240.000284
13-0.163191-1.69590.04639
14-0.146976-1.52740.06479
15-0.066192-0.68790.246498
160.0151940.15790.437415
17-0.08921-0.92710.177972
180.1095741.13870.128669
190.0277560.28850.386777
200.0644010.66930.252376
21-0.106089-1.10250.136346
220.0173830.18060.428491
23-0.006282-0.06530.474034
24-0.000538-0.00560.497775
250.0239660.24910.401892
26-0.030481-0.31680.376014
27-0.119358-1.24040.108756
280.132341.37530.08594
29-0.133459-1.38690.084157
30-0.051627-0.53650.29635
310.0936020.97270.166429
32-0.044527-0.46270.322242
33-0.002181-0.02270.49098
340.073380.76260.223687
350.023140.24050.40521
360.0466740.48510.314311
370.0231470.24060.405179
38-0.106862-1.11050.134616
390.1660261.72540.043658
400.0005040.00520.497917
41-0.03436-0.35710.360865
42-0.004718-0.0490.480492
43-0.050539-0.52520.300254
44-0.002489-0.02590.489707
450.0270930.28160.389411
460.0344390.35790.360558
47-0.092808-0.96450.168478
48-0.0838-0.87090.192876

\begin{tabular}{lllllllll}
\hline
Partial Autocorrelation Function \tabularnewline
Time lag k & PACF(k) & T-STAT & P-value \tabularnewline
1 & 0.300577 & 3.1237 & 0.001147 \tabularnewline
2 & -0.147145 & -1.5292 & 0.064572 \tabularnewline
3 & -0.01632 & -0.1696 & 0.432822 \tabularnewline
4 & 0.080748 & 0.8392 & 0.201616 \tabularnewline
5 & 0.330509 & 3.4348 & 0.000421 \tabularnewline
6 & 0.432778 & 4.4976 & 9e-06 \tabularnewline
7 & 0.085871 & 0.8924 & 0.187082 \tabularnewline
8 & 0.109001 & 1.1328 & 0.129909 \tabularnewline
9 & -0.211351 & -2.1964 & 0.015099 \tabularnewline
10 & -0.298401 & -3.1011 & 0.00123 \tabularnewline
11 & -0.115629 & -1.2017 & 0.116063 \tabularnewline
12 & 0.341833 & 3.5524 & 0.000284 \tabularnewline
13 & -0.163191 & -1.6959 & 0.04639 \tabularnewline
14 & -0.146976 & -1.5274 & 0.06479 \tabularnewline
15 & -0.066192 & -0.6879 & 0.246498 \tabularnewline
16 & 0.015194 & 0.1579 & 0.437415 \tabularnewline
17 & -0.08921 & -0.9271 & 0.177972 \tabularnewline
18 & 0.109574 & 1.1387 & 0.128669 \tabularnewline
19 & 0.027756 & 0.2885 & 0.386777 \tabularnewline
20 & 0.064401 & 0.6693 & 0.252376 \tabularnewline
21 & -0.106089 & -1.1025 & 0.136346 \tabularnewline
22 & 0.017383 & 0.1806 & 0.428491 \tabularnewline
23 & -0.006282 & -0.0653 & 0.474034 \tabularnewline
24 & -0.000538 & -0.0056 & 0.497775 \tabularnewline
25 & 0.023966 & 0.2491 & 0.401892 \tabularnewline
26 & -0.030481 & -0.3168 & 0.376014 \tabularnewline
27 & -0.119358 & -1.2404 & 0.108756 \tabularnewline
28 & 0.13234 & 1.3753 & 0.08594 \tabularnewline
29 & -0.133459 & -1.3869 & 0.084157 \tabularnewline
30 & -0.051627 & -0.5365 & 0.29635 \tabularnewline
31 & 0.093602 & 0.9727 & 0.166429 \tabularnewline
32 & -0.044527 & -0.4627 & 0.322242 \tabularnewline
33 & -0.002181 & -0.0227 & 0.49098 \tabularnewline
34 & 0.07338 & 0.7626 & 0.223687 \tabularnewline
35 & 0.02314 & 0.2405 & 0.40521 \tabularnewline
36 & 0.046674 & 0.4851 & 0.314311 \tabularnewline
37 & 0.023147 & 0.2406 & 0.405179 \tabularnewline
38 & -0.106862 & -1.1105 & 0.134616 \tabularnewline
39 & 0.166026 & 1.7254 & 0.043658 \tabularnewline
40 & 0.000504 & 0.0052 & 0.497917 \tabularnewline
41 & -0.03436 & -0.3571 & 0.360865 \tabularnewline
42 & -0.004718 & -0.049 & 0.480492 \tabularnewline
43 & -0.050539 & -0.5252 & 0.300254 \tabularnewline
44 & -0.002489 & -0.0259 & 0.489707 \tabularnewline
45 & 0.027093 & 0.2816 & 0.389411 \tabularnewline
46 & 0.034439 & 0.3579 & 0.360558 \tabularnewline
47 & -0.092808 & -0.9645 & 0.168478 \tabularnewline
48 & -0.0838 & -0.8709 & 0.192876 \tabularnewline
\hline
\end{tabular}
%Source: https://freestatistics.org/blog/index.php?pk=277918&T=2

[TABLE]
[ROW][C]Partial Autocorrelation Function[/C][/ROW]
[ROW][C]Time lag k[/C][C]PACF(k)[/C][C]T-STAT[/C][C]P-value[/C][/ROW]
[ROW][C]1[/C][C]0.300577[/C][C]3.1237[/C][C]0.001147[/C][/ROW]
[ROW][C]2[/C][C]-0.147145[/C][C]-1.5292[/C][C]0.064572[/C][/ROW]
[ROW][C]3[/C][C]-0.01632[/C][C]-0.1696[/C][C]0.432822[/C][/ROW]
[ROW][C]4[/C][C]0.080748[/C][C]0.8392[/C][C]0.201616[/C][/ROW]
[ROW][C]5[/C][C]0.330509[/C][C]3.4348[/C][C]0.000421[/C][/ROW]
[ROW][C]6[/C][C]0.432778[/C][C]4.4976[/C][C]9e-06[/C][/ROW]
[ROW][C]7[/C][C]0.085871[/C][C]0.8924[/C][C]0.187082[/C][/ROW]
[ROW][C]8[/C][C]0.109001[/C][C]1.1328[/C][C]0.129909[/C][/ROW]
[ROW][C]9[/C][C]-0.211351[/C][C]-2.1964[/C][C]0.015099[/C][/ROW]
[ROW][C]10[/C][C]-0.298401[/C][C]-3.1011[/C][C]0.00123[/C][/ROW]
[ROW][C]11[/C][C]-0.115629[/C][C]-1.2017[/C][C]0.116063[/C][/ROW]
[ROW][C]12[/C][C]0.341833[/C][C]3.5524[/C][C]0.000284[/C][/ROW]
[ROW][C]13[/C][C]-0.163191[/C][C]-1.6959[/C][C]0.04639[/C][/ROW]
[ROW][C]14[/C][C]-0.146976[/C][C]-1.5274[/C][C]0.06479[/C][/ROW]
[ROW][C]15[/C][C]-0.066192[/C][C]-0.6879[/C][C]0.246498[/C][/ROW]
[ROW][C]16[/C][C]0.015194[/C][C]0.1579[/C][C]0.437415[/C][/ROW]
[ROW][C]17[/C][C]-0.08921[/C][C]-0.9271[/C][C]0.177972[/C][/ROW]
[ROW][C]18[/C][C]0.109574[/C][C]1.1387[/C][C]0.128669[/C][/ROW]
[ROW][C]19[/C][C]0.027756[/C][C]0.2885[/C][C]0.386777[/C][/ROW]
[ROW][C]20[/C][C]0.064401[/C][C]0.6693[/C][C]0.252376[/C][/ROW]
[ROW][C]21[/C][C]-0.106089[/C][C]-1.1025[/C][C]0.136346[/C][/ROW]
[ROW][C]22[/C][C]0.017383[/C][C]0.1806[/C][C]0.428491[/C][/ROW]
[ROW][C]23[/C][C]-0.006282[/C][C]-0.0653[/C][C]0.474034[/C][/ROW]
[ROW][C]24[/C][C]-0.000538[/C][C]-0.0056[/C][C]0.497775[/C][/ROW]
[ROW][C]25[/C][C]0.023966[/C][C]0.2491[/C][C]0.401892[/C][/ROW]
[ROW][C]26[/C][C]-0.030481[/C][C]-0.3168[/C][C]0.376014[/C][/ROW]
[ROW][C]27[/C][C]-0.119358[/C][C]-1.2404[/C][C]0.108756[/C][/ROW]
[ROW][C]28[/C][C]0.13234[/C][C]1.3753[/C][C]0.08594[/C][/ROW]
[ROW][C]29[/C][C]-0.133459[/C][C]-1.3869[/C][C]0.084157[/C][/ROW]
[ROW][C]30[/C][C]-0.051627[/C][C]-0.5365[/C][C]0.29635[/C][/ROW]
[ROW][C]31[/C][C]0.093602[/C][C]0.9727[/C][C]0.166429[/C][/ROW]
[ROW][C]32[/C][C]-0.044527[/C][C]-0.4627[/C][C]0.322242[/C][/ROW]
[ROW][C]33[/C][C]-0.002181[/C][C]-0.0227[/C][C]0.49098[/C][/ROW]
[ROW][C]34[/C][C]0.07338[/C][C]0.7626[/C][C]0.223687[/C][/ROW]
[ROW][C]35[/C][C]0.02314[/C][C]0.2405[/C][C]0.40521[/C][/ROW]
[ROW][C]36[/C][C]0.046674[/C][C]0.4851[/C][C]0.314311[/C][/ROW]
[ROW][C]37[/C][C]0.023147[/C][C]0.2406[/C][C]0.405179[/C][/ROW]
[ROW][C]38[/C][C]-0.106862[/C][C]-1.1105[/C][C]0.134616[/C][/ROW]
[ROW][C]39[/C][C]0.166026[/C][C]1.7254[/C][C]0.043658[/C][/ROW]
[ROW][C]40[/C][C]0.000504[/C][C]0.0052[/C][C]0.497917[/C][/ROW]
[ROW][C]41[/C][C]-0.03436[/C][C]-0.3571[/C][C]0.360865[/C][/ROW]
[ROW][C]42[/C][C]-0.004718[/C][C]-0.049[/C][C]0.480492[/C][/ROW]
[ROW][C]43[/C][C]-0.050539[/C][C]-0.5252[/C][C]0.300254[/C][/ROW]
[ROW][C]44[/C][C]-0.002489[/C][C]-0.0259[/C][C]0.489707[/C][/ROW]
[ROW][C]45[/C][C]0.027093[/C][C]0.2816[/C][C]0.389411[/C][/ROW]
[ROW][C]46[/C][C]0.034439[/C][C]0.3579[/C][C]0.360558[/C][/ROW]
[ROW][C]47[/C][C]-0.092808[/C][C]-0.9645[/C][C]0.168478[/C][/ROW]
[ROW][C]48[/C][C]-0.0838[/C][C]-0.8709[/C][C]0.192876[/C][/ROW]
[/TABLE]
Source: https://freestatistics.org/blog/index.php?pk=277918&T=2

Globally Unique Identifier (entire table): ba.freestatistics.org/blog/index.php?pk=277918&T=2

As an alternative you can also use a QR Code:  

The GUIDs for individual cells are displayed in the table below:

Partial Autocorrelation Function
Time lag kPACF(k)T-STATP-value
10.3005773.12370.001147
2-0.147145-1.52920.064572
3-0.01632-0.16960.432822
40.0807480.83920.201616
50.3305093.43480.000421
60.4327784.49769e-06
70.0858710.89240.187082
80.1090011.13280.129909
9-0.211351-2.19640.015099
10-0.298401-3.10110.00123
11-0.115629-1.20170.116063
120.3418333.55240.000284
13-0.163191-1.69590.04639
14-0.146976-1.52740.06479
15-0.066192-0.68790.246498
160.0151940.15790.437415
17-0.08921-0.92710.177972
180.1095741.13870.128669
190.0277560.28850.386777
200.0644010.66930.252376
21-0.106089-1.10250.136346
220.0173830.18060.428491
23-0.006282-0.06530.474034
24-0.000538-0.00560.497775
250.0239660.24910.401892
26-0.030481-0.31680.376014
27-0.119358-1.24040.108756
280.132341.37530.08594
29-0.133459-1.38690.084157
30-0.051627-0.53650.29635
310.0936020.97270.166429
32-0.044527-0.46270.322242
33-0.002181-0.02270.49098
340.073380.76260.223687
350.023140.24050.40521
360.0466740.48510.314311
370.0231470.24060.405179
38-0.106862-1.11050.134616
390.1660261.72540.043658
400.0005040.00520.497917
41-0.03436-0.35710.360865
42-0.004718-0.0490.480492
43-0.050539-0.52520.300254
44-0.002489-0.02590.489707
450.0270930.28160.389411
460.0344390.35790.360558
47-0.092808-0.96450.168478
48-0.0838-0.87090.192876


Parameters (Session):
par1 = 48 ; par2 = 1 ; par3 = 0 ; par4 = 0 ; par5 = 12 ; par6 = White Noise ; par7 = 0.95 ;
Parameters (R input):
par1 = 48 ; par2 = 1 ; par3 = 0 ; par4 = 0 ; par5 = 12 ; par6 = White Noise ; par7 = 0.95 ; par8 = ;
R code (references can be found in the software module):
par8 <- ''
par7 <- '0.95'
par6 <- 'White Noise'
par5 <- '12'
par4 <- '0'
par3 <- '0'
par2 <- '1'
par1 <- 'Default'
if (par1 == 'Default') {
par1 = 10*log10(length(x))
} else {
par1 <- as.numeric(par1)
}
par2 <- as.numeric(par2)
par3 <- as.numeric(par3)
par4 <- as.numeric(par4)
par5 <- as.numeric(par5)
if (par6 == 'White Noise') par6 <- 'white' else par6 <- 'ma'
par7 <- as.numeric(par7)
if (par8 != '') par8 <- as.numeric(par8)
ox <- x
if (par8 == '') {
if (par2 == 0) {
x <- log(x)
} else {
x <- (x ^ par2 - 1) / par2
}
} else {
x <- log(x,base=par8)
}
if (par3 > 0) x <- diff(x,lag=1,difference=par3)
if (par4 > 0) x <- diff(x,lag=par5,difference=par4)
bitmap(file='picts.png')
op <- par(mfrow=c(2,1))
plot(ox,type='l',main='Original Time Series',xlab='time',ylab='value')
if (par8=='') {
mytitle <- paste('Working Time Series (lambda=',par2,', d=',par3,', D=',par4,')',sep='')
mysub <- paste('(lambda=',par2,', d=',par3,', D=',par4,', CI=', par7, ', CI type=',par6,')',sep='')
} else {
mytitle <- paste('Working Time Series (base=',par8,', d=',par3,', D=',par4,')',sep='')
mysub <- paste('(base=',par8,', d=',par3,', D=',par4,', CI=', par7, ', CI type=',par6,')',sep='')
}
plot(x,type='l', main=mytitle,xlab='time',ylab='value')
par(op)
dev.off()
bitmap(file='pic1.png')
racf <- acf(x, par1, main='Autocorrelation', xlab='time lag', ylab='ACF', ci.type=par6, ci=par7, sub=mysub)
dev.off()
bitmap(file='pic2.png')
rpacf <- pacf(x,par1,main='Partial Autocorrelation',xlab='lags',ylab='PACF',sub=mysub)
dev.off()
(myacf <- c(racf$acf))
(mypacf <- c(rpacf$acf))
lengthx <- length(x)
sqrtn <- sqrt(lengthx)
load(file='createtable')
a<-table.start()
a<-table.row.start(a)
a<-table.element(a,'Autocorrelation Function',4,TRUE)
a<-table.row.end(a)
a<-table.row.start(a)
a<-table.element(a,'Time lag k',header=TRUE)
a<-table.element(a,hyperlink('basics.htm','ACF(k)','click here for more information about the Autocorrelation Function'),header=TRUE)
a<-table.element(a,'T-STAT',header=TRUE)
a<-table.element(a,'P-value',header=TRUE)
a<-table.row.end(a)
for (i in 2:(par1+1)) {
a<-table.row.start(a)
a<-table.element(a,i-1,header=TRUE)
a<-table.element(a,round(myacf[i],6))
mytstat <- myacf[i]*sqrtn
a<-table.element(a,round(mytstat,4))
a<-table.element(a,round(1-pt(abs(mytstat),lengthx),6))
a<-table.row.end(a)
}
a<-table.end(a)
table.save(a,file='mytable.tab')
a<-table.start()
a<-table.row.start(a)
a<-table.element(a,'Partial Autocorrelation Function',4,TRUE)
a<-table.row.end(a)
a<-table.row.start(a)
a<-table.element(a,'Time lag k',header=TRUE)
a<-table.element(a,hyperlink('basics.htm','PACF(k)','click here for more information about the Partial Autocorrelation Function'),header=TRUE)
a<-table.element(a,'T-STAT',header=TRUE)
a<-table.element(a,'P-value',header=TRUE)
a<-table.row.end(a)
for (i in 1:par1) {
a<-table.row.start(a)
a<-table.element(a,i,header=TRUE)
a<-table.element(a,round(mypacf[i],6))
mytstat <- mypacf[i]*sqrtn
a<-table.element(a,round(mytstat,4))
a<-table.element(a,round(1-pt(abs(mytstat),lengthx),6))
a<-table.row.end(a)
}
a<-table.end(a)
table.save(a,file='mytable1.tab')