Free Statistics

of Irreproducible Research!

Author's title

Author*Unverified author*
R Software Modulerwasp_autocorrelation.wasp
Title produced by software(Partial) Autocorrelation Function
Date of computationThu, 05 Mar 2015 09:17:08 +0000
Cite this page as followsStatistical Computations at FreeStatistics.org, Office for Research Development and Education, URL https://freestatistics.org/blog/index.php?v=date/2015/Mar/05/t1425547722fi4v4re2ocmfvd9.htm/, Retrieved Fri, 17 May 2024 15:20:06 +0000
Statistical Computations at FreeStatistics.org, Office for Research Development and Education, URL https://freestatistics.org/blog/index.php?pk=277922, Retrieved Fri, 17 May 2024 15:20:06 +0000
QR Codes:

Original text written by user:
IsPrivate?No (this computation is public)
User-defined keywords
Estimated Impact106
Family? (F = Feedback message, R = changed R code, M = changed R Module, P = changed Parameters, D = changed Data)
-       [(Partial) Autocorrelation Function] [Opgave 7 oef 2] [2015-03-05 09:17:08] [2dcc5595e1714d1f573b61116e4d8205] [Current]
Feedback Forum

Post a new message
Dataseries X:
790
766
1040
949
758
1023
921
775
907
835
871
836
789
811
996
778
603
990
735
800
706
766
870
647
726
784
884
696
893
674
703
799
793
799
1022
758
1021
944
915
864
1022
891
1087
822
890
1092
967
833
1104
1063
1103
1039
1185
1047
1155
878
879
1133
920
943
938
900
781
1040
792
653
866
679
799
760
697
750


Summary of computational transaction
Raw Inputview raw input (R code)
Raw Outputview raw output of R engine
Computing time1 seconds
R Server'Sir Maurice George Kendall' @ kendall.wessa.net

\begin{tabular}{lllllllll}
\hline
Summary of computational transaction \tabularnewline
Raw Input & view raw input (R code)  \tabularnewline
Raw Output & view raw output of R engine  \tabularnewline
Computing time & 1 seconds \tabularnewline
R Server & 'Sir Maurice George Kendall' @ kendall.wessa.net \tabularnewline
\hline
\end{tabular}
%Source: https://freestatistics.org/blog/index.php?pk=277922&T=0

[TABLE]
[ROW][C]Summary of computational transaction[/C][/ROW]
[ROW][C]Raw Input[/C][C]view raw input (R code) [/C][/ROW]
[ROW][C]Raw Output[/C][C]view raw output of R engine [/C][/ROW]
[ROW][C]Computing time[/C][C]1 seconds[/C][/ROW]
[ROW][C]R Server[/C][C]'Sir Maurice George Kendall' @ kendall.wessa.net[/C][/ROW]
[/TABLE]
Source: https://freestatistics.org/blog/index.php?pk=277922&T=0

Globally Unique Identifier (entire table): ba.freestatistics.org/blog/index.php?pk=277922&T=0

As an alternative you can also use a QR Code:  

The GUIDs for individual cells are displayed in the table below:

Summary of computational transaction
Raw Inputview raw input (R code)
Raw Outputview raw output of R engine
Computing time1 seconds
R Server'Sir Maurice George Kendall' @ kendall.wessa.net


Autocorrelation Function
Time lag kACF(k)T-STATP-value
1-0.565819-4.76775e-06
2-0.041152-0.34680.3649
30.2224171.87410.032514
4-0.057945-0.48830.313438
5-0.097649-0.82280.206688
60.1961461.65280.051399
7-0.238891-2.01290.023957
80.0820730.69160.245734
90.2244921.89160.031311
10-0.305353-2.57290.006087
110.0181750.15310.439361
120.3499172.94850.00216
13-0.430179-3.62480.00027
140.2260131.90440.030454
15-0.007232-0.06090.47579
16-0.094162-0.79340.215087
170.0926260.78050.218851
18-0.028051-0.23640.406916
19-0.093056-0.78410.217794
200.1378961.16190.124576
21-0.035033-0.29520.384354
22-0.185075-1.55950.061666
230.2381562.00670.024293
24-0.056516-0.47620.317693
25-0.143908-1.21260.114652
260.1839531.550.062792
27-0.129781-1.09360.138924
280.0472480.39810.345869
290.0467120.39360.347527
30-0.1662-1.40040.08287
310.0995080.83850.202291
320.1105210.93130.177435
33-0.152658-1.28630.101255
34-0.040703-0.3430.366318
350.194951.64270.052436
36-0.167239-1.40920.081573
370.0861170.72560.235223
38-0.01086-0.09150.463672
39-0.111132-0.93640.176116
400.2267211.91040.030061
41-0.179146-1.50950.067803
420.002690.02270.490991
430.0796470.67110.252162
440.0124410.10480.458402
45-0.134844-1.13620.129843
460.1473391.24150.109254
47-0.015159-0.12770.44936
48-0.127478-1.07410.143197

\begin{tabular}{lllllllll}
\hline
Autocorrelation Function \tabularnewline
Time lag k & ACF(k) & T-STAT & P-value \tabularnewline
1 & -0.565819 & -4.7677 & 5e-06 \tabularnewline
2 & -0.041152 & -0.3468 & 0.3649 \tabularnewline
3 & 0.222417 & 1.8741 & 0.032514 \tabularnewline
4 & -0.057945 & -0.4883 & 0.313438 \tabularnewline
5 & -0.097649 & -0.8228 & 0.206688 \tabularnewline
6 & 0.196146 & 1.6528 & 0.051399 \tabularnewline
7 & -0.238891 & -2.0129 & 0.023957 \tabularnewline
8 & 0.082073 & 0.6916 & 0.245734 \tabularnewline
9 & 0.224492 & 1.8916 & 0.031311 \tabularnewline
10 & -0.305353 & -2.5729 & 0.006087 \tabularnewline
11 & 0.018175 & 0.1531 & 0.439361 \tabularnewline
12 & 0.349917 & 2.9485 & 0.00216 \tabularnewline
13 & -0.430179 & -3.6248 & 0.00027 \tabularnewline
14 & 0.226013 & 1.9044 & 0.030454 \tabularnewline
15 & -0.007232 & -0.0609 & 0.47579 \tabularnewline
16 & -0.094162 & -0.7934 & 0.215087 \tabularnewline
17 & 0.092626 & 0.7805 & 0.218851 \tabularnewline
18 & -0.028051 & -0.2364 & 0.406916 \tabularnewline
19 & -0.093056 & -0.7841 & 0.217794 \tabularnewline
20 & 0.137896 & 1.1619 & 0.124576 \tabularnewline
21 & -0.035033 & -0.2952 & 0.384354 \tabularnewline
22 & -0.185075 & -1.5595 & 0.061666 \tabularnewline
23 & 0.238156 & 2.0067 & 0.024293 \tabularnewline
24 & -0.056516 & -0.4762 & 0.317693 \tabularnewline
25 & -0.143908 & -1.2126 & 0.114652 \tabularnewline
26 & 0.183953 & 1.55 & 0.062792 \tabularnewline
27 & -0.129781 & -1.0936 & 0.138924 \tabularnewline
28 & 0.047248 & 0.3981 & 0.345869 \tabularnewline
29 & 0.046712 & 0.3936 & 0.347527 \tabularnewline
30 & -0.1662 & -1.4004 & 0.08287 \tabularnewline
31 & 0.099508 & 0.8385 & 0.202291 \tabularnewline
32 & 0.110521 & 0.9313 & 0.177435 \tabularnewline
33 & -0.152658 & -1.2863 & 0.101255 \tabularnewline
34 & -0.040703 & -0.343 & 0.366318 \tabularnewline
35 & 0.19495 & 1.6427 & 0.052436 \tabularnewline
36 & -0.167239 & -1.4092 & 0.081573 \tabularnewline
37 & 0.086117 & 0.7256 & 0.235223 \tabularnewline
38 & -0.01086 & -0.0915 & 0.463672 \tabularnewline
39 & -0.111132 & -0.9364 & 0.176116 \tabularnewline
40 & 0.226721 & 1.9104 & 0.030061 \tabularnewline
41 & -0.179146 & -1.5095 & 0.067803 \tabularnewline
42 & 0.00269 & 0.0227 & 0.490991 \tabularnewline
43 & 0.079647 & 0.6711 & 0.252162 \tabularnewline
44 & 0.012441 & 0.1048 & 0.458402 \tabularnewline
45 & -0.134844 & -1.1362 & 0.129843 \tabularnewline
46 & 0.147339 & 1.2415 & 0.109254 \tabularnewline
47 & -0.015159 & -0.1277 & 0.44936 \tabularnewline
48 & -0.127478 & -1.0741 & 0.143197 \tabularnewline
\hline
\end{tabular}
%Source: https://freestatistics.org/blog/index.php?pk=277922&T=1

[TABLE]
[ROW][C]Autocorrelation Function[/C][/ROW]
[ROW][C]Time lag k[/C][C]ACF(k)[/C][C]T-STAT[/C][C]P-value[/C][/ROW]
[ROW][C]1[/C][C]-0.565819[/C][C]-4.7677[/C][C]5e-06[/C][/ROW]
[ROW][C]2[/C][C]-0.041152[/C][C]-0.3468[/C][C]0.3649[/C][/ROW]
[ROW][C]3[/C][C]0.222417[/C][C]1.8741[/C][C]0.032514[/C][/ROW]
[ROW][C]4[/C][C]-0.057945[/C][C]-0.4883[/C][C]0.313438[/C][/ROW]
[ROW][C]5[/C][C]-0.097649[/C][C]-0.8228[/C][C]0.206688[/C][/ROW]
[ROW][C]6[/C][C]0.196146[/C][C]1.6528[/C][C]0.051399[/C][/ROW]
[ROW][C]7[/C][C]-0.238891[/C][C]-2.0129[/C][C]0.023957[/C][/ROW]
[ROW][C]8[/C][C]0.082073[/C][C]0.6916[/C][C]0.245734[/C][/ROW]
[ROW][C]9[/C][C]0.224492[/C][C]1.8916[/C][C]0.031311[/C][/ROW]
[ROW][C]10[/C][C]-0.305353[/C][C]-2.5729[/C][C]0.006087[/C][/ROW]
[ROW][C]11[/C][C]0.018175[/C][C]0.1531[/C][C]0.439361[/C][/ROW]
[ROW][C]12[/C][C]0.349917[/C][C]2.9485[/C][C]0.00216[/C][/ROW]
[ROW][C]13[/C][C]-0.430179[/C][C]-3.6248[/C][C]0.00027[/C][/ROW]
[ROW][C]14[/C][C]0.226013[/C][C]1.9044[/C][C]0.030454[/C][/ROW]
[ROW][C]15[/C][C]-0.007232[/C][C]-0.0609[/C][C]0.47579[/C][/ROW]
[ROW][C]16[/C][C]-0.094162[/C][C]-0.7934[/C][C]0.215087[/C][/ROW]
[ROW][C]17[/C][C]0.092626[/C][C]0.7805[/C][C]0.218851[/C][/ROW]
[ROW][C]18[/C][C]-0.028051[/C][C]-0.2364[/C][C]0.406916[/C][/ROW]
[ROW][C]19[/C][C]-0.093056[/C][C]-0.7841[/C][C]0.217794[/C][/ROW]
[ROW][C]20[/C][C]0.137896[/C][C]1.1619[/C][C]0.124576[/C][/ROW]
[ROW][C]21[/C][C]-0.035033[/C][C]-0.2952[/C][C]0.384354[/C][/ROW]
[ROW][C]22[/C][C]-0.185075[/C][C]-1.5595[/C][C]0.061666[/C][/ROW]
[ROW][C]23[/C][C]0.238156[/C][C]2.0067[/C][C]0.024293[/C][/ROW]
[ROW][C]24[/C][C]-0.056516[/C][C]-0.4762[/C][C]0.317693[/C][/ROW]
[ROW][C]25[/C][C]-0.143908[/C][C]-1.2126[/C][C]0.114652[/C][/ROW]
[ROW][C]26[/C][C]0.183953[/C][C]1.55[/C][C]0.062792[/C][/ROW]
[ROW][C]27[/C][C]-0.129781[/C][C]-1.0936[/C][C]0.138924[/C][/ROW]
[ROW][C]28[/C][C]0.047248[/C][C]0.3981[/C][C]0.345869[/C][/ROW]
[ROW][C]29[/C][C]0.046712[/C][C]0.3936[/C][C]0.347527[/C][/ROW]
[ROW][C]30[/C][C]-0.1662[/C][C]-1.4004[/C][C]0.08287[/C][/ROW]
[ROW][C]31[/C][C]0.099508[/C][C]0.8385[/C][C]0.202291[/C][/ROW]
[ROW][C]32[/C][C]0.110521[/C][C]0.9313[/C][C]0.177435[/C][/ROW]
[ROW][C]33[/C][C]-0.152658[/C][C]-1.2863[/C][C]0.101255[/C][/ROW]
[ROW][C]34[/C][C]-0.040703[/C][C]-0.343[/C][C]0.366318[/C][/ROW]
[ROW][C]35[/C][C]0.19495[/C][C]1.6427[/C][C]0.052436[/C][/ROW]
[ROW][C]36[/C][C]-0.167239[/C][C]-1.4092[/C][C]0.081573[/C][/ROW]
[ROW][C]37[/C][C]0.086117[/C][C]0.7256[/C][C]0.235223[/C][/ROW]
[ROW][C]38[/C][C]-0.01086[/C][C]-0.0915[/C][C]0.463672[/C][/ROW]
[ROW][C]39[/C][C]-0.111132[/C][C]-0.9364[/C][C]0.176116[/C][/ROW]
[ROW][C]40[/C][C]0.226721[/C][C]1.9104[/C][C]0.030061[/C][/ROW]
[ROW][C]41[/C][C]-0.179146[/C][C]-1.5095[/C][C]0.067803[/C][/ROW]
[ROW][C]42[/C][C]0.00269[/C][C]0.0227[/C][C]0.490991[/C][/ROW]
[ROW][C]43[/C][C]0.079647[/C][C]0.6711[/C][C]0.252162[/C][/ROW]
[ROW][C]44[/C][C]0.012441[/C][C]0.1048[/C][C]0.458402[/C][/ROW]
[ROW][C]45[/C][C]-0.134844[/C][C]-1.1362[/C][C]0.129843[/C][/ROW]
[ROW][C]46[/C][C]0.147339[/C][C]1.2415[/C][C]0.109254[/C][/ROW]
[ROW][C]47[/C][C]-0.015159[/C][C]-0.1277[/C][C]0.44936[/C][/ROW]
[ROW][C]48[/C][C]-0.127478[/C][C]-1.0741[/C][C]0.143197[/C][/ROW]
[/TABLE]
Source: https://freestatistics.org/blog/index.php?pk=277922&T=1

Globally Unique Identifier (entire table): ba.freestatistics.org/blog/index.php?pk=277922&T=1

As an alternative you can also use a QR Code:  

The GUIDs for individual cells are displayed in the table below:

Autocorrelation Function
Time lag kACF(k)T-STATP-value
1-0.565819-4.76775e-06
2-0.041152-0.34680.3649
30.2224171.87410.032514
4-0.057945-0.48830.313438
5-0.097649-0.82280.206688
60.1961461.65280.051399
7-0.238891-2.01290.023957
80.0820730.69160.245734
90.2244921.89160.031311
10-0.305353-2.57290.006087
110.0181750.15310.439361
120.3499172.94850.00216
13-0.430179-3.62480.00027
140.2260131.90440.030454
15-0.007232-0.06090.47579
16-0.094162-0.79340.215087
170.0926260.78050.218851
18-0.028051-0.23640.406916
19-0.093056-0.78410.217794
200.1378961.16190.124576
21-0.035033-0.29520.384354
22-0.185075-1.55950.061666
230.2381562.00670.024293
24-0.056516-0.47620.317693
25-0.143908-1.21260.114652
260.1839531.550.062792
27-0.129781-1.09360.138924
280.0472480.39810.345869
290.0467120.39360.347527
30-0.1662-1.40040.08287
310.0995080.83850.202291
320.1105210.93130.177435
33-0.152658-1.28630.101255
34-0.040703-0.3430.366318
350.194951.64270.052436
36-0.167239-1.40920.081573
370.0861170.72560.235223
38-0.01086-0.09150.463672
39-0.111132-0.93640.176116
400.2267211.91040.030061
41-0.179146-1.50950.067803
420.002690.02270.490991
430.0796470.67110.252162
440.0124410.10480.458402
45-0.134844-1.13620.129843
460.1473391.24150.109254
47-0.015159-0.12770.44936
48-0.127478-1.07410.143197


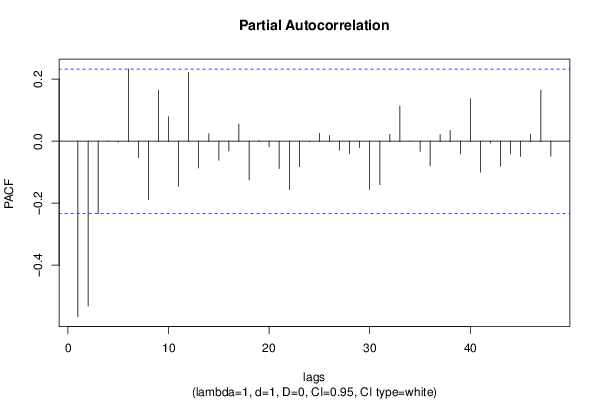
Partial Autocorrelation Function
Time lag kPACF(k)T-STATP-value
1-0.565819-4.76775e-06
2-0.531446-4.4781.4e-05
3-0.23357-1.96810.026481
47.7e-056e-040.499743
5-0.003057-0.02580.48976
60.2329311.96270.026799
7-0.052926-0.4460.328491
8-0.188557-1.58880.058274
90.1647741.38840.084676
100.0789970.66560.253899
11-0.145695-1.22760.111817
120.2213851.86540.033127
13-0.086323-0.72740.234696
140.0240690.20280.419933
15-0.061486-0.51810.303003
16-0.03119-0.26280.396727
170.0555930.46840.320455
18-0.12539-1.05660.147148
190.0012470.01050.495824
20-0.018038-0.1520.439811
21-0.088003-0.74150.23041
22-0.156259-1.31670.096093
23-0.081999-0.69090.245928
24-0.001895-0.0160.493654
250.0252530.21280.41605
260.0184680.15560.438388
27-0.028939-0.24380.404028
28-0.039993-0.3370.368559
29-0.02025-0.17060.432501
30-0.155387-1.30930.097325
31-0.140187-1.18120.120725
320.0225390.18990.424959
330.1135870.95710.170882
340.0001560.00130.499478
35-0.032817-0.27650.391477
36-0.079845-0.67280.251634
370.021610.18210.428015
380.0345090.29080.386035
39-0.040998-0.34550.365388
400.1368041.15270.126443
41-0.099892-0.84170.20139
42-0.00556-0.04680.481384
43-0.080855-0.68130.24895
44-0.041051-0.34590.365221
45-0.049283-0.41530.339601
460.0225820.19030.424818
470.1647111.38790.084757
48-0.048602-0.40950.341694

\begin{tabular}{lllllllll}
\hline
Partial Autocorrelation Function \tabularnewline
Time lag k & PACF(k) & T-STAT & P-value \tabularnewline
1 & -0.565819 & -4.7677 & 5e-06 \tabularnewline
2 & -0.531446 & -4.478 & 1.4e-05 \tabularnewline
3 & -0.23357 & -1.9681 & 0.026481 \tabularnewline
4 & 7.7e-05 & 6e-04 & 0.499743 \tabularnewline
5 & -0.003057 & -0.0258 & 0.48976 \tabularnewline
6 & 0.232931 & 1.9627 & 0.026799 \tabularnewline
7 & -0.052926 & -0.446 & 0.328491 \tabularnewline
8 & -0.188557 & -1.5888 & 0.058274 \tabularnewline
9 & 0.164774 & 1.3884 & 0.084676 \tabularnewline
10 & 0.078997 & 0.6656 & 0.253899 \tabularnewline
11 & -0.145695 & -1.2276 & 0.111817 \tabularnewline
12 & 0.221385 & 1.8654 & 0.033127 \tabularnewline
13 & -0.086323 & -0.7274 & 0.234696 \tabularnewline
14 & 0.024069 & 0.2028 & 0.419933 \tabularnewline
15 & -0.061486 & -0.5181 & 0.303003 \tabularnewline
16 & -0.03119 & -0.2628 & 0.396727 \tabularnewline
17 & 0.055593 & 0.4684 & 0.320455 \tabularnewline
18 & -0.12539 & -1.0566 & 0.147148 \tabularnewline
19 & 0.001247 & 0.0105 & 0.495824 \tabularnewline
20 & -0.018038 & -0.152 & 0.439811 \tabularnewline
21 & -0.088003 & -0.7415 & 0.23041 \tabularnewline
22 & -0.156259 & -1.3167 & 0.096093 \tabularnewline
23 & -0.081999 & -0.6909 & 0.245928 \tabularnewline
24 & -0.001895 & -0.016 & 0.493654 \tabularnewline
25 & 0.025253 & 0.2128 & 0.41605 \tabularnewline
26 & 0.018468 & 0.1556 & 0.438388 \tabularnewline
27 & -0.028939 & -0.2438 & 0.404028 \tabularnewline
28 & -0.039993 & -0.337 & 0.368559 \tabularnewline
29 & -0.02025 & -0.1706 & 0.432501 \tabularnewline
30 & -0.155387 & -1.3093 & 0.097325 \tabularnewline
31 & -0.140187 & -1.1812 & 0.120725 \tabularnewline
32 & 0.022539 & 0.1899 & 0.424959 \tabularnewline
33 & 0.113587 & 0.9571 & 0.170882 \tabularnewline
34 & 0.000156 & 0.0013 & 0.499478 \tabularnewline
35 & -0.032817 & -0.2765 & 0.391477 \tabularnewline
36 & -0.079845 & -0.6728 & 0.251634 \tabularnewline
37 & 0.02161 & 0.1821 & 0.428015 \tabularnewline
38 & 0.034509 & 0.2908 & 0.386035 \tabularnewline
39 & -0.040998 & -0.3455 & 0.365388 \tabularnewline
40 & 0.136804 & 1.1527 & 0.126443 \tabularnewline
41 & -0.099892 & -0.8417 & 0.20139 \tabularnewline
42 & -0.00556 & -0.0468 & 0.481384 \tabularnewline
43 & -0.080855 & -0.6813 & 0.24895 \tabularnewline
44 & -0.041051 & -0.3459 & 0.365221 \tabularnewline
45 & -0.049283 & -0.4153 & 0.339601 \tabularnewline
46 & 0.022582 & 0.1903 & 0.424818 \tabularnewline
47 & 0.164711 & 1.3879 & 0.084757 \tabularnewline
48 & -0.048602 & -0.4095 & 0.341694 \tabularnewline
\hline
\end{tabular}
%Source: https://freestatistics.org/blog/index.php?pk=277922&T=2

[TABLE]
[ROW][C]Partial Autocorrelation Function[/C][/ROW]
[ROW][C]Time lag k[/C][C]PACF(k)[/C][C]T-STAT[/C][C]P-value[/C][/ROW]
[ROW][C]1[/C][C]-0.565819[/C][C]-4.7677[/C][C]5e-06[/C][/ROW]
[ROW][C]2[/C][C]-0.531446[/C][C]-4.478[/C][C]1.4e-05[/C][/ROW]
[ROW][C]3[/C][C]-0.23357[/C][C]-1.9681[/C][C]0.026481[/C][/ROW]
[ROW][C]4[/C][C]7.7e-05[/C][C]6e-04[/C][C]0.499743[/C][/ROW]
[ROW][C]5[/C][C]-0.003057[/C][C]-0.0258[/C][C]0.48976[/C][/ROW]
[ROW][C]6[/C][C]0.232931[/C][C]1.9627[/C][C]0.026799[/C][/ROW]
[ROW][C]7[/C][C]-0.052926[/C][C]-0.446[/C][C]0.328491[/C][/ROW]
[ROW][C]8[/C][C]-0.188557[/C][C]-1.5888[/C][C]0.058274[/C][/ROW]
[ROW][C]9[/C][C]0.164774[/C][C]1.3884[/C][C]0.084676[/C][/ROW]
[ROW][C]10[/C][C]0.078997[/C][C]0.6656[/C][C]0.253899[/C][/ROW]
[ROW][C]11[/C][C]-0.145695[/C][C]-1.2276[/C][C]0.111817[/C][/ROW]
[ROW][C]12[/C][C]0.221385[/C][C]1.8654[/C][C]0.033127[/C][/ROW]
[ROW][C]13[/C][C]-0.086323[/C][C]-0.7274[/C][C]0.234696[/C][/ROW]
[ROW][C]14[/C][C]0.024069[/C][C]0.2028[/C][C]0.419933[/C][/ROW]
[ROW][C]15[/C][C]-0.061486[/C][C]-0.5181[/C][C]0.303003[/C][/ROW]
[ROW][C]16[/C][C]-0.03119[/C][C]-0.2628[/C][C]0.396727[/C][/ROW]
[ROW][C]17[/C][C]0.055593[/C][C]0.4684[/C][C]0.320455[/C][/ROW]
[ROW][C]18[/C][C]-0.12539[/C][C]-1.0566[/C][C]0.147148[/C][/ROW]
[ROW][C]19[/C][C]0.001247[/C][C]0.0105[/C][C]0.495824[/C][/ROW]
[ROW][C]20[/C][C]-0.018038[/C][C]-0.152[/C][C]0.439811[/C][/ROW]
[ROW][C]21[/C][C]-0.088003[/C][C]-0.7415[/C][C]0.23041[/C][/ROW]
[ROW][C]22[/C][C]-0.156259[/C][C]-1.3167[/C][C]0.096093[/C][/ROW]
[ROW][C]23[/C][C]-0.081999[/C][C]-0.6909[/C][C]0.245928[/C][/ROW]
[ROW][C]24[/C][C]-0.001895[/C][C]-0.016[/C][C]0.493654[/C][/ROW]
[ROW][C]25[/C][C]0.025253[/C][C]0.2128[/C][C]0.41605[/C][/ROW]
[ROW][C]26[/C][C]0.018468[/C][C]0.1556[/C][C]0.438388[/C][/ROW]
[ROW][C]27[/C][C]-0.028939[/C][C]-0.2438[/C][C]0.404028[/C][/ROW]
[ROW][C]28[/C][C]-0.039993[/C][C]-0.337[/C][C]0.368559[/C][/ROW]
[ROW][C]29[/C][C]-0.02025[/C][C]-0.1706[/C][C]0.432501[/C][/ROW]
[ROW][C]30[/C][C]-0.155387[/C][C]-1.3093[/C][C]0.097325[/C][/ROW]
[ROW][C]31[/C][C]-0.140187[/C][C]-1.1812[/C][C]0.120725[/C][/ROW]
[ROW][C]32[/C][C]0.022539[/C][C]0.1899[/C][C]0.424959[/C][/ROW]
[ROW][C]33[/C][C]0.113587[/C][C]0.9571[/C][C]0.170882[/C][/ROW]
[ROW][C]34[/C][C]0.000156[/C][C]0.0013[/C][C]0.499478[/C][/ROW]
[ROW][C]35[/C][C]-0.032817[/C][C]-0.2765[/C][C]0.391477[/C][/ROW]
[ROW][C]36[/C][C]-0.079845[/C][C]-0.6728[/C][C]0.251634[/C][/ROW]
[ROW][C]37[/C][C]0.02161[/C][C]0.1821[/C][C]0.428015[/C][/ROW]
[ROW][C]38[/C][C]0.034509[/C][C]0.2908[/C][C]0.386035[/C][/ROW]
[ROW][C]39[/C][C]-0.040998[/C][C]-0.3455[/C][C]0.365388[/C][/ROW]
[ROW][C]40[/C][C]0.136804[/C][C]1.1527[/C][C]0.126443[/C][/ROW]
[ROW][C]41[/C][C]-0.099892[/C][C]-0.8417[/C][C]0.20139[/C][/ROW]
[ROW][C]42[/C][C]-0.00556[/C][C]-0.0468[/C][C]0.481384[/C][/ROW]
[ROW][C]43[/C][C]-0.080855[/C][C]-0.6813[/C][C]0.24895[/C][/ROW]
[ROW][C]44[/C][C]-0.041051[/C][C]-0.3459[/C][C]0.365221[/C][/ROW]
[ROW][C]45[/C][C]-0.049283[/C][C]-0.4153[/C][C]0.339601[/C][/ROW]
[ROW][C]46[/C][C]0.022582[/C][C]0.1903[/C][C]0.424818[/C][/ROW]
[ROW][C]47[/C][C]0.164711[/C][C]1.3879[/C][C]0.084757[/C][/ROW]
[ROW][C]48[/C][C]-0.048602[/C][C]-0.4095[/C][C]0.341694[/C][/ROW]
[/TABLE]
Source: https://freestatistics.org/blog/index.php?pk=277922&T=2

Globally Unique Identifier (entire table): ba.freestatistics.org/blog/index.php?pk=277922&T=2

As an alternative you can also use a QR Code:  

The GUIDs for individual cells are displayed in the table below:

Partial Autocorrelation Function
Time lag kPACF(k)T-STATP-value
1-0.565819-4.76775e-06
2-0.531446-4.4781.4e-05
3-0.23357-1.96810.026481
47.7e-056e-040.499743
5-0.003057-0.02580.48976
60.2329311.96270.026799
7-0.052926-0.4460.328491
8-0.188557-1.58880.058274
90.1647741.38840.084676
100.0789970.66560.253899
11-0.145695-1.22760.111817
120.2213851.86540.033127
13-0.086323-0.72740.234696
140.0240690.20280.419933
15-0.061486-0.51810.303003
16-0.03119-0.26280.396727
170.0555930.46840.320455
18-0.12539-1.05660.147148
190.0012470.01050.495824
20-0.018038-0.1520.439811
21-0.088003-0.74150.23041
22-0.156259-1.31670.096093
23-0.081999-0.69090.245928
24-0.001895-0.0160.493654
250.0252530.21280.41605
260.0184680.15560.438388
27-0.028939-0.24380.404028
28-0.039993-0.3370.368559
29-0.02025-0.17060.432501
30-0.155387-1.30930.097325
31-0.140187-1.18120.120725
320.0225390.18990.424959
330.1135870.95710.170882
340.0001560.00130.499478
35-0.032817-0.27650.391477
36-0.079845-0.67280.251634
370.021610.18210.428015
380.0345090.29080.386035
39-0.040998-0.34550.365388
400.1368041.15270.126443
41-0.099892-0.84170.20139
42-0.00556-0.04680.481384
43-0.080855-0.68130.24895
44-0.041051-0.34590.365221
45-0.049283-0.41530.339601
460.0225820.19030.424818
470.1647111.38790.084757
48-0.048602-0.40950.341694


Parameters (Session):
par1 = 48 ; par2 = 1 ; par3 = 1 ; par4 = 0 ; par5 = 12 ; par6 = White Noise ; par7 = 0.95 ;
Parameters (R input):
par1 = 48 ; par2 = 1 ; par3 = 1 ; par4 = 0 ; par5 = 12 ; par6 = White Noise ; par7 = 0.95 ; par8 = ;
R code (references can be found in the software module):
if (par1 == 'Default') {
par1 = 10*log10(length(x))
} else {
par1 <- as.numeric(par1)
}
par2 <- as.numeric(par2)
par3 <- as.numeric(par3)
par4 <- as.numeric(par4)
par5 <- as.numeric(par5)
if (par6 == 'White Noise') par6 <- 'white' else par6 <- 'ma'
par7 <- as.numeric(par7)
if (par8 != '') par8 <- as.numeric(par8)
ox <- x
if (par8 == '') {
if (par2 == 0) {
x <- log(x)
} else {
x <- (x ^ par2 - 1) / par2
}
} else {
x <- log(x,base=par8)
}
if (par3 > 0) x <- diff(x,lag=1,difference=par3)
if (par4 > 0) x <- diff(x,lag=par5,difference=par4)
bitmap(file='picts.png')
op <- par(mfrow=c(2,1))
plot(ox,type='l',main='Original Time Series',xlab='time',ylab='value')
if (par8=='') {
mytitle <- paste('Working Time Series (lambda=',par2,', d=',par3,', D=',par4,')',sep='')
mysub <- paste('(lambda=',par2,', d=',par3,', D=',par4,', CI=', par7, ', CI type=',par6,')',sep='')
} else {
mytitle <- paste('Working Time Series (base=',par8,', d=',par3,', D=',par4,')',sep='')
mysub <- paste('(base=',par8,', d=',par3,', D=',par4,', CI=', par7, ', CI type=',par6,')',sep='')
}
plot(x,type='l', main=mytitle,xlab='time',ylab='value')
par(op)
dev.off()
bitmap(file='pic1.png')
racf <- acf(x, par1, main='Autocorrelation', xlab='time lag', ylab='ACF', ci.type=par6, ci=par7, sub=mysub)
dev.off()
bitmap(file='pic2.png')
rpacf <- pacf(x,par1,main='Partial Autocorrelation',xlab='lags',ylab='PACF',sub=mysub)
dev.off()
(myacf <- c(racf$acf))
(mypacf <- c(rpacf$acf))
lengthx <- length(x)
sqrtn <- sqrt(lengthx)
load(file='createtable')
a<-table.start()
a<-table.row.start(a)
a<-table.element(a,'Autocorrelation Function',4,TRUE)
a<-table.row.end(a)
a<-table.row.start(a)
a<-table.element(a,'Time lag k',header=TRUE)
a<-table.element(a,hyperlink('basics.htm','ACF(k)','click here for more information about the Autocorrelation Function'),header=TRUE)
a<-table.element(a,'T-STAT',header=TRUE)
a<-table.element(a,'P-value',header=TRUE)
a<-table.row.end(a)
for (i in 2:(par1+1)) {
a<-table.row.start(a)
a<-table.element(a,i-1,header=TRUE)
a<-table.element(a,round(myacf[i],6))
mytstat <- myacf[i]*sqrtn
a<-table.element(a,round(mytstat,4))
a<-table.element(a,round(1-pt(abs(mytstat),lengthx),6))
a<-table.row.end(a)
}
a<-table.end(a)
table.save(a,file='mytable.tab')
a<-table.start()
a<-table.row.start(a)
a<-table.element(a,'Partial Autocorrelation Function',4,TRUE)
a<-table.row.end(a)
a<-table.row.start(a)
a<-table.element(a,'Time lag k',header=TRUE)
a<-table.element(a,hyperlink('basics.htm','PACF(k)','click here for more information about the Partial Autocorrelation Function'),header=TRUE)
a<-table.element(a,'T-STAT',header=TRUE)
a<-table.element(a,'P-value',header=TRUE)
a<-table.row.end(a)
for (i in 1:par1) {
a<-table.row.start(a)
a<-table.element(a,i,header=TRUE)
a<-table.element(a,round(mypacf[i],6))
mytstat <- mypacf[i]*sqrtn
a<-table.element(a,round(mytstat,4))
a<-table.element(a,round(1-pt(abs(mytstat),lengthx),6))
a<-table.row.end(a)
}
a<-table.end(a)
table.save(a,file='mytable1.tab')