Free Statistics

of Irreproducible Research!

Author's title

Author*Unverified author*
R Software Modulerwasp_autocorrelation.wasp
Title produced by software(Partial) Autocorrelation Function
Date of computationThu, 05 Mar 2015 13:37:36 +0000
Cite this page as followsStatistical Computations at FreeStatistics.org, Office for Research Development and Education, URL https://freestatistics.org/blog/index.php?v=date/2015/Mar/05/t14255626856eabcj47vy50fmu.htm/, Retrieved Fri, 17 May 2024 14:33:17 +0000
Statistical Computations at FreeStatistics.org, Office for Research Development and Education, URL https://freestatistics.org/blog/index.php?pk=277946, Retrieved Fri, 17 May 2024 14:33:17 +0000
QR Codes:

Original text written by user:
IsPrivate?No (this computation is public)
User-defined keywords
Estimated Impact115
Family? (F = Feedback message, R = changed R code, M = changed R Module, P = changed Parameters, D = changed Data)
-       [(Partial) Autocorrelation Function] [] [2015-03-05 13:37:36] [d95fe07e11cd60b998b93c9c7758de3b] [Current]
Feedback Forum

Post a new message
Dataseries X:
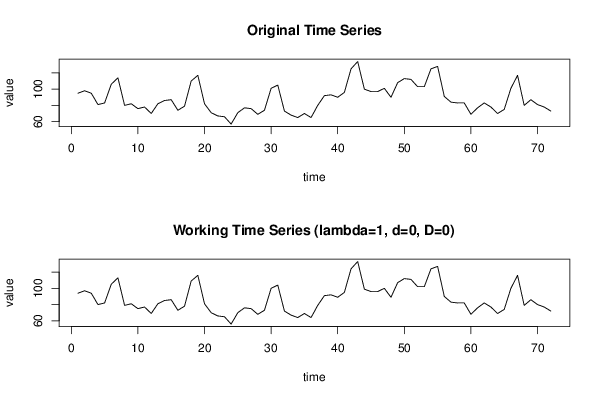
95
98
95
81
83
106
114
80
82
76
78
70
82
86
87
74
79
110
117
82
71
67
66
57
71
77
76
69
74
101
105
73
68
65
70
65
80
92
93
90
96
125
134
100
97
97
101
90
108
113
112
103
103
125
128
91
84
83
83
69
77
83
78
70
75
101
117
80
87
81
78
73


Summary of computational transaction
Raw Inputview raw input (R code)
Raw Outputview raw output of R engine
Computing time2 seconds
R Server'Gwilym Jenkins' @ jenkins.wessa.net

\begin{tabular}{lllllllll}
\hline
Summary of computational transaction \tabularnewline
Raw Input & view raw input (R code)  \tabularnewline
Raw Output & view raw output of R engine  \tabularnewline
Computing time & 2 seconds \tabularnewline
R Server & 'Gwilym Jenkins' @ jenkins.wessa.net \tabularnewline
\hline
\end{tabular}
%Source: https://freestatistics.org/blog/index.php?pk=277946&T=0

[TABLE]
[ROW][C]Summary of computational transaction[/C][/ROW]
[ROW][C]Raw Input[/C][C]view raw input (R code) [/C][/ROW]
[ROW][C]Raw Output[/C][C]view raw output of R engine [/C][/ROW]
[ROW][C]Computing time[/C][C]2 seconds[/C][/ROW]
[ROW][C]R Server[/C][C]'Gwilym Jenkins' @ jenkins.wessa.net[/C][/ROW]
[/TABLE]
Source: https://freestatistics.org/blog/index.php?pk=277946&T=0

Globally Unique Identifier (entire table): ba.freestatistics.org/blog/index.php?pk=277946&T=0

As an alternative you can also use a QR Code:  

The GUIDs for individual cells are displayed in the table below:

Summary of computational transaction
Raw Inputview raw input (R code)
Raw Outputview raw output of R engine
Computing time2 seconds
R Server'Gwilym Jenkins' @ jenkins.wessa.net


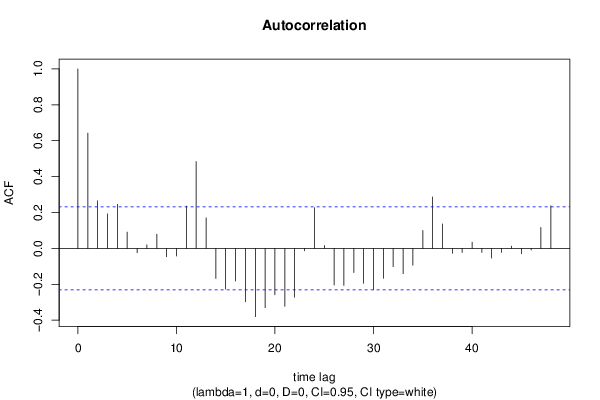
Autocorrelation Function
Time lag kACF(k)T-STATP-value
10.6422465.44960
20.2649752.24840.013807
30.1923011.63170.053552
40.245342.08180.020459
50.0906780.76940.222079
6-0.024307-0.20620.418589
70.0198520.16850.43335
80.0785190.66630.253687
9-0.046482-0.39440.347222
10-0.042339-0.35930.360227
110.2355751.99890.024696
120.4838354.10555.3e-05
130.1701681.44390.076548
14-0.16701-1.41710.080379
15-0.226205-1.91940.029447
16-0.181512-1.54020.06395
17-0.2974-2.52350.006913
18-0.380218-3.22630.000944
19-0.329859-2.79890.003288
20-0.258398-2.19260.015785
21-0.322624-2.73760.003897
22-0.27149-2.30370.012065
23-0.013022-0.11050.456163
240.2270471.92660.028991
250.0161510.1370.445688
26-0.204032-1.73130.043844
27-0.206182-1.74950.042231
28-0.134528-1.14150.128721
29-0.194214-1.6480.051859
30-0.230528-1.95610.027167
31-0.166496-1.41280.081016
32-0.101723-0.86310.195461
33-0.140579-1.19290.118422
34-0.094278-0.80.213178
350.0999990.84850.19948
360.2867782.43340.008721
370.1361461.15520.125906
38-0.026751-0.2270.410538
39-0.022816-0.19360.423518
400.0349270.29640.383901
41-0.022147-0.18790.425731
42-0.053485-0.45380.325656
43-0.022184-0.18820.425609
440.0126480.10730.457418
45-0.030028-0.25480.399805
46-0.008915-0.07560.469955
470.116540.98890.163019
480.2370492.01140.024012

\begin{tabular}{lllllllll}
\hline
Autocorrelation Function \tabularnewline
Time lag k & ACF(k) & T-STAT & P-value \tabularnewline
1 & 0.642246 & 5.4496 & 0 \tabularnewline
2 & 0.264975 & 2.2484 & 0.013807 \tabularnewline
3 & 0.192301 & 1.6317 & 0.053552 \tabularnewline
4 & 0.24534 & 2.0818 & 0.020459 \tabularnewline
5 & 0.090678 & 0.7694 & 0.222079 \tabularnewline
6 & -0.024307 & -0.2062 & 0.418589 \tabularnewline
7 & 0.019852 & 0.1685 & 0.43335 \tabularnewline
8 & 0.078519 & 0.6663 & 0.253687 \tabularnewline
9 & -0.046482 & -0.3944 & 0.347222 \tabularnewline
10 & -0.042339 & -0.3593 & 0.360227 \tabularnewline
11 & 0.235575 & 1.9989 & 0.024696 \tabularnewline
12 & 0.483835 & 4.1055 & 5.3e-05 \tabularnewline
13 & 0.170168 & 1.4439 & 0.076548 \tabularnewline
14 & -0.16701 & -1.4171 & 0.080379 \tabularnewline
15 & -0.226205 & -1.9194 & 0.029447 \tabularnewline
16 & -0.181512 & -1.5402 & 0.06395 \tabularnewline
17 & -0.2974 & -2.5235 & 0.006913 \tabularnewline
18 & -0.380218 & -3.2263 & 0.000944 \tabularnewline
19 & -0.329859 & -2.7989 & 0.003288 \tabularnewline
20 & -0.258398 & -2.1926 & 0.015785 \tabularnewline
21 & -0.322624 & -2.7376 & 0.003897 \tabularnewline
22 & -0.27149 & -2.3037 & 0.012065 \tabularnewline
23 & -0.013022 & -0.1105 & 0.456163 \tabularnewline
24 & 0.227047 & 1.9266 & 0.028991 \tabularnewline
25 & 0.016151 & 0.137 & 0.445688 \tabularnewline
26 & -0.204032 & -1.7313 & 0.043844 \tabularnewline
27 & -0.206182 & -1.7495 & 0.042231 \tabularnewline
28 & -0.134528 & -1.1415 & 0.128721 \tabularnewline
29 & -0.194214 & -1.648 & 0.051859 \tabularnewline
30 & -0.230528 & -1.9561 & 0.027167 \tabularnewline
31 & -0.166496 & -1.4128 & 0.081016 \tabularnewline
32 & -0.101723 & -0.8631 & 0.195461 \tabularnewline
33 & -0.140579 & -1.1929 & 0.118422 \tabularnewline
34 & -0.094278 & -0.8 & 0.213178 \tabularnewline
35 & 0.099999 & 0.8485 & 0.19948 \tabularnewline
36 & 0.286778 & 2.4334 & 0.008721 \tabularnewline
37 & 0.136146 & 1.1552 & 0.125906 \tabularnewline
38 & -0.026751 & -0.227 & 0.410538 \tabularnewline
39 & -0.022816 & -0.1936 & 0.423518 \tabularnewline
40 & 0.034927 & 0.2964 & 0.383901 \tabularnewline
41 & -0.022147 & -0.1879 & 0.425731 \tabularnewline
42 & -0.053485 & -0.4538 & 0.325656 \tabularnewline
43 & -0.022184 & -0.1882 & 0.425609 \tabularnewline
44 & 0.012648 & 0.1073 & 0.457418 \tabularnewline
45 & -0.030028 & -0.2548 & 0.399805 \tabularnewline
46 & -0.008915 & -0.0756 & 0.469955 \tabularnewline
47 & 0.11654 & 0.9889 & 0.163019 \tabularnewline
48 & 0.237049 & 2.0114 & 0.024012 \tabularnewline
\hline
\end{tabular}
%Source: https://freestatistics.org/blog/index.php?pk=277946&T=1

[TABLE]
[ROW][C]Autocorrelation Function[/C][/ROW]
[ROW][C]Time lag k[/C][C]ACF(k)[/C][C]T-STAT[/C][C]P-value[/C][/ROW]
[ROW][C]1[/C][C]0.642246[/C][C]5.4496[/C][C]0[/C][/ROW]
[ROW][C]2[/C][C]0.264975[/C][C]2.2484[/C][C]0.013807[/C][/ROW]
[ROW][C]3[/C][C]0.192301[/C][C]1.6317[/C][C]0.053552[/C][/ROW]
[ROW][C]4[/C][C]0.24534[/C][C]2.0818[/C][C]0.020459[/C][/ROW]
[ROW][C]5[/C][C]0.090678[/C][C]0.7694[/C][C]0.222079[/C][/ROW]
[ROW][C]6[/C][C]-0.024307[/C][C]-0.2062[/C][C]0.418589[/C][/ROW]
[ROW][C]7[/C][C]0.019852[/C][C]0.1685[/C][C]0.43335[/C][/ROW]
[ROW][C]8[/C][C]0.078519[/C][C]0.6663[/C][C]0.253687[/C][/ROW]
[ROW][C]9[/C][C]-0.046482[/C][C]-0.3944[/C][C]0.347222[/C][/ROW]
[ROW][C]10[/C][C]-0.042339[/C][C]-0.3593[/C][C]0.360227[/C][/ROW]
[ROW][C]11[/C][C]0.235575[/C][C]1.9989[/C][C]0.024696[/C][/ROW]
[ROW][C]12[/C][C]0.483835[/C][C]4.1055[/C][C]5.3e-05[/C][/ROW]
[ROW][C]13[/C][C]0.170168[/C][C]1.4439[/C][C]0.076548[/C][/ROW]
[ROW][C]14[/C][C]-0.16701[/C][C]-1.4171[/C][C]0.080379[/C][/ROW]
[ROW][C]15[/C][C]-0.226205[/C][C]-1.9194[/C][C]0.029447[/C][/ROW]
[ROW][C]16[/C][C]-0.181512[/C][C]-1.5402[/C][C]0.06395[/C][/ROW]
[ROW][C]17[/C][C]-0.2974[/C][C]-2.5235[/C][C]0.006913[/C][/ROW]
[ROW][C]18[/C][C]-0.380218[/C][C]-3.2263[/C][C]0.000944[/C][/ROW]
[ROW][C]19[/C][C]-0.329859[/C][C]-2.7989[/C][C]0.003288[/C][/ROW]
[ROW][C]20[/C][C]-0.258398[/C][C]-2.1926[/C][C]0.015785[/C][/ROW]
[ROW][C]21[/C][C]-0.322624[/C][C]-2.7376[/C][C]0.003897[/C][/ROW]
[ROW][C]22[/C][C]-0.27149[/C][C]-2.3037[/C][C]0.012065[/C][/ROW]
[ROW][C]23[/C][C]-0.013022[/C][C]-0.1105[/C][C]0.456163[/C][/ROW]
[ROW][C]24[/C][C]0.227047[/C][C]1.9266[/C][C]0.028991[/C][/ROW]
[ROW][C]25[/C][C]0.016151[/C][C]0.137[/C][C]0.445688[/C][/ROW]
[ROW][C]26[/C][C]-0.204032[/C][C]-1.7313[/C][C]0.043844[/C][/ROW]
[ROW][C]27[/C][C]-0.206182[/C][C]-1.7495[/C][C]0.042231[/C][/ROW]
[ROW][C]28[/C][C]-0.134528[/C][C]-1.1415[/C][C]0.128721[/C][/ROW]
[ROW][C]29[/C][C]-0.194214[/C][C]-1.648[/C][C]0.051859[/C][/ROW]
[ROW][C]30[/C][C]-0.230528[/C][C]-1.9561[/C][C]0.027167[/C][/ROW]
[ROW][C]31[/C][C]-0.166496[/C][C]-1.4128[/C][C]0.081016[/C][/ROW]
[ROW][C]32[/C][C]-0.101723[/C][C]-0.8631[/C][C]0.195461[/C][/ROW]
[ROW][C]33[/C][C]-0.140579[/C][C]-1.1929[/C][C]0.118422[/C][/ROW]
[ROW][C]34[/C][C]-0.094278[/C][C]-0.8[/C][C]0.213178[/C][/ROW]
[ROW][C]35[/C][C]0.099999[/C][C]0.8485[/C][C]0.19948[/C][/ROW]
[ROW][C]36[/C][C]0.286778[/C][C]2.4334[/C][C]0.008721[/C][/ROW]
[ROW][C]37[/C][C]0.136146[/C][C]1.1552[/C][C]0.125906[/C][/ROW]
[ROW][C]38[/C][C]-0.026751[/C][C]-0.227[/C][C]0.410538[/C][/ROW]
[ROW][C]39[/C][C]-0.022816[/C][C]-0.1936[/C][C]0.423518[/C][/ROW]
[ROW][C]40[/C][C]0.034927[/C][C]0.2964[/C][C]0.383901[/C][/ROW]
[ROW][C]41[/C][C]-0.022147[/C][C]-0.1879[/C][C]0.425731[/C][/ROW]
[ROW][C]42[/C][C]-0.053485[/C][C]-0.4538[/C][C]0.325656[/C][/ROW]
[ROW][C]43[/C][C]-0.022184[/C][C]-0.1882[/C][C]0.425609[/C][/ROW]
[ROW][C]44[/C][C]0.012648[/C][C]0.1073[/C][C]0.457418[/C][/ROW]
[ROW][C]45[/C][C]-0.030028[/C][C]-0.2548[/C][C]0.399805[/C][/ROW]
[ROW][C]46[/C][C]-0.008915[/C][C]-0.0756[/C][C]0.469955[/C][/ROW]
[ROW][C]47[/C][C]0.11654[/C][C]0.9889[/C][C]0.163019[/C][/ROW]
[ROW][C]48[/C][C]0.237049[/C][C]2.0114[/C][C]0.024012[/C][/ROW]
[/TABLE]
Source: https://freestatistics.org/blog/index.php?pk=277946&T=1

Globally Unique Identifier (entire table): ba.freestatistics.org/blog/index.php?pk=277946&T=1

As an alternative you can also use a QR Code:  

The GUIDs for individual cells are displayed in the table below:

Autocorrelation Function
Time lag kACF(k)T-STATP-value
10.6422465.44960
20.2649752.24840.013807
30.1923011.63170.053552
40.245342.08180.020459
50.0906780.76940.222079
6-0.024307-0.20620.418589
70.0198520.16850.43335
80.0785190.66630.253687
9-0.046482-0.39440.347222
10-0.042339-0.35930.360227
110.2355751.99890.024696
120.4838354.10555.3e-05
130.1701681.44390.076548
14-0.16701-1.41710.080379
15-0.226205-1.91940.029447
16-0.181512-1.54020.06395
17-0.2974-2.52350.006913
18-0.380218-3.22630.000944
19-0.329859-2.79890.003288
20-0.258398-2.19260.015785
21-0.322624-2.73760.003897
22-0.27149-2.30370.012065
23-0.013022-0.11050.456163
240.2270471.92660.028991
250.0161510.1370.445688
26-0.204032-1.73130.043844
27-0.206182-1.74950.042231
28-0.134528-1.14150.128721
29-0.194214-1.6480.051859
30-0.230528-1.95610.027167
31-0.166496-1.41280.081016
32-0.101723-0.86310.195461
33-0.140579-1.19290.118422
34-0.094278-0.80.213178
350.0999990.84850.19948
360.2867782.43340.008721
370.1361461.15520.125906
38-0.026751-0.2270.410538
39-0.022816-0.19360.423518
400.0349270.29640.383901
41-0.022147-0.18790.425731
42-0.053485-0.45380.325656
43-0.022184-0.18820.425609
440.0126480.10730.457418
45-0.030028-0.25480.399805
46-0.008915-0.07560.469955
470.116540.98890.163019
480.2370492.01140.024012


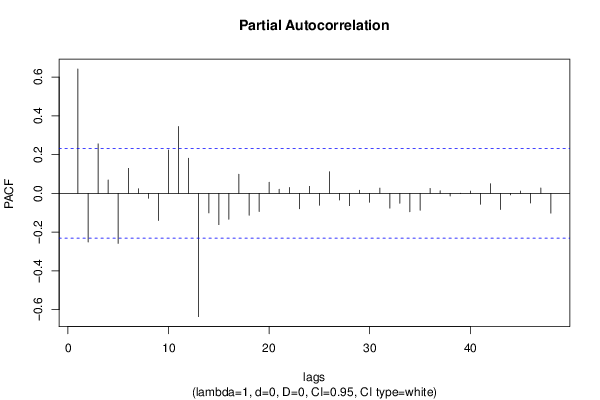
Partial Autocorrelation Function
Time lag kPACF(k)T-STATP-value
10.6422465.44960
2-0.251064-2.13030.01828
30.2554832.16780.016739
40.0686620.58260.280987
5-0.258067-2.18980.015891
60.1290871.09530.138509
70.0236790.20090.420664
8-0.025-0.21210.416303
9-0.140026-1.18820.119338
100.22421.90240.030559
110.3456492.93290.00225
120.1813191.53850.064149
13-0.636326-5.39940
14-0.100841-0.85570.197511
15-0.161451-1.370.087478
16-0.133975-1.13680.129692
170.0983560.83460.203358
18-0.112885-0.95790.170669
19-0.093427-0.79280.215263
200.0572870.48610.314188
210.0216070.18330.427523
220.0299930.25450.399918
23-0.079516-0.67470.251009
240.0363630.30860.379276
25-0.060943-0.51710.303329
260.1120850.95110.172374
27-0.034128-0.28960.386482
28-0.063231-0.53650.296623
290.0159230.13510.446449
30-0.045757-0.38830.349484
310.0270210.22930.409652
32-0.076281-0.64730.259758
33-0.051449-0.43660.331868
34-0.09503-0.80640.211345
35-0.08713-0.73930.231058
360.0256580.21770.414134
370.0137060.11630.453869
38-0.013404-0.11370.45488
390.0012140.01030.495904
400.0117860.10.460309
41-0.055935-0.47460.318245
420.0499280.42370.336541
43-0.083396-0.70760.240726
44-0.007658-0.0650.474185
450.0115770.09820.46101
46-0.049549-0.42040.33771
470.0276640.23470.407539
48-0.102013-0.86560.194789

\begin{tabular}{lllllllll}
\hline
Partial Autocorrelation Function \tabularnewline
Time lag k & PACF(k) & T-STAT & P-value \tabularnewline
1 & 0.642246 & 5.4496 & 0 \tabularnewline
2 & -0.251064 & -2.1303 & 0.01828 \tabularnewline
3 & 0.255483 & 2.1678 & 0.016739 \tabularnewline
4 & 0.068662 & 0.5826 & 0.280987 \tabularnewline
5 & -0.258067 & -2.1898 & 0.015891 \tabularnewline
6 & 0.129087 & 1.0953 & 0.138509 \tabularnewline
7 & 0.023679 & 0.2009 & 0.420664 \tabularnewline
8 & -0.025 & -0.2121 & 0.416303 \tabularnewline
9 & -0.140026 & -1.1882 & 0.119338 \tabularnewline
10 & 0.2242 & 1.9024 & 0.030559 \tabularnewline
11 & 0.345649 & 2.9329 & 0.00225 \tabularnewline
12 & 0.181319 & 1.5385 & 0.064149 \tabularnewline
13 & -0.636326 & -5.3994 & 0 \tabularnewline
14 & -0.100841 & -0.8557 & 0.197511 \tabularnewline
15 & -0.161451 & -1.37 & 0.087478 \tabularnewline
16 & -0.133975 & -1.1368 & 0.129692 \tabularnewline
17 & 0.098356 & 0.8346 & 0.203358 \tabularnewline
18 & -0.112885 & -0.9579 & 0.170669 \tabularnewline
19 & -0.093427 & -0.7928 & 0.215263 \tabularnewline
20 & 0.057287 & 0.4861 & 0.314188 \tabularnewline
21 & 0.021607 & 0.1833 & 0.427523 \tabularnewline
22 & 0.029993 & 0.2545 & 0.399918 \tabularnewline
23 & -0.079516 & -0.6747 & 0.251009 \tabularnewline
24 & 0.036363 & 0.3086 & 0.379276 \tabularnewline
25 & -0.060943 & -0.5171 & 0.303329 \tabularnewline
26 & 0.112085 & 0.9511 & 0.172374 \tabularnewline
27 & -0.034128 & -0.2896 & 0.386482 \tabularnewline
28 & -0.063231 & -0.5365 & 0.296623 \tabularnewline
29 & 0.015923 & 0.1351 & 0.446449 \tabularnewline
30 & -0.045757 & -0.3883 & 0.349484 \tabularnewline
31 & 0.027021 & 0.2293 & 0.409652 \tabularnewline
32 & -0.076281 & -0.6473 & 0.259758 \tabularnewline
33 & -0.051449 & -0.4366 & 0.331868 \tabularnewline
34 & -0.09503 & -0.8064 & 0.211345 \tabularnewline
35 & -0.08713 & -0.7393 & 0.231058 \tabularnewline
36 & 0.025658 & 0.2177 & 0.414134 \tabularnewline
37 & 0.013706 & 0.1163 & 0.453869 \tabularnewline
38 & -0.013404 & -0.1137 & 0.45488 \tabularnewline
39 & 0.001214 & 0.0103 & 0.495904 \tabularnewline
40 & 0.011786 & 0.1 & 0.460309 \tabularnewline
41 & -0.055935 & -0.4746 & 0.318245 \tabularnewline
42 & 0.049928 & 0.4237 & 0.336541 \tabularnewline
43 & -0.083396 & -0.7076 & 0.240726 \tabularnewline
44 & -0.007658 & -0.065 & 0.474185 \tabularnewline
45 & 0.011577 & 0.0982 & 0.46101 \tabularnewline
46 & -0.049549 & -0.4204 & 0.33771 \tabularnewline
47 & 0.027664 & 0.2347 & 0.407539 \tabularnewline
48 & -0.102013 & -0.8656 & 0.194789 \tabularnewline
\hline
\end{tabular}
%Source: https://freestatistics.org/blog/index.php?pk=277946&T=2

[TABLE]
[ROW][C]Partial Autocorrelation Function[/C][/ROW]
[ROW][C]Time lag k[/C][C]PACF(k)[/C][C]T-STAT[/C][C]P-value[/C][/ROW]
[ROW][C]1[/C][C]0.642246[/C][C]5.4496[/C][C]0[/C][/ROW]
[ROW][C]2[/C][C]-0.251064[/C][C]-2.1303[/C][C]0.01828[/C][/ROW]
[ROW][C]3[/C][C]0.255483[/C][C]2.1678[/C][C]0.016739[/C][/ROW]
[ROW][C]4[/C][C]0.068662[/C][C]0.5826[/C][C]0.280987[/C][/ROW]
[ROW][C]5[/C][C]-0.258067[/C][C]-2.1898[/C][C]0.015891[/C][/ROW]
[ROW][C]6[/C][C]0.129087[/C][C]1.0953[/C][C]0.138509[/C][/ROW]
[ROW][C]7[/C][C]0.023679[/C][C]0.2009[/C][C]0.420664[/C][/ROW]
[ROW][C]8[/C][C]-0.025[/C][C]-0.2121[/C][C]0.416303[/C][/ROW]
[ROW][C]9[/C][C]-0.140026[/C][C]-1.1882[/C][C]0.119338[/C][/ROW]
[ROW][C]10[/C][C]0.2242[/C][C]1.9024[/C][C]0.030559[/C][/ROW]
[ROW][C]11[/C][C]0.345649[/C][C]2.9329[/C][C]0.00225[/C][/ROW]
[ROW][C]12[/C][C]0.181319[/C][C]1.5385[/C][C]0.064149[/C][/ROW]
[ROW][C]13[/C][C]-0.636326[/C][C]-5.3994[/C][C]0[/C][/ROW]
[ROW][C]14[/C][C]-0.100841[/C][C]-0.8557[/C][C]0.197511[/C][/ROW]
[ROW][C]15[/C][C]-0.161451[/C][C]-1.37[/C][C]0.087478[/C][/ROW]
[ROW][C]16[/C][C]-0.133975[/C][C]-1.1368[/C][C]0.129692[/C][/ROW]
[ROW][C]17[/C][C]0.098356[/C][C]0.8346[/C][C]0.203358[/C][/ROW]
[ROW][C]18[/C][C]-0.112885[/C][C]-0.9579[/C][C]0.170669[/C][/ROW]
[ROW][C]19[/C][C]-0.093427[/C][C]-0.7928[/C][C]0.215263[/C][/ROW]
[ROW][C]20[/C][C]0.057287[/C][C]0.4861[/C][C]0.314188[/C][/ROW]
[ROW][C]21[/C][C]0.021607[/C][C]0.1833[/C][C]0.427523[/C][/ROW]
[ROW][C]22[/C][C]0.029993[/C][C]0.2545[/C][C]0.399918[/C][/ROW]
[ROW][C]23[/C][C]-0.079516[/C][C]-0.6747[/C][C]0.251009[/C][/ROW]
[ROW][C]24[/C][C]0.036363[/C][C]0.3086[/C][C]0.379276[/C][/ROW]
[ROW][C]25[/C][C]-0.060943[/C][C]-0.5171[/C][C]0.303329[/C][/ROW]
[ROW][C]26[/C][C]0.112085[/C][C]0.9511[/C][C]0.172374[/C][/ROW]
[ROW][C]27[/C][C]-0.034128[/C][C]-0.2896[/C][C]0.386482[/C][/ROW]
[ROW][C]28[/C][C]-0.063231[/C][C]-0.5365[/C][C]0.296623[/C][/ROW]
[ROW][C]29[/C][C]0.015923[/C][C]0.1351[/C][C]0.446449[/C][/ROW]
[ROW][C]30[/C][C]-0.045757[/C][C]-0.3883[/C][C]0.349484[/C][/ROW]
[ROW][C]31[/C][C]0.027021[/C][C]0.2293[/C][C]0.409652[/C][/ROW]
[ROW][C]32[/C][C]-0.076281[/C][C]-0.6473[/C][C]0.259758[/C][/ROW]
[ROW][C]33[/C][C]-0.051449[/C][C]-0.4366[/C][C]0.331868[/C][/ROW]
[ROW][C]34[/C][C]-0.09503[/C][C]-0.8064[/C][C]0.211345[/C][/ROW]
[ROW][C]35[/C][C]-0.08713[/C][C]-0.7393[/C][C]0.231058[/C][/ROW]
[ROW][C]36[/C][C]0.025658[/C][C]0.2177[/C][C]0.414134[/C][/ROW]
[ROW][C]37[/C][C]0.013706[/C][C]0.1163[/C][C]0.453869[/C][/ROW]
[ROW][C]38[/C][C]-0.013404[/C][C]-0.1137[/C][C]0.45488[/C][/ROW]
[ROW][C]39[/C][C]0.001214[/C][C]0.0103[/C][C]0.495904[/C][/ROW]
[ROW][C]40[/C][C]0.011786[/C][C]0.1[/C][C]0.460309[/C][/ROW]
[ROW][C]41[/C][C]-0.055935[/C][C]-0.4746[/C][C]0.318245[/C][/ROW]
[ROW][C]42[/C][C]0.049928[/C][C]0.4237[/C][C]0.336541[/C][/ROW]
[ROW][C]43[/C][C]-0.083396[/C][C]-0.7076[/C][C]0.240726[/C][/ROW]
[ROW][C]44[/C][C]-0.007658[/C][C]-0.065[/C][C]0.474185[/C][/ROW]
[ROW][C]45[/C][C]0.011577[/C][C]0.0982[/C][C]0.46101[/C][/ROW]
[ROW][C]46[/C][C]-0.049549[/C][C]-0.4204[/C][C]0.33771[/C][/ROW]
[ROW][C]47[/C][C]0.027664[/C][C]0.2347[/C][C]0.407539[/C][/ROW]
[ROW][C]48[/C][C]-0.102013[/C][C]-0.8656[/C][C]0.194789[/C][/ROW]
[/TABLE]
Source: https://freestatistics.org/blog/index.php?pk=277946&T=2

Globally Unique Identifier (entire table): ba.freestatistics.org/blog/index.php?pk=277946&T=2

As an alternative you can also use a QR Code:  

The GUIDs for individual cells are displayed in the table below:

Partial Autocorrelation Function
Time lag kPACF(k)T-STATP-value
10.6422465.44960
2-0.251064-2.13030.01828
30.2554832.16780.016739
40.0686620.58260.280987
5-0.258067-2.18980.015891
60.1290871.09530.138509
70.0236790.20090.420664
8-0.025-0.21210.416303
9-0.140026-1.18820.119338
100.22421.90240.030559
110.3456492.93290.00225
120.1813191.53850.064149
13-0.636326-5.39940
14-0.100841-0.85570.197511
15-0.161451-1.370.087478
16-0.133975-1.13680.129692
170.0983560.83460.203358
18-0.112885-0.95790.170669
19-0.093427-0.79280.215263
200.0572870.48610.314188
210.0216070.18330.427523
220.0299930.25450.399918
23-0.079516-0.67470.251009
240.0363630.30860.379276
25-0.060943-0.51710.303329
260.1120850.95110.172374
27-0.034128-0.28960.386482
28-0.063231-0.53650.296623
290.0159230.13510.446449
30-0.045757-0.38830.349484
310.0270210.22930.409652
32-0.076281-0.64730.259758
33-0.051449-0.43660.331868
34-0.09503-0.80640.211345
35-0.08713-0.73930.231058
360.0256580.21770.414134
370.0137060.11630.453869
38-0.013404-0.11370.45488
390.0012140.01030.495904
400.0117860.10.460309
41-0.055935-0.47460.318245
420.0499280.42370.336541
43-0.083396-0.70760.240726
44-0.007658-0.0650.474185
450.0115770.09820.46101
46-0.049549-0.42040.33771
470.0276640.23470.407539
48-0.102013-0.86560.194789


Parameters (Session):
par1 = 48 ; par2 = 1 ; par3 = 0 ; par4 = 0 ; par5 = 12 ; par6 = White Noise ; par7 = 0.95 ;
Parameters (R input):
par1 = 48 ; par2 = 1 ; par3 = 0 ; par4 = 0 ; par5 = 12 ; par6 = White Noise ; par7 = 0.95 ; par8 = ;
R code (references can be found in the software module):
if (par1 == 'Default') {
par1 = 10*log10(length(x))
} else {
par1 <- as.numeric(par1)
}
par2 <- as.numeric(par2)
par3 <- as.numeric(par3)
par4 <- as.numeric(par4)
par5 <- as.numeric(par5)
if (par6 == 'White Noise') par6 <- 'white' else par6 <- 'ma'
par7 <- as.numeric(par7)
if (par8 != '') par8 <- as.numeric(par8)
ox <- x
if (par8 == '') {
if (par2 == 0) {
x <- log(x)
} else {
x <- (x ^ par2 - 1) / par2
}
} else {
x <- log(x,base=par8)
}
if (par3 > 0) x <- diff(x,lag=1,difference=par3)
if (par4 > 0) x <- diff(x,lag=par5,difference=par4)
bitmap(file='picts.png')
op <- par(mfrow=c(2,1))
plot(ox,type='l',main='Original Time Series',xlab='time',ylab='value')
if (par8=='') {
mytitle <- paste('Working Time Series (lambda=',par2,', d=',par3,', D=',par4,')',sep='')
mysub <- paste('(lambda=',par2,', d=',par3,', D=',par4,', CI=', par7, ', CI type=',par6,')',sep='')
} else {
mytitle <- paste('Working Time Series (base=',par8,', d=',par3,', D=',par4,')',sep='')
mysub <- paste('(base=',par8,', d=',par3,', D=',par4,', CI=', par7, ', CI type=',par6,')',sep='')
}
plot(x,type='l', main=mytitle,xlab='time',ylab='value')
par(op)
dev.off()
bitmap(file='pic1.png')
racf <- acf(x, par1, main='Autocorrelation', xlab='time lag', ylab='ACF', ci.type=par6, ci=par7, sub=mysub)
dev.off()
bitmap(file='pic2.png')
rpacf <- pacf(x,par1,main='Partial Autocorrelation',xlab='lags',ylab='PACF',sub=mysub)
dev.off()
(myacf <- c(racf$acf))
(mypacf <- c(rpacf$acf))
lengthx <- length(x)
sqrtn <- sqrt(lengthx)
load(file='createtable')
a<-table.start()
a<-table.row.start(a)
a<-table.element(a,'Autocorrelation Function',4,TRUE)
a<-table.row.end(a)
a<-table.row.start(a)
a<-table.element(a,'Time lag k',header=TRUE)
a<-table.element(a,hyperlink('basics.htm','ACF(k)','click here for more information about the Autocorrelation Function'),header=TRUE)
a<-table.element(a,'T-STAT',header=TRUE)
a<-table.element(a,'P-value',header=TRUE)
a<-table.row.end(a)
for (i in 2:(par1+1)) {
a<-table.row.start(a)
a<-table.element(a,i-1,header=TRUE)
a<-table.element(a,round(myacf[i],6))
mytstat <- myacf[i]*sqrtn
a<-table.element(a,round(mytstat,4))
a<-table.element(a,round(1-pt(abs(mytstat),lengthx),6))
a<-table.row.end(a)
}
a<-table.end(a)
table.save(a,file='mytable.tab')
a<-table.start()
a<-table.row.start(a)
a<-table.element(a,'Partial Autocorrelation Function',4,TRUE)
a<-table.row.end(a)
a<-table.row.start(a)
a<-table.element(a,'Time lag k',header=TRUE)
a<-table.element(a,hyperlink('basics.htm','PACF(k)','click here for more information about the Partial Autocorrelation Function'),header=TRUE)
a<-table.element(a,'T-STAT',header=TRUE)
a<-table.element(a,'P-value',header=TRUE)
a<-table.row.end(a)
for (i in 1:par1) {
a<-table.row.start(a)
a<-table.element(a,i,header=TRUE)
a<-table.element(a,round(mypacf[i],6))
mytstat <- mypacf[i]*sqrtn
a<-table.element(a,round(mytstat,4))
a<-table.element(a,round(1-pt(abs(mytstat),lengthx),6))
a<-table.row.end(a)
}
a<-table.end(a)
table.save(a,file='mytable1.tab')