Free Statistics

of Irreproducible Research!

Author's title

Author*Unverified author*
R Software Modulerwasp_autocorrelation.wasp
Title produced by software(Partial) Autocorrelation Function
Date of computationThu, 05 Mar 2015 13:40:35 +0000
Cite this page as followsStatistical Computations at FreeStatistics.org, Office for Research Development and Education, URL https://freestatistics.org/blog/index.php?v=date/2015/Mar/05/t1425562863e910p1ksdwqex7a.htm/, Retrieved Fri, 17 May 2024 19:16:09 +0000
Statistical Computations at FreeStatistics.org, Office for Research Development and Education, URL https://freestatistics.org/blog/index.php?pk=277948, Retrieved Fri, 17 May 2024 19:16:09 +0000
QR Codes:

Original text written by user:
IsPrivate?No (this computation is public)
User-defined keywords
Estimated Impact102
Family? (F = Feedback message, R = changed R code, M = changed R Module, P = changed Parameters, D = changed Data)
-       [(Partial) Autocorrelation Function] [] [2015-03-05 13:40:35] [d95fe07e11cd60b998b93c9c7758de3b] [Current]
Feedback Forum

Post a new message
Dataseries X:
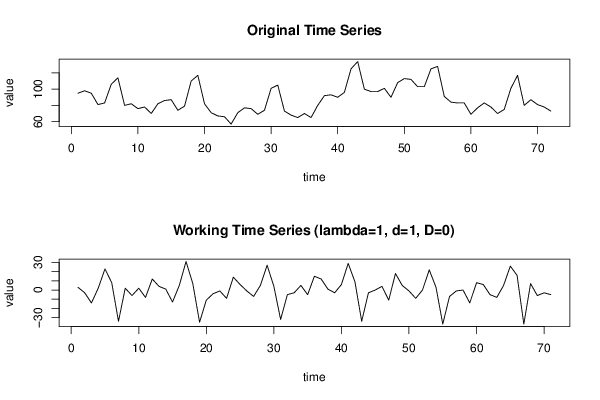
95
98
95
81
83
106
114
80
82
76
78
70
82
86
87
74
79
110
117
82
71
67
66
57
71
77
76
69
74
101
105
73
68
65
70
65
80
92
93
90
96
125
134
100
97
97
101
90
108
113
112
103
103
125
128
91
84
83
83
69
77
83
78
70
75
101
117
80
87
81
78
73


Summary of computational transaction
Raw Inputview raw input (R code)
Raw Outputview raw output of R engine
Computing time2 seconds
R Server'Gwilym Jenkins' @ jenkins.wessa.net

\begin{tabular}{lllllllll}
\hline
Summary of computational transaction \tabularnewline
Raw Input & view raw input (R code)  \tabularnewline
Raw Output & view raw output of R engine  \tabularnewline
Computing time & 2 seconds \tabularnewline
R Server & 'Gwilym Jenkins' @ jenkins.wessa.net \tabularnewline
\hline
\end{tabular}
%Source: https://freestatistics.org/blog/index.php?pk=277948&T=0

[TABLE]
[ROW][C]Summary of computational transaction[/C][/ROW]
[ROW][C]Raw Input[/C][C]view raw input (R code) [/C][/ROW]
[ROW][C]Raw Output[/C][C]view raw output of R engine [/C][/ROW]
[ROW][C]Computing time[/C][C]2 seconds[/C][/ROW]
[ROW][C]R Server[/C][C]'Gwilym Jenkins' @ jenkins.wessa.net[/C][/ROW]
[/TABLE]
Source: https://freestatistics.org/blog/index.php?pk=277948&T=0

Globally Unique Identifier (entire table): ba.freestatistics.org/blog/index.php?pk=277948&T=0

As an alternative you can also use a QR Code:  

The GUIDs for individual cells are displayed in the table below:

Summary of computational transaction
Raw Inputview raw input (R code)
Raw Outputview raw output of R engine
Computing time2 seconds
R Server'Gwilym Jenkins' @ jenkins.wessa.net


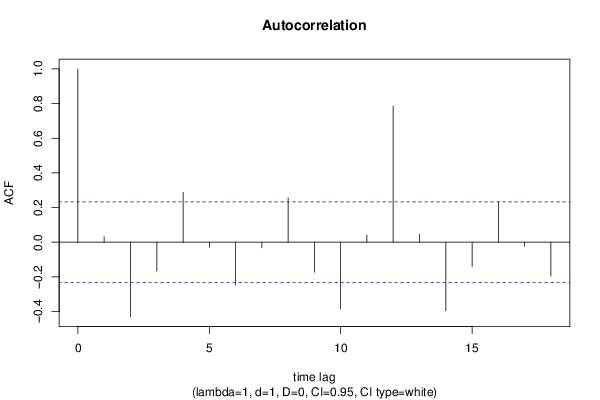
Autocorrelation Function
Time lag kACF(k)T-STATP-value
10.0310930.2620.397042
2-0.429689-3.62060.000274
3-0.166368-1.40180.08266
40.2876712.4240.008951
5-0.029165-0.24570.403294
6-0.24699-2.08120.020513
7-0.031666-0.26680.395188
80.2552672.15090.017444
9-0.173023-1.45790.074637
10-0.385705-3.250.000883
110.0398750.3360.368933
120.7862946.62540
130.0457820.38580.350412
14-0.396559-3.34150.000666
15-0.140839-1.18670.119645
160.2336951.96920.02642
17-0.023372-0.19690.42222
18-0.19592-1.65080.051593

\begin{tabular}{lllllllll}
\hline
Autocorrelation Function \tabularnewline
Time lag k & ACF(k) & T-STAT & P-value \tabularnewline
1 & 0.031093 & 0.262 & 0.397042 \tabularnewline
2 & -0.429689 & -3.6206 & 0.000274 \tabularnewline
3 & -0.166368 & -1.4018 & 0.08266 \tabularnewline
4 & 0.287671 & 2.424 & 0.008951 \tabularnewline
5 & -0.029165 & -0.2457 & 0.403294 \tabularnewline
6 & -0.24699 & -2.0812 & 0.020513 \tabularnewline
7 & -0.031666 & -0.2668 & 0.395188 \tabularnewline
8 & 0.255267 & 2.1509 & 0.017444 \tabularnewline
9 & -0.173023 & -1.4579 & 0.074637 \tabularnewline
10 & -0.385705 & -3.25 & 0.000883 \tabularnewline
11 & 0.039875 & 0.336 & 0.368933 \tabularnewline
12 & 0.786294 & 6.6254 & 0 \tabularnewline
13 & 0.045782 & 0.3858 & 0.350412 \tabularnewline
14 & -0.396559 & -3.3415 & 0.000666 \tabularnewline
15 & -0.140839 & -1.1867 & 0.119645 \tabularnewline
16 & 0.233695 & 1.9692 & 0.02642 \tabularnewline
17 & -0.023372 & -0.1969 & 0.42222 \tabularnewline
18 & -0.19592 & -1.6508 & 0.051593 \tabularnewline
\hline
\end{tabular}
%Source: https://freestatistics.org/blog/index.php?pk=277948&T=1

[TABLE]
[ROW][C]Autocorrelation Function[/C][/ROW]
[ROW][C]Time lag k[/C][C]ACF(k)[/C][C]T-STAT[/C][C]P-value[/C][/ROW]
[ROW][C]1[/C][C]0.031093[/C][C]0.262[/C][C]0.397042[/C][/ROW]
[ROW][C]2[/C][C]-0.429689[/C][C]-3.6206[/C][C]0.000274[/C][/ROW]
[ROW][C]3[/C][C]-0.166368[/C][C]-1.4018[/C][C]0.08266[/C][/ROW]
[ROW][C]4[/C][C]0.287671[/C][C]2.424[/C][C]0.008951[/C][/ROW]
[ROW][C]5[/C][C]-0.029165[/C][C]-0.2457[/C][C]0.403294[/C][/ROW]
[ROW][C]6[/C][C]-0.24699[/C][C]-2.0812[/C][C]0.020513[/C][/ROW]
[ROW][C]7[/C][C]-0.031666[/C][C]-0.2668[/C][C]0.395188[/C][/ROW]
[ROW][C]8[/C][C]0.255267[/C][C]2.1509[/C][C]0.017444[/C][/ROW]
[ROW][C]9[/C][C]-0.173023[/C][C]-1.4579[/C][C]0.074637[/C][/ROW]
[ROW][C]10[/C][C]-0.385705[/C][C]-3.25[/C][C]0.000883[/C][/ROW]
[ROW][C]11[/C][C]0.039875[/C][C]0.336[/C][C]0.368933[/C][/ROW]
[ROW][C]12[/C][C]0.786294[/C][C]6.6254[/C][C]0[/C][/ROW]
[ROW][C]13[/C][C]0.045782[/C][C]0.3858[/C][C]0.350412[/C][/ROW]
[ROW][C]14[/C][C]-0.396559[/C][C]-3.3415[/C][C]0.000666[/C][/ROW]
[ROW][C]15[/C][C]-0.140839[/C][C]-1.1867[/C][C]0.119645[/C][/ROW]
[ROW][C]16[/C][C]0.233695[/C][C]1.9692[/C][C]0.02642[/C][/ROW]
[ROW][C]17[/C][C]-0.023372[/C][C]-0.1969[/C][C]0.42222[/C][/ROW]
[ROW][C]18[/C][C]-0.19592[/C][C]-1.6508[/C][C]0.051593[/C][/ROW]
[/TABLE]
Source: https://freestatistics.org/blog/index.php?pk=277948&T=1

Globally Unique Identifier (entire table): ba.freestatistics.org/blog/index.php?pk=277948&T=1

As an alternative you can also use a QR Code:  

The GUIDs for individual cells are displayed in the table below:

Autocorrelation Function
Time lag kACF(k)T-STATP-value
10.0310930.2620.397042
2-0.429689-3.62060.000274
3-0.166368-1.40180.08266
40.2876712.4240.008951
5-0.029165-0.24570.403294
6-0.24699-2.08120.020513
7-0.031666-0.26680.395188
80.2552672.15090.017444
9-0.173023-1.45790.074637
10-0.385705-3.250.000883
110.0398750.3360.368933
120.7862946.62540
130.0457820.38580.350412
14-0.396559-3.34150.000666
15-0.140839-1.18670.119645
160.2336951.96920.02642
17-0.023372-0.19690.42222
18-0.19592-1.65080.051593


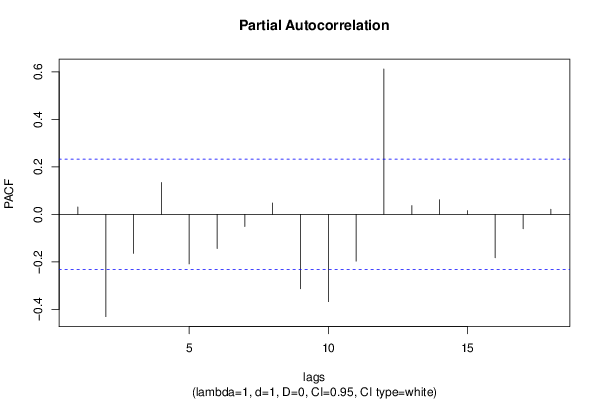
Partial Autocorrelation Function
Time lag kPACF(k)T-STATP-value
10.0310930.2620.397042
2-0.431072-3.63230.000264
3-0.164552-1.38650.08496
40.1343361.13190.130735
5-0.208862-1.75990.041366
6-0.14371-1.21090.11497
7-0.051315-0.43240.333384
80.0478010.40280.344161
9-0.313684-2.64310.00505
10-0.367739-3.09860.001393
11-0.19718-1.66150.050515
120.612775.16331e-06
130.0367220.30940.378952
140.0613830.51720.303305
150.0158180.13330.447172
16-0.183152-1.54330.063606
17-0.06066-0.51110.305424
180.0212780.17930.42911

\begin{tabular}{lllllllll}
\hline
Partial Autocorrelation Function \tabularnewline
Time lag k & PACF(k) & T-STAT & P-value \tabularnewline
1 & 0.031093 & 0.262 & 0.397042 \tabularnewline
2 & -0.431072 & -3.6323 & 0.000264 \tabularnewline
3 & -0.164552 & -1.3865 & 0.08496 \tabularnewline
4 & 0.134336 & 1.1319 & 0.130735 \tabularnewline
5 & -0.208862 & -1.7599 & 0.041366 \tabularnewline
6 & -0.14371 & -1.2109 & 0.11497 \tabularnewline
7 & -0.051315 & -0.4324 & 0.333384 \tabularnewline
8 & 0.047801 & 0.4028 & 0.344161 \tabularnewline
9 & -0.313684 & -2.6431 & 0.00505 \tabularnewline
10 & -0.367739 & -3.0986 & 0.001393 \tabularnewline
11 & -0.19718 & -1.6615 & 0.050515 \tabularnewline
12 & 0.61277 & 5.1633 & 1e-06 \tabularnewline
13 & 0.036722 & 0.3094 & 0.378952 \tabularnewline
14 & 0.061383 & 0.5172 & 0.303305 \tabularnewline
15 & 0.015818 & 0.1333 & 0.447172 \tabularnewline
16 & -0.183152 & -1.5433 & 0.063606 \tabularnewline
17 & -0.06066 & -0.5111 & 0.305424 \tabularnewline
18 & 0.021278 & 0.1793 & 0.42911 \tabularnewline
\hline
\end{tabular}
%Source: https://freestatistics.org/blog/index.php?pk=277948&T=2

[TABLE]
[ROW][C]Partial Autocorrelation Function[/C][/ROW]
[ROW][C]Time lag k[/C][C]PACF(k)[/C][C]T-STAT[/C][C]P-value[/C][/ROW]
[ROW][C]1[/C][C]0.031093[/C][C]0.262[/C][C]0.397042[/C][/ROW]
[ROW][C]2[/C][C]-0.431072[/C][C]-3.6323[/C][C]0.000264[/C][/ROW]
[ROW][C]3[/C][C]-0.164552[/C][C]-1.3865[/C][C]0.08496[/C][/ROW]
[ROW][C]4[/C][C]0.134336[/C][C]1.1319[/C][C]0.130735[/C][/ROW]
[ROW][C]5[/C][C]-0.208862[/C][C]-1.7599[/C][C]0.041366[/C][/ROW]
[ROW][C]6[/C][C]-0.14371[/C][C]-1.2109[/C][C]0.11497[/C][/ROW]
[ROW][C]7[/C][C]-0.051315[/C][C]-0.4324[/C][C]0.333384[/C][/ROW]
[ROW][C]8[/C][C]0.047801[/C][C]0.4028[/C][C]0.344161[/C][/ROW]
[ROW][C]9[/C][C]-0.313684[/C][C]-2.6431[/C][C]0.00505[/C][/ROW]
[ROW][C]10[/C][C]-0.367739[/C][C]-3.0986[/C][C]0.001393[/C][/ROW]
[ROW][C]11[/C][C]-0.19718[/C][C]-1.6615[/C][C]0.050515[/C][/ROW]
[ROW][C]12[/C][C]0.61277[/C][C]5.1633[/C][C]1e-06[/C][/ROW]
[ROW][C]13[/C][C]0.036722[/C][C]0.3094[/C][C]0.378952[/C][/ROW]
[ROW][C]14[/C][C]0.061383[/C][C]0.5172[/C][C]0.303305[/C][/ROW]
[ROW][C]15[/C][C]0.015818[/C][C]0.1333[/C][C]0.447172[/C][/ROW]
[ROW][C]16[/C][C]-0.183152[/C][C]-1.5433[/C][C]0.063606[/C][/ROW]
[ROW][C]17[/C][C]-0.06066[/C][C]-0.5111[/C][C]0.305424[/C][/ROW]
[ROW][C]18[/C][C]0.021278[/C][C]0.1793[/C][C]0.42911[/C][/ROW]
[/TABLE]
Source: https://freestatistics.org/blog/index.php?pk=277948&T=2

Globally Unique Identifier (entire table): ba.freestatistics.org/blog/index.php?pk=277948&T=2

As an alternative you can also use a QR Code:  

The GUIDs for individual cells are displayed in the table below:

Partial Autocorrelation Function
Time lag kPACF(k)T-STATP-value
10.0310930.2620.397042
2-0.431072-3.63230.000264
3-0.164552-1.38650.08496
40.1343361.13190.130735
5-0.208862-1.75990.041366
6-0.14371-1.21090.11497
7-0.051315-0.43240.333384
80.0478010.40280.344161
9-0.313684-2.64310.00505
10-0.367739-3.09860.001393
11-0.19718-1.66150.050515
120.612775.16331e-06
130.0367220.30940.378952
140.0613830.51720.303305
150.0158180.13330.447172
16-0.183152-1.54330.063606
17-0.06066-0.51110.305424
180.0212780.17930.42911


Parameters (Session):
par1 = Default ; par2 = 1 ; par3 = 1 ; par4 = 0 ; par5 = 12 ; par6 = White Noise ; par7 = 0.95 ;
Parameters (R input):
par1 = Default ; par2 = 1 ; par3 = 1 ; par4 = 0 ; par5 = 12 ; par6 = White Noise ; par7 = 0.95 ; par8 = ;
R code (references can be found in the software module):
if (par1 == 'Default') {
par1 = 10*log10(length(x))
} else {
par1 <- as.numeric(par1)
}
par2 <- as.numeric(par2)
par3 <- as.numeric(par3)
par4 <- as.numeric(par4)
par5 <- as.numeric(par5)
if (par6 == 'White Noise') par6 <- 'white' else par6 <- 'ma'
par7 <- as.numeric(par7)
if (par8 != '') par8 <- as.numeric(par8)
ox <- x
if (par8 == '') {
if (par2 == 0) {
x <- log(x)
} else {
x <- (x ^ par2 - 1) / par2
}
} else {
x <- log(x,base=par8)
}
if (par3 > 0) x <- diff(x,lag=1,difference=par3)
if (par4 > 0) x <- diff(x,lag=par5,difference=par4)
bitmap(file='picts.png')
op <- par(mfrow=c(2,1))
plot(ox,type='l',main='Original Time Series',xlab='time',ylab='value')
if (par8=='') {
mytitle <- paste('Working Time Series (lambda=',par2,', d=',par3,', D=',par4,')',sep='')
mysub <- paste('(lambda=',par2,', d=',par3,', D=',par4,', CI=', par7, ', CI type=',par6,')',sep='')
} else {
mytitle <- paste('Working Time Series (base=',par8,', d=',par3,', D=',par4,')',sep='')
mysub <- paste('(base=',par8,', d=',par3,', D=',par4,', CI=', par7, ', CI type=',par6,')',sep='')
}
plot(x,type='l', main=mytitle,xlab='time',ylab='value')
par(op)
dev.off()
bitmap(file='pic1.png')
racf <- acf(x, par1, main='Autocorrelation', xlab='time lag', ylab='ACF', ci.type=par6, ci=par7, sub=mysub)
dev.off()
bitmap(file='pic2.png')
rpacf <- pacf(x,par1,main='Partial Autocorrelation',xlab='lags',ylab='PACF',sub=mysub)
dev.off()
(myacf <- c(racf$acf))
(mypacf <- c(rpacf$acf))
lengthx <- length(x)
sqrtn <- sqrt(lengthx)
load(file='createtable')
a<-table.start()
a<-table.row.start(a)
a<-table.element(a,'Autocorrelation Function',4,TRUE)
a<-table.row.end(a)
a<-table.row.start(a)
a<-table.element(a,'Time lag k',header=TRUE)
a<-table.element(a,hyperlink('basics.htm','ACF(k)','click here for more information about the Autocorrelation Function'),header=TRUE)
a<-table.element(a,'T-STAT',header=TRUE)
a<-table.element(a,'P-value',header=TRUE)
a<-table.row.end(a)
for (i in 2:(par1+1)) {
a<-table.row.start(a)
a<-table.element(a,i-1,header=TRUE)
a<-table.element(a,round(myacf[i],6))
mytstat <- myacf[i]*sqrtn
a<-table.element(a,round(mytstat,4))
a<-table.element(a,round(1-pt(abs(mytstat),lengthx),6))
a<-table.row.end(a)
}
a<-table.end(a)
table.save(a,file='mytable.tab')
a<-table.start()
a<-table.row.start(a)
a<-table.element(a,'Partial Autocorrelation Function',4,TRUE)
a<-table.row.end(a)
a<-table.row.start(a)
a<-table.element(a,'Time lag k',header=TRUE)
a<-table.element(a,hyperlink('basics.htm','PACF(k)','click here for more information about the Partial Autocorrelation Function'),header=TRUE)
a<-table.element(a,'T-STAT',header=TRUE)
a<-table.element(a,'P-value',header=TRUE)
a<-table.row.end(a)
for (i in 1:par1) {
a<-table.row.start(a)
a<-table.element(a,i,header=TRUE)
a<-table.element(a,round(mypacf[i],6))
mytstat <- mypacf[i]*sqrtn
a<-table.element(a,round(mytstat,4))
a<-table.element(a,round(1-pt(abs(mytstat),lengthx),6))
a<-table.row.end(a)
}
a<-table.end(a)
table.save(a,file='mytable1.tab')