Free Statistics

of Irreproducible Research!

Author's title

Author*Unverified author*
R Software Modulerwasp_autocorrelation.wasp
Title produced by software(Partial) Autocorrelation Function
Date of computationThu, 05 Mar 2015 14:46:39 +0000
Cite this page as followsStatistical Computations at FreeStatistics.org, Office for Research Development and Education, URL https://freestatistics.org/blog/index.php?v=date/2015/Mar/05/t1425566832wh1pvrimvoz261z.htm/, Retrieved Fri, 17 May 2024 15:34:28 +0000
Statistical Computations at FreeStatistics.org, Office for Research Development and Education, URL https://freestatistics.org/blog/index.php?pk=277960, Retrieved Fri, 17 May 2024 15:34:28 +0000
QR Codes:

Original text written by user:
IsPrivate?No (this computation is public)
User-defined keywords
Estimated Impact90
Family? (F = Feedback message, R = changed R code, M = changed R Module, P = changed Parameters, D = changed Data)
-       [(Partial) Autocorrelation Function] [] [2015-03-05 14:46:39] [f51cc71db71177f4a98625dd32633bf7] [Current]
Feedback Forum

Post a new message
Dataseries X:
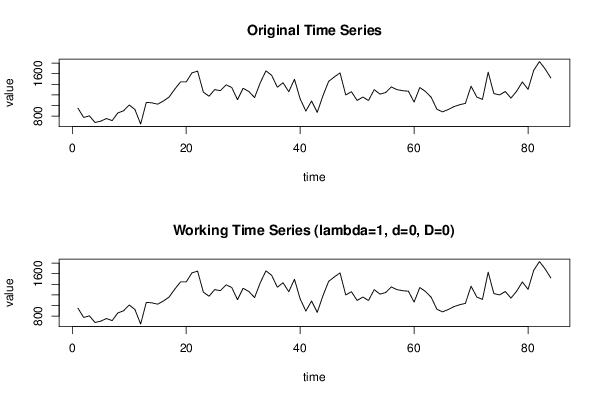
950
775
805
680
705
755
715
860
900
1010
925
650
1060
1050
1025
1085
1160
1310
1445
1445
1615
1650
1255
1175
1300
1280
1390
1340
1110
1325
1265
1150
1430
1655
1570
1345
1430
1260
1495
1125
895
1085
870
1185
1455
1540
1615
1200
1260
1095
1160
1095
1300
1215
1245
1350
1300
1280
1270
1065
1340
1265
1155
930
880
925
980
1015
1040
1365
1160
1115
1630
1225
1200
1265
1140
1270
1445
1305
1665
1830
1690
1520


Summary of computational transaction
Raw Inputview raw input (R code)
Raw Outputview raw output of R engine
Computing time2 seconds
R Server'Herman Ole Andreas Wold' @ wold.wessa.net

\begin{tabular}{lllllllll}
\hline
Summary of computational transaction \tabularnewline
Raw Input & view raw input (R code)  \tabularnewline
Raw Output & view raw output of R engine  \tabularnewline
Computing time & 2 seconds \tabularnewline
R Server & 'Herman Ole Andreas Wold' @ wold.wessa.net \tabularnewline
\hline
\end{tabular}
%Source: https://freestatistics.org/blog/index.php?pk=277960&T=0

[TABLE]
[ROW][C]Summary of computational transaction[/C][/ROW]
[ROW][C]Raw Input[/C][C]view raw input (R code) [/C][/ROW]
[ROW][C]Raw Output[/C][C]view raw output of R engine [/C][/ROW]
[ROW][C]Computing time[/C][C]2 seconds[/C][/ROW]
[ROW][C]R Server[/C][C]'Herman Ole Andreas Wold' @ wold.wessa.net[/C][/ROW]
[/TABLE]
Source: https://freestatistics.org/blog/index.php?pk=277960&T=0

Globally Unique Identifier (entire table): ba.freestatistics.org/blog/index.php?pk=277960&T=0

As an alternative you can also use a QR Code:  

The GUIDs for individual cells are displayed in the table below:

Summary of computational transaction
Raw Inputview raw input (R code)
Raw Outputview raw output of R engine
Computing time2 seconds
R Server'Herman Ole Andreas Wold' @ wold.wessa.net


Autocorrelation Function
Time lag kACF(k)T-STATP-value
10.7323566.71220
20.5607795.13961e-06
30.4396964.02996.1e-05
40.2478582.27170.012832
50.2053551.88210.031642
60.1450751.32960.093619
70.0983760.90160.184915
80.1390011.2740.103094
90.1185681.08670.140141
100.0579880.53150.298248
110.0852810.78160.218319
120.0754770.69180.245497
13-0.056749-0.52010.302177
14-0.093977-0.86130.195758
15-0.191212-1.75250.04167
16-0.213906-1.96050.026627
17-0.189753-1.73910.042839
18-0.247263-2.26620.013005
19-0.216124-1.98080.025443
20-0.159137-1.45850.074214
21-0.166429-1.52530.065465
22-0.130366-1.19480.117759
23-0.07422-0.68020.249111
24-0.013092-0.120.45239
250.0092550.08480.466303
260.0237010.21720.414279
27-0.042296-0.38760.349628
28-0.055631-0.50990.305742
29-0.143956-1.31940.095313
30-0.233816-2.1430.017505
31-0.180625-1.65550.050782
32-0.203783-1.86770.032645
33-0.143653-1.31660.095776
34-0.01449-0.13280.447332
350.030860.28280.389
360.1144691.04910.148564
370.0810660.7430.229782
38-0.008657-0.07930.468474
39-0.01914-0.17540.430586
40-0.070987-0.65060.258538
41-0.146634-1.34390.091297
42-0.109451-1.00310.159339
43-0.094718-0.86810.193905
44-0.084413-0.77370.220652
45-0.02543-0.23310.408136
460.0030750.02820.488793
470.0412820.37840.35306
480.1053620.96570.168493

\begin{tabular}{lllllllll}
\hline
Autocorrelation Function \tabularnewline
Time lag k & ACF(k) & T-STAT & P-value \tabularnewline
1 & 0.732356 & 6.7122 & 0 \tabularnewline
2 & 0.560779 & 5.1396 & 1e-06 \tabularnewline
3 & 0.439696 & 4.0299 & 6.1e-05 \tabularnewline
4 & 0.247858 & 2.2717 & 0.012832 \tabularnewline
5 & 0.205355 & 1.8821 & 0.031642 \tabularnewline
6 & 0.145075 & 1.3296 & 0.093619 \tabularnewline
7 & 0.098376 & 0.9016 & 0.184915 \tabularnewline
8 & 0.139001 & 1.274 & 0.103094 \tabularnewline
9 & 0.118568 & 1.0867 & 0.140141 \tabularnewline
10 & 0.057988 & 0.5315 & 0.298248 \tabularnewline
11 & 0.085281 & 0.7816 & 0.218319 \tabularnewline
12 & 0.075477 & 0.6918 & 0.245497 \tabularnewline
13 & -0.056749 & -0.5201 & 0.302177 \tabularnewline
14 & -0.093977 & -0.8613 & 0.195758 \tabularnewline
15 & -0.191212 & -1.7525 & 0.04167 \tabularnewline
16 & -0.213906 & -1.9605 & 0.026627 \tabularnewline
17 & -0.189753 & -1.7391 & 0.042839 \tabularnewline
18 & -0.247263 & -2.2662 & 0.013005 \tabularnewline
19 & -0.216124 & -1.9808 & 0.025443 \tabularnewline
20 & -0.159137 & -1.4585 & 0.074214 \tabularnewline
21 & -0.166429 & -1.5253 & 0.065465 \tabularnewline
22 & -0.130366 & -1.1948 & 0.117759 \tabularnewline
23 & -0.07422 & -0.6802 & 0.249111 \tabularnewline
24 & -0.013092 & -0.12 & 0.45239 \tabularnewline
25 & 0.009255 & 0.0848 & 0.466303 \tabularnewline
26 & 0.023701 & 0.2172 & 0.414279 \tabularnewline
27 & -0.042296 & -0.3876 & 0.349628 \tabularnewline
28 & -0.055631 & -0.5099 & 0.305742 \tabularnewline
29 & -0.143956 & -1.3194 & 0.095313 \tabularnewline
30 & -0.233816 & -2.143 & 0.017505 \tabularnewline
31 & -0.180625 & -1.6555 & 0.050782 \tabularnewline
32 & -0.203783 & -1.8677 & 0.032645 \tabularnewline
33 & -0.143653 & -1.3166 & 0.095776 \tabularnewline
34 & -0.01449 & -0.1328 & 0.447332 \tabularnewline
35 & 0.03086 & 0.2828 & 0.389 \tabularnewline
36 & 0.114469 & 1.0491 & 0.148564 \tabularnewline
37 & 0.081066 & 0.743 & 0.229782 \tabularnewline
38 & -0.008657 & -0.0793 & 0.468474 \tabularnewline
39 & -0.01914 & -0.1754 & 0.430586 \tabularnewline
40 & -0.070987 & -0.6506 & 0.258538 \tabularnewline
41 & -0.146634 & -1.3439 & 0.091297 \tabularnewline
42 & -0.109451 & -1.0031 & 0.159339 \tabularnewline
43 & -0.094718 & -0.8681 & 0.193905 \tabularnewline
44 & -0.084413 & -0.7737 & 0.220652 \tabularnewline
45 & -0.02543 & -0.2331 & 0.408136 \tabularnewline
46 & 0.003075 & 0.0282 & 0.488793 \tabularnewline
47 & 0.041282 & 0.3784 & 0.35306 \tabularnewline
48 & 0.105362 & 0.9657 & 0.168493 \tabularnewline
\hline
\end{tabular}
%Source: https://freestatistics.org/blog/index.php?pk=277960&T=1

[TABLE]
[ROW][C]Autocorrelation Function[/C][/ROW]
[ROW][C]Time lag k[/C][C]ACF(k)[/C][C]T-STAT[/C][C]P-value[/C][/ROW]
[ROW][C]1[/C][C]0.732356[/C][C]6.7122[/C][C]0[/C][/ROW]
[ROW][C]2[/C][C]0.560779[/C][C]5.1396[/C][C]1e-06[/C][/ROW]
[ROW][C]3[/C][C]0.439696[/C][C]4.0299[/C][C]6.1e-05[/C][/ROW]
[ROW][C]4[/C][C]0.247858[/C][C]2.2717[/C][C]0.012832[/C][/ROW]
[ROW][C]5[/C][C]0.205355[/C][C]1.8821[/C][C]0.031642[/C][/ROW]
[ROW][C]6[/C][C]0.145075[/C][C]1.3296[/C][C]0.093619[/C][/ROW]
[ROW][C]7[/C][C]0.098376[/C][C]0.9016[/C][C]0.184915[/C][/ROW]
[ROW][C]8[/C][C]0.139001[/C][C]1.274[/C][C]0.103094[/C][/ROW]
[ROW][C]9[/C][C]0.118568[/C][C]1.0867[/C][C]0.140141[/C][/ROW]
[ROW][C]10[/C][C]0.057988[/C][C]0.5315[/C][C]0.298248[/C][/ROW]
[ROW][C]11[/C][C]0.085281[/C][C]0.7816[/C][C]0.218319[/C][/ROW]
[ROW][C]12[/C][C]0.075477[/C][C]0.6918[/C][C]0.245497[/C][/ROW]
[ROW][C]13[/C][C]-0.056749[/C][C]-0.5201[/C][C]0.302177[/C][/ROW]
[ROW][C]14[/C][C]-0.093977[/C][C]-0.8613[/C][C]0.195758[/C][/ROW]
[ROW][C]15[/C][C]-0.191212[/C][C]-1.7525[/C][C]0.04167[/C][/ROW]
[ROW][C]16[/C][C]-0.213906[/C][C]-1.9605[/C][C]0.026627[/C][/ROW]
[ROW][C]17[/C][C]-0.189753[/C][C]-1.7391[/C][C]0.042839[/C][/ROW]
[ROW][C]18[/C][C]-0.247263[/C][C]-2.2662[/C][C]0.013005[/C][/ROW]
[ROW][C]19[/C][C]-0.216124[/C][C]-1.9808[/C][C]0.025443[/C][/ROW]
[ROW][C]20[/C][C]-0.159137[/C][C]-1.4585[/C][C]0.074214[/C][/ROW]
[ROW][C]21[/C][C]-0.166429[/C][C]-1.5253[/C][C]0.065465[/C][/ROW]
[ROW][C]22[/C][C]-0.130366[/C][C]-1.1948[/C][C]0.117759[/C][/ROW]
[ROW][C]23[/C][C]-0.07422[/C][C]-0.6802[/C][C]0.249111[/C][/ROW]
[ROW][C]24[/C][C]-0.013092[/C][C]-0.12[/C][C]0.45239[/C][/ROW]
[ROW][C]25[/C][C]0.009255[/C][C]0.0848[/C][C]0.466303[/C][/ROW]
[ROW][C]26[/C][C]0.023701[/C][C]0.2172[/C][C]0.414279[/C][/ROW]
[ROW][C]27[/C][C]-0.042296[/C][C]-0.3876[/C][C]0.349628[/C][/ROW]
[ROW][C]28[/C][C]-0.055631[/C][C]-0.5099[/C][C]0.305742[/C][/ROW]
[ROW][C]29[/C][C]-0.143956[/C][C]-1.3194[/C][C]0.095313[/C][/ROW]
[ROW][C]30[/C][C]-0.233816[/C][C]-2.143[/C][C]0.017505[/C][/ROW]
[ROW][C]31[/C][C]-0.180625[/C][C]-1.6555[/C][C]0.050782[/C][/ROW]
[ROW][C]32[/C][C]-0.203783[/C][C]-1.8677[/C][C]0.032645[/C][/ROW]
[ROW][C]33[/C][C]-0.143653[/C][C]-1.3166[/C][C]0.095776[/C][/ROW]
[ROW][C]34[/C][C]-0.01449[/C][C]-0.1328[/C][C]0.447332[/C][/ROW]
[ROW][C]35[/C][C]0.03086[/C][C]0.2828[/C][C]0.389[/C][/ROW]
[ROW][C]36[/C][C]0.114469[/C][C]1.0491[/C][C]0.148564[/C][/ROW]
[ROW][C]37[/C][C]0.081066[/C][C]0.743[/C][C]0.229782[/C][/ROW]
[ROW][C]38[/C][C]-0.008657[/C][C]-0.0793[/C][C]0.468474[/C][/ROW]
[ROW][C]39[/C][C]-0.01914[/C][C]-0.1754[/C][C]0.430586[/C][/ROW]
[ROW][C]40[/C][C]-0.070987[/C][C]-0.6506[/C][C]0.258538[/C][/ROW]
[ROW][C]41[/C][C]-0.146634[/C][C]-1.3439[/C][C]0.091297[/C][/ROW]
[ROW][C]42[/C][C]-0.109451[/C][C]-1.0031[/C][C]0.159339[/C][/ROW]
[ROW][C]43[/C][C]-0.094718[/C][C]-0.8681[/C][C]0.193905[/C][/ROW]
[ROW][C]44[/C][C]-0.084413[/C][C]-0.7737[/C][C]0.220652[/C][/ROW]
[ROW][C]45[/C][C]-0.02543[/C][C]-0.2331[/C][C]0.408136[/C][/ROW]
[ROW][C]46[/C][C]0.003075[/C][C]0.0282[/C][C]0.488793[/C][/ROW]
[ROW][C]47[/C][C]0.041282[/C][C]0.3784[/C][C]0.35306[/C][/ROW]
[ROW][C]48[/C][C]0.105362[/C][C]0.9657[/C][C]0.168493[/C][/ROW]
[/TABLE]
Source: https://freestatistics.org/blog/index.php?pk=277960&T=1

Globally Unique Identifier (entire table): ba.freestatistics.org/blog/index.php?pk=277960&T=1

As an alternative you can also use a QR Code:  

The GUIDs for individual cells are displayed in the table below:

Autocorrelation Function
Time lag kACF(k)T-STATP-value
10.7323566.71220
20.5607795.13961e-06
30.4396964.02996.1e-05
40.2478582.27170.012832
50.2053551.88210.031642
60.1450751.32960.093619
70.0983760.90160.184915
80.1390011.2740.103094
90.1185681.08670.140141
100.0579880.53150.298248
110.0852810.78160.218319
120.0754770.69180.245497
13-0.056749-0.52010.302177
14-0.093977-0.86130.195758
15-0.191212-1.75250.04167
16-0.213906-1.96050.026627
17-0.189753-1.73910.042839
18-0.247263-2.26620.013005
19-0.216124-1.98080.025443
20-0.159137-1.45850.074214
21-0.166429-1.52530.065465
22-0.130366-1.19480.117759
23-0.07422-0.68020.249111
24-0.013092-0.120.45239
250.0092550.08480.466303
260.0237010.21720.414279
27-0.042296-0.38760.349628
28-0.055631-0.50990.305742
29-0.143956-1.31940.095313
30-0.233816-2.1430.017505
31-0.180625-1.65550.050782
32-0.203783-1.86770.032645
33-0.143653-1.31660.095776
34-0.01449-0.13280.447332
350.030860.28280.389
360.1144691.04910.148564
370.0810660.7430.229782
38-0.008657-0.07930.468474
39-0.01914-0.17540.430586
40-0.070987-0.65060.258538
41-0.146634-1.34390.091297
42-0.109451-1.00310.159339
43-0.094718-0.86810.193905
44-0.084413-0.77370.220652
45-0.02543-0.23310.408136
460.0030750.02820.488793
470.0412820.37840.35306
480.1053620.96570.168493


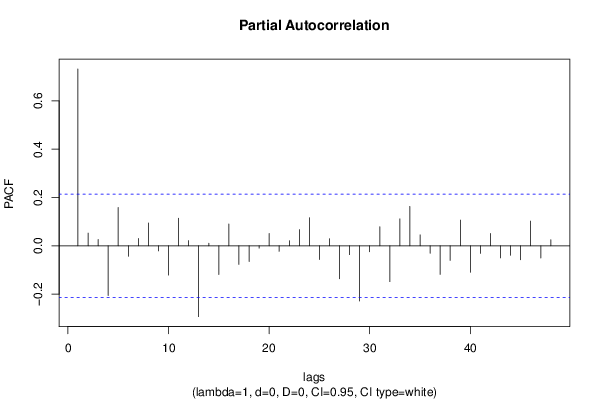
Partial Autocorrelation Function
Time lag kPACF(k)T-STATP-value
10.7323566.71220
20.0526980.4830.315181
30.0260710.23890.405865
4-0.205787-1.88610.031371
50.1587571.4550.074693
6-0.043073-0.39480.347008
70.0303320.2780.390849
80.0947740.86860.193764
9-0.021094-0.19330.423582
10-0.121225-1.1110.13486
110.1144431.04890.14862
120.0214820.19690.422196
13-0.293251-2.68770.004337
140.0104090.09540.462114
15-0.118792-1.08870.139689
160.0903380.8280.205019
17-0.076738-0.70330.241902
18-0.064731-0.59330.277299
19-0.009671-0.08860.464791
200.0507720.46530.321448
21-0.022875-0.20970.417224
220.0212550.19480.423007
230.0672720.61660.269596
240.1162721.06560.144818
25-0.056571-0.51850.302743
260.0293930.26940.394146
27-0.136277-1.2490.107568
28-0.036553-0.3350.369226
29-0.22815-2.0910.019774
30-0.024275-0.22250.412237
310.0791390.72530.235134
32-0.148313-1.35930.088842
330.1115261.02220.154822
340.1632491.49620.069174
350.0453860.4160.339245
36-0.030457-0.27910.39041
37-0.118289-1.08410.140703
38-0.060248-0.55220.291145
390.1064840.97590.165948
40-0.109255-1.00130.15977
41-0.031275-0.28660.387546
420.0513370.47050.319605
43-0.049898-0.45730.324311
44-0.038796-0.35560.361528
45-0.058034-0.53190.298102
460.1024690.93910.175175
47-0.050508-0.46290.322313
480.0254380.23310.408109

\begin{tabular}{lllllllll}
\hline
Partial Autocorrelation Function \tabularnewline
Time lag k & PACF(k) & T-STAT & P-value \tabularnewline
1 & 0.732356 & 6.7122 & 0 \tabularnewline
2 & 0.052698 & 0.483 & 0.315181 \tabularnewline
3 & 0.026071 & 0.2389 & 0.405865 \tabularnewline
4 & -0.205787 & -1.8861 & 0.031371 \tabularnewline
5 & 0.158757 & 1.455 & 0.074693 \tabularnewline
6 & -0.043073 & -0.3948 & 0.347008 \tabularnewline
7 & 0.030332 & 0.278 & 0.390849 \tabularnewline
8 & 0.094774 & 0.8686 & 0.193764 \tabularnewline
9 & -0.021094 & -0.1933 & 0.423582 \tabularnewline
10 & -0.121225 & -1.111 & 0.13486 \tabularnewline
11 & 0.114443 & 1.0489 & 0.14862 \tabularnewline
12 & 0.021482 & 0.1969 & 0.422196 \tabularnewline
13 & -0.293251 & -2.6877 & 0.004337 \tabularnewline
14 & 0.010409 & 0.0954 & 0.462114 \tabularnewline
15 & -0.118792 & -1.0887 & 0.139689 \tabularnewline
16 & 0.090338 & 0.828 & 0.205019 \tabularnewline
17 & -0.076738 & -0.7033 & 0.241902 \tabularnewline
18 & -0.064731 & -0.5933 & 0.277299 \tabularnewline
19 & -0.009671 & -0.0886 & 0.464791 \tabularnewline
20 & 0.050772 & 0.4653 & 0.321448 \tabularnewline
21 & -0.022875 & -0.2097 & 0.417224 \tabularnewline
22 & 0.021255 & 0.1948 & 0.423007 \tabularnewline
23 & 0.067272 & 0.6166 & 0.269596 \tabularnewline
24 & 0.116272 & 1.0656 & 0.144818 \tabularnewline
25 & -0.056571 & -0.5185 & 0.302743 \tabularnewline
26 & 0.029393 & 0.2694 & 0.394146 \tabularnewline
27 & -0.136277 & -1.249 & 0.107568 \tabularnewline
28 & -0.036553 & -0.335 & 0.369226 \tabularnewline
29 & -0.22815 & -2.091 & 0.019774 \tabularnewline
30 & -0.024275 & -0.2225 & 0.412237 \tabularnewline
31 & 0.079139 & 0.7253 & 0.235134 \tabularnewline
32 & -0.148313 & -1.3593 & 0.088842 \tabularnewline
33 & 0.111526 & 1.0222 & 0.154822 \tabularnewline
34 & 0.163249 & 1.4962 & 0.069174 \tabularnewline
35 & 0.045386 & 0.416 & 0.339245 \tabularnewline
36 & -0.030457 & -0.2791 & 0.39041 \tabularnewline
37 & -0.118289 & -1.0841 & 0.140703 \tabularnewline
38 & -0.060248 & -0.5522 & 0.291145 \tabularnewline
39 & 0.106484 & 0.9759 & 0.165948 \tabularnewline
40 & -0.109255 & -1.0013 & 0.15977 \tabularnewline
41 & -0.031275 & -0.2866 & 0.387546 \tabularnewline
42 & 0.051337 & 0.4705 & 0.319605 \tabularnewline
43 & -0.049898 & -0.4573 & 0.324311 \tabularnewline
44 & -0.038796 & -0.3556 & 0.361528 \tabularnewline
45 & -0.058034 & -0.5319 & 0.298102 \tabularnewline
46 & 0.102469 & 0.9391 & 0.175175 \tabularnewline
47 & -0.050508 & -0.4629 & 0.322313 \tabularnewline
48 & 0.025438 & 0.2331 & 0.408109 \tabularnewline
\hline
\end{tabular}
%Source: https://freestatistics.org/blog/index.php?pk=277960&T=2

[TABLE]
[ROW][C]Partial Autocorrelation Function[/C][/ROW]
[ROW][C]Time lag k[/C][C]PACF(k)[/C][C]T-STAT[/C][C]P-value[/C][/ROW]
[ROW][C]1[/C][C]0.732356[/C][C]6.7122[/C][C]0[/C][/ROW]
[ROW][C]2[/C][C]0.052698[/C][C]0.483[/C][C]0.315181[/C][/ROW]
[ROW][C]3[/C][C]0.026071[/C][C]0.2389[/C][C]0.405865[/C][/ROW]
[ROW][C]4[/C][C]-0.205787[/C][C]-1.8861[/C][C]0.031371[/C][/ROW]
[ROW][C]5[/C][C]0.158757[/C][C]1.455[/C][C]0.074693[/C][/ROW]
[ROW][C]6[/C][C]-0.043073[/C][C]-0.3948[/C][C]0.347008[/C][/ROW]
[ROW][C]7[/C][C]0.030332[/C][C]0.278[/C][C]0.390849[/C][/ROW]
[ROW][C]8[/C][C]0.094774[/C][C]0.8686[/C][C]0.193764[/C][/ROW]
[ROW][C]9[/C][C]-0.021094[/C][C]-0.1933[/C][C]0.423582[/C][/ROW]
[ROW][C]10[/C][C]-0.121225[/C][C]-1.111[/C][C]0.13486[/C][/ROW]
[ROW][C]11[/C][C]0.114443[/C][C]1.0489[/C][C]0.14862[/C][/ROW]
[ROW][C]12[/C][C]0.021482[/C][C]0.1969[/C][C]0.422196[/C][/ROW]
[ROW][C]13[/C][C]-0.293251[/C][C]-2.6877[/C][C]0.004337[/C][/ROW]
[ROW][C]14[/C][C]0.010409[/C][C]0.0954[/C][C]0.462114[/C][/ROW]
[ROW][C]15[/C][C]-0.118792[/C][C]-1.0887[/C][C]0.139689[/C][/ROW]
[ROW][C]16[/C][C]0.090338[/C][C]0.828[/C][C]0.205019[/C][/ROW]
[ROW][C]17[/C][C]-0.076738[/C][C]-0.7033[/C][C]0.241902[/C][/ROW]
[ROW][C]18[/C][C]-0.064731[/C][C]-0.5933[/C][C]0.277299[/C][/ROW]
[ROW][C]19[/C][C]-0.009671[/C][C]-0.0886[/C][C]0.464791[/C][/ROW]
[ROW][C]20[/C][C]0.050772[/C][C]0.4653[/C][C]0.321448[/C][/ROW]
[ROW][C]21[/C][C]-0.022875[/C][C]-0.2097[/C][C]0.417224[/C][/ROW]
[ROW][C]22[/C][C]0.021255[/C][C]0.1948[/C][C]0.423007[/C][/ROW]
[ROW][C]23[/C][C]0.067272[/C][C]0.6166[/C][C]0.269596[/C][/ROW]
[ROW][C]24[/C][C]0.116272[/C][C]1.0656[/C][C]0.144818[/C][/ROW]
[ROW][C]25[/C][C]-0.056571[/C][C]-0.5185[/C][C]0.302743[/C][/ROW]
[ROW][C]26[/C][C]0.029393[/C][C]0.2694[/C][C]0.394146[/C][/ROW]
[ROW][C]27[/C][C]-0.136277[/C][C]-1.249[/C][C]0.107568[/C][/ROW]
[ROW][C]28[/C][C]-0.036553[/C][C]-0.335[/C][C]0.369226[/C][/ROW]
[ROW][C]29[/C][C]-0.22815[/C][C]-2.091[/C][C]0.019774[/C][/ROW]
[ROW][C]30[/C][C]-0.024275[/C][C]-0.2225[/C][C]0.412237[/C][/ROW]
[ROW][C]31[/C][C]0.079139[/C][C]0.7253[/C][C]0.235134[/C][/ROW]
[ROW][C]32[/C][C]-0.148313[/C][C]-1.3593[/C][C]0.088842[/C][/ROW]
[ROW][C]33[/C][C]0.111526[/C][C]1.0222[/C][C]0.154822[/C][/ROW]
[ROW][C]34[/C][C]0.163249[/C][C]1.4962[/C][C]0.069174[/C][/ROW]
[ROW][C]35[/C][C]0.045386[/C][C]0.416[/C][C]0.339245[/C][/ROW]
[ROW][C]36[/C][C]-0.030457[/C][C]-0.2791[/C][C]0.39041[/C][/ROW]
[ROW][C]37[/C][C]-0.118289[/C][C]-1.0841[/C][C]0.140703[/C][/ROW]
[ROW][C]38[/C][C]-0.060248[/C][C]-0.5522[/C][C]0.291145[/C][/ROW]
[ROW][C]39[/C][C]0.106484[/C][C]0.9759[/C][C]0.165948[/C][/ROW]
[ROW][C]40[/C][C]-0.109255[/C][C]-1.0013[/C][C]0.15977[/C][/ROW]
[ROW][C]41[/C][C]-0.031275[/C][C]-0.2866[/C][C]0.387546[/C][/ROW]
[ROW][C]42[/C][C]0.051337[/C][C]0.4705[/C][C]0.319605[/C][/ROW]
[ROW][C]43[/C][C]-0.049898[/C][C]-0.4573[/C][C]0.324311[/C][/ROW]
[ROW][C]44[/C][C]-0.038796[/C][C]-0.3556[/C][C]0.361528[/C][/ROW]
[ROW][C]45[/C][C]-0.058034[/C][C]-0.5319[/C][C]0.298102[/C][/ROW]
[ROW][C]46[/C][C]0.102469[/C][C]0.9391[/C][C]0.175175[/C][/ROW]
[ROW][C]47[/C][C]-0.050508[/C][C]-0.4629[/C][C]0.322313[/C][/ROW]
[ROW][C]48[/C][C]0.025438[/C][C]0.2331[/C][C]0.408109[/C][/ROW]
[/TABLE]
Source: https://freestatistics.org/blog/index.php?pk=277960&T=2

Globally Unique Identifier (entire table): ba.freestatistics.org/blog/index.php?pk=277960&T=2

As an alternative you can also use a QR Code:  

The GUIDs for individual cells are displayed in the table below:

Partial Autocorrelation Function
Time lag kPACF(k)T-STATP-value
10.7323566.71220
20.0526980.4830.315181
30.0260710.23890.405865
4-0.205787-1.88610.031371
50.1587571.4550.074693
6-0.043073-0.39480.347008
70.0303320.2780.390849
80.0947740.86860.193764
9-0.021094-0.19330.423582
10-0.121225-1.1110.13486
110.1144431.04890.14862
120.0214820.19690.422196
13-0.293251-2.68770.004337
140.0104090.09540.462114
15-0.118792-1.08870.139689
160.0903380.8280.205019
17-0.076738-0.70330.241902
18-0.064731-0.59330.277299
19-0.009671-0.08860.464791
200.0507720.46530.321448
21-0.022875-0.20970.417224
220.0212550.19480.423007
230.0672720.61660.269596
240.1162721.06560.144818
25-0.056571-0.51850.302743
260.0293930.26940.394146
27-0.136277-1.2490.107568
28-0.036553-0.3350.369226
29-0.22815-2.0910.019774
30-0.024275-0.22250.412237
310.0791390.72530.235134
32-0.148313-1.35930.088842
330.1115261.02220.154822
340.1632491.49620.069174
350.0453860.4160.339245
36-0.030457-0.27910.39041
37-0.118289-1.08410.140703
38-0.060248-0.55220.291145
390.1064840.97590.165948
40-0.109255-1.00130.15977
41-0.031275-0.28660.387546
420.0513370.47050.319605
43-0.049898-0.45730.324311
44-0.038796-0.35560.361528
45-0.058034-0.53190.298102
460.1024690.93910.175175
47-0.050508-0.46290.322313
480.0254380.23310.408109


Parameters (Session):
par1 = 48 ; par2 = 1 ; par3 = 0 ; par4 = 0 ; par5 = 12 ; par6 = White Noise ; par7 = 0.95 ;
Parameters (R input):
par1 = 48 ; par2 = 1 ; par3 = 0 ; par4 = 0 ; par5 = 12 ; par6 = White Noise ; par7 = 0.95 ; par8 = ;
R code (references can be found in the software module):
if (par1 == 'Default') {
par1 = 10*log10(length(x))
} else {
par1 <- as.numeric(par1)
}
par2 <- as.numeric(par2)
par3 <- as.numeric(par3)
par4 <- as.numeric(par4)
par5 <- as.numeric(par5)
if (par6 == 'White Noise') par6 <- 'white' else par6 <- 'ma'
par7 <- as.numeric(par7)
if (par8 != '') par8 <- as.numeric(par8)
ox <- x
if (par8 == '') {
if (par2 == 0) {
x <- log(x)
} else {
x <- (x ^ par2 - 1) / par2
}
} else {
x <- log(x,base=par8)
}
if (par3 > 0) x <- diff(x,lag=1,difference=par3)
if (par4 > 0) x <- diff(x,lag=par5,difference=par4)
bitmap(file='picts.png')
op <- par(mfrow=c(2,1))
plot(ox,type='l',main='Original Time Series',xlab='time',ylab='value')
if (par8=='') {
mytitle <- paste('Working Time Series (lambda=',par2,', d=',par3,', D=',par4,')',sep='')
mysub <- paste('(lambda=',par2,', d=',par3,', D=',par4,', CI=', par7, ', CI type=',par6,')',sep='')
} else {
mytitle <- paste('Working Time Series (base=',par8,', d=',par3,', D=',par4,')',sep='')
mysub <- paste('(base=',par8,', d=',par3,', D=',par4,', CI=', par7, ', CI type=',par6,')',sep='')
}
plot(x,type='l', main=mytitle,xlab='time',ylab='value')
par(op)
dev.off()
bitmap(file='pic1.png')
racf <- acf(x, par1, main='Autocorrelation', xlab='time lag', ylab='ACF', ci.type=par6, ci=par7, sub=mysub)
dev.off()
bitmap(file='pic2.png')
rpacf <- pacf(x,par1,main='Partial Autocorrelation',xlab='lags',ylab='PACF',sub=mysub)
dev.off()
(myacf <- c(racf$acf))
(mypacf <- c(rpacf$acf))
lengthx <- length(x)
sqrtn <- sqrt(lengthx)
load(file='createtable')
a<-table.start()
a<-table.row.start(a)
a<-table.element(a,'Autocorrelation Function',4,TRUE)
a<-table.row.end(a)
a<-table.row.start(a)
a<-table.element(a,'Time lag k',header=TRUE)
a<-table.element(a,hyperlink('basics.htm','ACF(k)','click here for more information about the Autocorrelation Function'),header=TRUE)
a<-table.element(a,'T-STAT',header=TRUE)
a<-table.element(a,'P-value',header=TRUE)
a<-table.row.end(a)
for (i in 2:(par1+1)) {
a<-table.row.start(a)
a<-table.element(a,i-1,header=TRUE)
a<-table.element(a,round(myacf[i],6))
mytstat <- myacf[i]*sqrtn
a<-table.element(a,round(mytstat,4))
a<-table.element(a,round(1-pt(abs(mytstat),lengthx),6))
a<-table.row.end(a)
}
a<-table.end(a)
table.save(a,file='mytable.tab')
a<-table.start()
a<-table.row.start(a)
a<-table.element(a,'Partial Autocorrelation Function',4,TRUE)
a<-table.row.end(a)
a<-table.row.start(a)
a<-table.element(a,'Time lag k',header=TRUE)
a<-table.element(a,hyperlink('basics.htm','PACF(k)','click here for more information about the Partial Autocorrelation Function'),header=TRUE)
a<-table.element(a,'T-STAT',header=TRUE)
a<-table.element(a,'P-value',header=TRUE)
a<-table.row.end(a)
for (i in 1:par1) {
a<-table.row.start(a)
a<-table.element(a,i,header=TRUE)
a<-table.element(a,round(mypacf[i],6))
mytstat <- mypacf[i]*sqrtn
a<-table.element(a,round(mytstat,4))
a<-table.element(a,round(1-pt(abs(mytstat),lengthx),6))
a<-table.row.end(a)
}
a<-table.end(a)
table.save(a,file='mytable1.tab')