Free Statistics

of Irreproducible Research!

Author's title

Author*Unverified author*
R Software Modulerwasp_autocorrelation.wasp
Title produced by software(Partial) Autocorrelation Function
Date of computationThu, 05 Mar 2015 17:17:36 +0000
Cite this page as followsStatistical Computations at FreeStatistics.org, Office for Research Development and Education, URL https://freestatistics.org/blog/index.php?v=date/2015/Mar/05/t1425575900lv34qrnyu4sdyp4.htm/, Retrieved Fri, 17 May 2024 16:31:00 +0000
Statistical Computations at FreeStatistics.org, Office for Research Development and Education, URL https://freestatistics.org/blog/index.php?pk=277970, Retrieved Fri, 17 May 2024 16:31:00 +0000
QR Codes:

Original text written by user:
IsPrivate?No (this computation is public)
User-defined keywords
Estimated Impact99
Family? (F = Feedback message, R = changed R code, M = changed R Module, P = changed Parameters, D = changed Data)
-       [(Partial) Autocorrelation Function] [] [2015-03-05 17:17:36] [464dfecbd4863ecbf0b1962220ac611d] [Current]
Feedback Forum

Post a new message
Dataseries X:
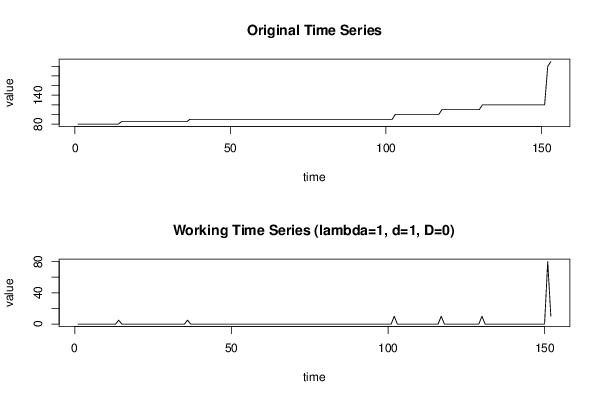
80
80
80
80
80
80
80
80
80
80
80
80
80
80
85
85
85
85
85
85
85
85
85
85
85
85
85
85
85
85
85
85
85
85
85
85
90
90
90
90
90
90
90
90
90
90
90
90
90
90
90
90
90
90
90
90
90
90
90
90
90
90
90
90
90
90
90
90
90
90
90
90
90
90
90
90
90
90
90
90
90
90
90
90
90
90
90
90
90
90
90
90
90
90
90
90
90
90
90
90
90
90
100
100
100
100
100
100
100
100
100
100
100
100
100
100
100
110
110
110
110
110
110
110
110
110
110
110
110
110
120
120
120
120
120
120
120
120
120
120
120
120
120
120
120
120
120
120
120
120
120
200
210


Summary of computational transaction
Raw Inputview raw input (R code)
Raw Outputview raw output of R engine
Computing time2 seconds
R Server'Gwilym Jenkins' @ jenkins.wessa.net

\begin{tabular}{lllllllll}
\hline
Summary of computational transaction \tabularnewline
Raw Input & view raw input (R code)  \tabularnewline
Raw Output & view raw output of R engine  \tabularnewline
Computing time & 2 seconds \tabularnewline
R Server & 'Gwilym Jenkins' @ jenkins.wessa.net \tabularnewline
\hline
\end{tabular}
%Source: https://freestatistics.org/blog/index.php?pk=277970&T=0

[TABLE]
[ROW][C]Summary of computational transaction[/C][/ROW]
[ROW][C]Raw Input[/C][C]view raw input (R code) [/C][/ROW]
[ROW][C]Raw Output[/C][C]view raw output of R engine [/C][/ROW]
[ROW][C]Computing time[/C][C]2 seconds[/C][/ROW]
[ROW][C]R Server[/C][C]'Gwilym Jenkins' @ jenkins.wessa.net[/C][/ROW]
[/TABLE]
Source: https://freestatistics.org/blog/index.php?pk=277970&T=0

Globally Unique Identifier (entire table): ba.freestatistics.org/blog/index.php?pk=277970&T=0

As an alternative you can also use a QR Code:  

The GUIDs for individual cells are displayed in the table below:

Summary of computational transaction
Raw Inputview raw input (R code)
Raw Outputview raw output of R engine
Computing time2 seconds
R Server'Gwilym Jenkins' @ jenkins.wessa.net


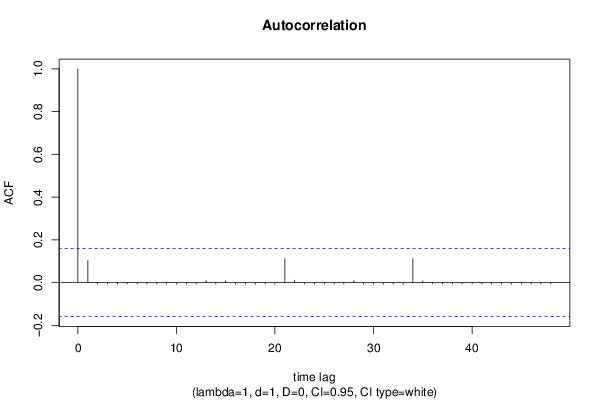
Autocorrelation Function
Time lag kACF(k)T-STATP-value
10.1033771.27450.102213
2-0.005294-0.06530.474024
3-0.005402-0.06660.473492
4-0.005511-0.06790.472961
5-0.005619-0.06930.472429
6-0.005728-0.07060.471897
7-0.005836-0.0720.471365
8-0.005945-0.07330.470834
9-0.006054-0.07460.470302
10-0.006162-0.0760.469771
11-0.006271-0.07730.469239
12-0.006379-0.07860.468708
130.0083520.1030.459063
14-0.005962-0.07350.470752
150.0087690.10810.457024
16-0.006179-0.07620.469689
17-0.006287-0.07750.469158
18-0.006396-0.07890.468626
19-0.006504-0.08020.468095
20-0.006613-0.08150.467564
210.1119941.38080.084691
220.0117190.14450.442655
23-0.005669-0.06990.472183
24-0.005778-0.07120.471652
25-0.005887-0.07260.47112
26-0.005995-0.07390.470589
27-0.006104-0.07530.470057
280.0086270.10640.457717
29-0.006321-0.07790.468994
30-0.006429-0.07930.468463
31-0.006538-0.08060.467931
32-0.006646-0.08190.4674
33-0.006755-0.08330.466869
340.1118521.3790.08496
350.0078670.0970.461429
36-0.005177-0.06380.474597
37-0.005285-0.06520.474065
38-0.005394-0.06650.473533
39-0.005502-0.06780.473001
40-0.005611-0.06920.47247
41-0.00572-0.07050.471938
42-0.005828-0.07190.471406
43-0.005937-0.07320.470875
44-0.006045-0.07450.470343
45-0.006154-0.07590.469812
46-0.006262-0.07720.46928
47-0.006371-0.07850.468749
48-0.006479-0.07990.468218

\begin{tabular}{lllllllll}
\hline
Autocorrelation Function \tabularnewline
Time lag k & ACF(k) & T-STAT & P-value \tabularnewline
1 & 0.103377 & 1.2745 & 0.102213 \tabularnewline
2 & -0.005294 & -0.0653 & 0.474024 \tabularnewline
3 & -0.005402 & -0.0666 & 0.473492 \tabularnewline
4 & -0.005511 & -0.0679 & 0.472961 \tabularnewline
5 & -0.005619 & -0.0693 & 0.472429 \tabularnewline
6 & -0.005728 & -0.0706 & 0.471897 \tabularnewline
7 & -0.005836 & -0.072 & 0.471365 \tabularnewline
8 & -0.005945 & -0.0733 & 0.470834 \tabularnewline
9 & -0.006054 & -0.0746 & 0.470302 \tabularnewline
10 & -0.006162 & -0.076 & 0.469771 \tabularnewline
11 & -0.006271 & -0.0773 & 0.469239 \tabularnewline
12 & -0.006379 & -0.0786 & 0.468708 \tabularnewline
13 & 0.008352 & 0.103 & 0.459063 \tabularnewline
14 & -0.005962 & -0.0735 & 0.470752 \tabularnewline
15 & 0.008769 & 0.1081 & 0.457024 \tabularnewline
16 & -0.006179 & -0.0762 & 0.469689 \tabularnewline
17 & -0.006287 & -0.0775 & 0.469158 \tabularnewline
18 & -0.006396 & -0.0789 & 0.468626 \tabularnewline
19 & -0.006504 & -0.0802 & 0.468095 \tabularnewline
20 & -0.006613 & -0.0815 & 0.467564 \tabularnewline
21 & 0.111994 & 1.3808 & 0.084691 \tabularnewline
22 & 0.011719 & 0.1445 & 0.442655 \tabularnewline
23 & -0.005669 & -0.0699 & 0.472183 \tabularnewline
24 & -0.005778 & -0.0712 & 0.471652 \tabularnewline
25 & -0.005887 & -0.0726 & 0.47112 \tabularnewline
26 & -0.005995 & -0.0739 & 0.470589 \tabularnewline
27 & -0.006104 & -0.0753 & 0.470057 \tabularnewline
28 & 0.008627 & 0.1064 & 0.457717 \tabularnewline
29 & -0.006321 & -0.0779 & 0.468994 \tabularnewline
30 & -0.006429 & -0.0793 & 0.468463 \tabularnewline
31 & -0.006538 & -0.0806 & 0.467931 \tabularnewline
32 & -0.006646 & -0.0819 & 0.4674 \tabularnewline
33 & -0.006755 & -0.0833 & 0.466869 \tabularnewline
34 & 0.111852 & 1.379 & 0.08496 \tabularnewline
35 & 0.007867 & 0.097 & 0.461429 \tabularnewline
36 & -0.005177 & -0.0638 & 0.474597 \tabularnewline
37 & -0.005285 & -0.0652 & 0.474065 \tabularnewline
38 & -0.005394 & -0.0665 & 0.473533 \tabularnewline
39 & -0.005502 & -0.0678 & 0.473001 \tabularnewline
40 & -0.005611 & -0.0692 & 0.47247 \tabularnewline
41 & -0.00572 & -0.0705 & 0.471938 \tabularnewline
42 & -0.005828 & -0.0719 & 0.471406 \tabularnewline
43 & -0.005937 & -0.0732 & 0.470875 \tabularnewline
44 & -0.006045 & -0.0745 & 0.470343 \tabularnewline
45 & -0.006154 & -0.0759 & 0.469812 \tabularnewline
46 & -0.006262 & -0.0772 & 0.46928 \tabularnewline
47 & -0.006371 & -0.0785 & 0.468749 \tabularnewline
48 & -0.006479 & -0.0799 & 0.468218 \tabularnewline
\hline
\end{tabular}
%Source: https://freestatistics.org/blog/index.php?pk=277970&T=1

[TABLE]
[ROW][C]Autocorrelation Function[/C][/ROW]
[ROW][C]Time lag k[/C][C]ACF(k)[/C][C]T-STAT[/C][C]P-value[/C][/ROW]
[ROW][C]1[/C][C]0.103377[/C][C]1.2745[/C][C]0.102213[/C][/ROW]
[ROW][C]2[/C][C]-0.005294[/C][C]-0.0653[/C][C]0.474024[/C][/ROW]
[ROW][C]3[/C][C]-0.005402[/C][C]-0.0666[/C][C]0.473492[/C][/ROW]
[ROW][C]4[/C][C]-0.005511[/C][C]-0.0679[/C][C]0.472961[/C][/ROW]
[ROW][C]5[/C][C]-0.005619[/C][C]-0.0693[/C][C]0.472429[/C][/ROW]
[ROW][C]6[/C][C]-0.005728[/C][C]-0.0706[/C][C]0.471897[/C][/ROW]
[ROW][C]7[/C][C]-0.005836[/C][C]-0.072[/C][C]0.471365[/C][/ROW]
[ROW][C]8[/C][C]-0.005945[/C][C]-0.0733[/C][C]0.470834[/C][/ROW]
[ROW][C]9[/C][C]-0.006054[/C][C]-0.0746[/C][C]0.470302[/C][/ROW]
[ROW][C]10[/C][C]-0.006162[/C][C]-0.076[/C][C]0.469771[/C][/ROW]
[ROW][C]11[/C][C]-0.006271[/C][C]-0.0773[/C][C]0.469239[/C][/ROW]
[ROW][C]12[/C][C]-0.006379[/C][C]-0.0786[/C][C]0.468708[/C][/ROW]
[ROW][C]13[/C][C]0.008352[/C][C]0.103[/C][C]0.459063[/C][/ROW]
[ROW][C]14[/C][C]-0.005962[/C][C]-0.0735[/C][C]0.470752[/C][/ROW]
[ROW][C]15[/C][C]0.008769[/C][C]0.1081[/C][C]0.457024[/C][/ROW]
[ROW][C]16[/C][C]-0.006179[/C][C]-0.0762[/C][C]0.469689[/C][/ROW]
[ROW][C]17[/C][C]-0.006287[/C][C]-0.0775[/C][C]0.469158[/C][/ROW]
[ROW][C]18[/C][C]-0.006396[/C][C]-0.0789[/C][C]0.468626[/C][/ROW]
[ROW][C]19[/C][C]-0.006504[/C][C]-0.0802[/C][C]0.468095[/C][/ROW]
[ROW][C]20[/C][C]-0.006613[/C][C]-0.0815[/C][C]0.467564[/C][/ROW]
[ROW][C]21[/C][C]0.111994[/C][C]1.3808[/C][C]0.084691[/C][/ROW]
[ROW][C]22[/C][C]0.011719[/C][C]0.1445[/C][C]0.442655[/C][/ROW]
[ROW][C]23[/C][C]-0.005669[/C][C]-0.0699[/C][C]0.472183[/C][/ROW]
[ROW][C]24[/C][C]-0.005778[/C][C]-0.0712[/C][C]0.471652[/C][/ROW]
[ROW][C]25[/C][C]-0.005887[/C][C]-0.0726[/C][C]0.47112[/C][/ROW]
[ROW][C]26[/C][C]-0.005995[/C][C]-0.0739[/C][C]0.470589[/C][/ROW]
[ROW][C]27[/C][C]-0.006104[/C][C]-0.0753[/C][C]0.470057[/C][/ROW]
[ROW][C]28[/C][C]0.008627[/C][C]0.1064[/C][C]0.457717[/C][/ROW]
[ROW][C]29[/C][C]-0.006321[/C][C]-0.0779[/C][C]0.468994[/C][/ROW]
[ROW][C]30[/C][C]-0.006429[/C][C]-0.0793[/C][C]0.468463[/C][/ROW]
[ROW][C]31[/C][C]-0.006538[/C][C]-0.0806[/C][C]0.467931[/C][/ROW]
[ROW][C]32[/C][C]-0.006646[/C][C]-0.0819[/C][C]0.4674[/C][/ROW]
[ROW][C]33[/C][C]-0.006755[/C][C]-0.0833[/C][C]0.466869[/C][/ROW]
[ROW][C]34[/C][C]0.111852[/C][C]1.379[/C][C]0.08496[/C][/ROW]
[ROW][C]35[/C][C]0.007867[/C][C]0.097[/C][C]0.461429[/C][/ROW]
[ROW][C]36[/C][C]-0.005177[/C][C]-0.0638[/C][C]0.474597[/C][/ROW]
[ROW][C]37[/C][C]-0.005285[/C][C]-0.0652[/C][C]0.474065[/C][/ROW]
[ROW][C]38[/C][C]-0.005394[/C][C]-0.0665[/C][C]0.473533[/C][/ROW]
[ROW][C]39[/C][C]-0.005502[/C][C]-0.0678[/C][C]0.473001[/C][/ROW]
[ROW][C]40[/C][C]-0.005611[/C][C]-0.0692[/C][C]0.47247[/C][/ROW]
[ROW][C]41[/C][C]-0.00572[/C][C]-0.0705[/C][C]0.471938[/C][/ROW]
[ROW][C]42[/C][C]-0.005828[/C][C]-0.0719[/C][C]0.471406[/C][/ROW]
[ROW][C]43[/C][C]-0.005937[/C][C]-0.0732[/C][C]0.470875[/C][/ROW]
[ROW][C]44[/C][C]-0.006045[/C][C]-0.0745[/C][C]0.470343[/C][/ROW]
[ROW][C]45[/C][C]-0.006154[/C][C]-0.0759[/C][C]0.469812[/C][/ROW]
[ROW][C]46[/C][C]-0.006262[/C][C]-0.0772[/C][C]0.46928[/C][/ROW]
[ROW][C]47[/C][C]-0.006371[/C][C]-0.0785[/C][C]0.468749[/C][/ROW]
[ROW][C]48[/C][C]-0.006479[/C][C]-0.0799[/C][C]0.468218[/C][/ROW]
[/TABLE]
Source: https://freestatistics.org/blog/index.php?pk=277970&T=1

Globally Unique Identifier (entire table): ba.freestatistics.org/blog/index.php?pk=277970&T=1

As an alternative you can also use a QR Code:  

The GUIDs for individual cells are displayed in the table below:

Autocorrelation Function
Time lag kACF(k)T-STATP-value
10.1033771.27450.102213
2-0.005294-0.06530.474024
3-0.005402-0.06660.473492
4-0.005511-0.06790.472961
5-0.005619-0.06930.472429
6-0.005728-0.07060.471897
7-0.005836-0.0720.471365
8-0.005945-0.07330.470834
9-0.006054-0.07460.470302
10-0.006162-0.0760.469771
11-0.006271-0.07730.469239
12-0.006379-0.07860.468708
130.0083520.1030.459063
14-0.005962-0.07350.470752
150.0087690.10810.457024
16-0.006179-0.07620.469689
17-0.006287-0.07750.469158
18-0.006396-0.07890.468626
19-0.006504-0.08020.468095
20-0.006613-0.08150.467564
210.1119941.38080.084691
220.0117190.14450.442655
23-0.005669-0.06990.472183
24-0.005778-0.07120.471652
25-0.005887-0.07260.47112
26-0.005995-0.07390.470589
27-0.006104-0.07530.470057
280.0086270.10640.457717
29-0.006321-0.07790.468994
30-0.006429-0.07930.468463
31-0.006538-0.08060.467931
32-0.006646-0.08190.4674
33-0.006755-0.08330.466869
340.1118521.3790.08496
350.0078670.0970.461429
36-0.005177-0.06380.474597
37-0.005285-0.06520.474065
38-0.005394-0.06650.473533
39-0.005502-0.06780.473001
40-0.005611-0.06920.47247
41-0.00572-0.07050.471938
42-0.005828-0.07190.471406
43-0.005937-0.07320.470875
44-0.006045-0.07450.470343
45-0.006154-0.07590.469812
46-0.006262-0.07720.46928
47-0.006371-0.07850.468749
48-0.006479-0.07990.468218


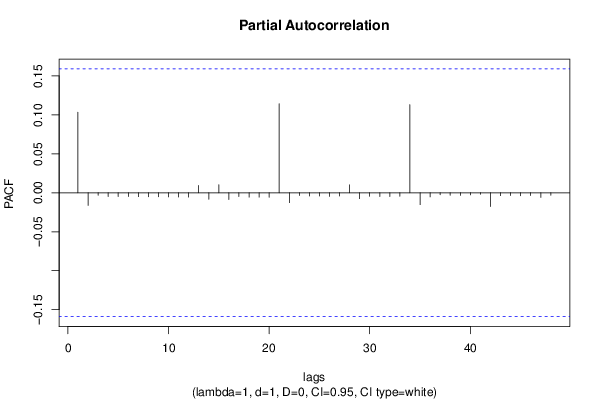
Partial Autocorrelation Function
Time lag kPACF(k)T-STATP-value
10.1033771.27450.102213
2-0.016153-0.19910.421206
3-0.003211-0.03960.484234
4-0.004747-0.05850.476702
5-0.004702-0.0580.476925
6-0.00483-0.05960.476295
7-0.004941-0.06090.475753
8-0.005055-0.06230.475195
9-0.005169-0.06370.474633
10-0.005285-0.06520.474066
11-0.005402-0.06660.473493
12-0.00552-0.06810.472915
130.0093680.11550.454103
14-0.008264-0.10190.459491
150.0102830.12680.449641
16-0.008581-0.10580.457945
17-0.00481-0.05930.476394
18-0.005553-0.06850.472754
19-0.005576-0.06870.472643
20-0.005704-0.07030.472013
210.1142931.40910.080424
22-0.01262-0.15560.438282
23-0.003558-0.04390.482536
24-0.004174-0.05150.479512
25-0.004209-0.05190.479343
26-0.004611-0.05680.477371
27-0.004066-0.05010.48004
280.010150.12510.450292
29-0.007461-0.0920.463416
30-0.00434-0.05350.478701
31-0.004676-0.05760.477052
32-0.004816-0.05940.476365
33-0.004453-0.05490.478145
340.1131461.3950.082531
35-0.015212-0.18750.425744
36-0.005206-0.06420.474456
37-0.002542-0.03130.48752
38-0.003149-0.03880.484543
39-0.003271-0.04030.48394
40-0.002685-0.03310.48682
41-0.001878-0.02320.490777
42-0.017609-0.21710.414211
43-0.003682-0.04540.481928
44-0.003549-0.04380.48258
45-0.003892-0.0480.480896
46-0.003593-0.04430.482361
47-0.005913-0.07290.470991
48-0.003051-0.03760.485024

\begin{tabular}{lllllllll}
\hline
Partial Autocorrelation Function \tabularnewline
Time lag k & PACF(k) & T-STAT & P-value \tabularnewline
1 & 0.103377 & 1.2745 & 0.102213 \tabularnewline
2 & -0.016153 & -0.1991 & 0.421206 \tabularnewline
3 & -0.003211 & -0.0396 & 0.484234 \tabularnewline
4 & -0.004747 & -0.0585 & 0.476702 \tabularnewline
5 & -0.004702 & -0.058 & 0.476925 \tabularnewline
6 & -0.00483 & -0.0596 & 0.476295 \tabularnewline
7 & -0.004941 & -0.0609 & 0.475753 \tabularnewline
8 & -0.005055 & -0.0623 & 0.475195 \tabularnewline
9 & -0.005169 & -0.0637 & 0.474633 \tabularnewline
10 & -0.005285 & -0.0652 & 0.474066 \tabularnewline
11 & -0.005402 & -0.0666 & 0.473493 \tabularnewline
12 & -0.00552 & -0.0681 & 0.472915 \tabularnewline
13 & 0.009368 & 0.1155 & 0.454103 \tabularnewline
14 & -0.008264 & -0.1019 & 0.459491 \tabularnewline
15 & 0.010283 & 0.1268 & 0.449641 \tabularnewline
16 & -0.008581 & -0.1058 & 0.457945 \tabularnewline
17 & -0.00481 & -0.0593 & 0.476394 \tabularnewline
18 & -0.005553 & -0.0685 & 0.472754 \tabularnewline
19 & -0.005576 & -0.0687 & 0.472643 \tabularnewline
20 & -0.005704 & -0.0703 & 0.472013 \tabularnewline
21 & 0.114293 & 1.4091 & 0.080424 \tabularnewline
22 & -0.01262 & -0.1556 & 0.438282 \tabularnewline
23 & -0.003558 & -0.0439 & 0.482536 \tabularnewline
24 & -0.004174 & -0.0515 & 0.479512 \tabularnewline
25 & -0.004209 & -0.0519 & 0.479343 \tabularnewline
26 & -0.004611 & -0.0568 & 0.477371 \tabularnewline
27 & -0.004066 & -0.0501 & 0.48004 \tabularnewline
28 & 0.01015 & 0.1251 & 0.450292 \tabularnewline
29 & -0.007461 & -0.092 & 0.463416 \tabularnewline
30 & -0.00434 & -0.0535 & 0.478701 \tabularnewline
31 & -0.004676 & -0.0576 & 0.477052 \tabularnewline
32 & -0.004816 & -0.0594 & 0.476365 \tabularnewline
33 & -0.004453 & -0.0549 & 0.478145 \tabularnewline
34 & 0.113146 & 1.395 & 0.082531 \tabularnewline
35 & -0.015212 & -0.1875 & 0.425744 \tabularnewline
36 & -0.005206 & -0.0642 & 0.474456 \tabularnewline
37 & -0.002542 & -0.0313 & 0.48752 \tabularnewline
38 & -0.003149 & -0.0388 & 0.484543 \tabularnewline
39 & -0.003271 & -0.0403 & 0.48394 \tabularnewline
40 & -0.002685 & -0.0331 & 0.48682 \tabularnewline
41 & -0.001878 & -0.0232 & 0.490777 \tabularnewline
42 & -0.017609 & -0.2171 & 0.414211 \tabularnewline
43 & -0.003682 & -0.0454 & 0.481928 \tabularnewline
44 & -0.003549 & -0.0438 & 0.48258 \tabularnewline
45 & -0.003892 & -0.048 & 0.480896 \tabularnewline
46 & -0.003593 & -0.0443 & 0.482361 \tabularnewline
47 & -0.005913 & -0.0729 & 0.470991 \tabularnewline
48 & -0.003051 & -0.0376 & 0.485024 \tabularnewline
\hline
\end{tabular}
%Source: https://freestatistics.org/blog/index.php?pk=277970&T=2

[TABLE]
[ROW][C]Partial Autocorrelation Function[/C][/ROW]
[ROW][C]Time lag k[/C][C]PACF(k)[/C][C]T-STAT[/C][C]P-value[/C][/ROW]
[ROW][C]1[/C][C]0.103377[/C][C]1.2745[/C][C]0.102213[/C][/ROW]
[ROW][C]2[/C][C]-0.016153[/C][C]-0.1991[/C][C]0.421206[/C][/ROW]
[ROW][C]3[/C][C]-0.003211[/C][C]-0.0396[/C][C]0.484234[/C][/ROW]
[ROW][C]4[/C][C]-0.004747[/C][C]-0.0585[/C][C]0.476702[/C][/ROW]
[ROW][C]5[/C][C]-0.004702[/C][C]-0.058[/C][C]0.476925[/C][/ROW]
[ROW][C]6[/C][C]-0.00483[/C][C]-0.0596[/C][C]0.476295[/C][/ROW]
[ROW][C]7[/C][C]-0.004941[/C][C]-0.0609[/C][C]0.475753[/C][/ROW]
[ROW][C]8[/C][C]-0.005055[/C][C]-0.0623[/C][C]0.475195[/C][/ROW]
[ROW][C]9[/C][C]-0.005169[/C][C]-0.0637[/C][C]0.474633[/C][/ROW]
[ROW][C]10[/C][C]-0.005285[/C][C]-0.0652[/C][C]0.474066[/C][/ROW]
[ROW][C]11[/C][C]-0.005402[/C][C]-0.0666[/C][C]0.473493[/C][/ROW]
[ROW][C]12[/C][C]-0.00552[/C][C]-0.0681[/C][C]0.472915[/C][/ROW]
[ROW][C]13[/C][C]0.009368[/C][C]0.1155[/C][C]0.454103[/C][/ROW]
[ROW][C]14[/C][C]-0.008264[/C][C]-0.1019[/C][C]0.459491[/C][/ROW]
[ROW][C]15[/C][C]0.010283[/C][C]0.1268[/C][C]0.449641[/C][/ROW]
[ROW][C]16[/C][C]-0.008581[/C][C]-0.1058[/C][C]0.457945[/C][/ROW]
[ROW][C]17[/C][C]-0.00481[/C][C]-0.0593[/C][C]0.476394[/C][/ROW]
[ROW][C]18[/C][C]-0.005553[/C][C]-0.0685[/C][C]0.472754[/C][/ROW]
[ROW][C]19[/C][C]-0.005576[/C][C]-0.0687[/C][C]0.472643[/C][/ROW]
[ROW][C]20[/C][C]-0.005704[/C][C]-0.0703[/C][C]0.472013[/C][/ROW]
[ROW][C]21[/C][C]0.114293[/C][C]1.4091[/C][C]0.080424[/C][/ROW]
[ROW][C]22[/C][C]-0.01262[/C][C]-0.1556[/C][C]0.438282[/C][/ROW]
[ROW][C]23[/C][C]-0.003558[/C][C]-0.0439[/C][C]0.482536[/C][/ROW]
[ROW][C]24[/C][C]-0.004174[/C][C]-0.0515[/C][C]0.479512[/C][/ROW]
[ROW][C]25[/C][C]-0.004209[/C][C]-0.0519[/C][C]0.479343[/C][/ROW]
[ROW][C]26[/C][C]-0.004611[/C][C]-0.0568[/C][C]0.477371[/C][/ROW]
[ROW][C]27[/C][C]-0.004066[/C][C]-0.0501[/C][C]0.48004[/C][/ROW]
[ROW][C]28[/C][C]0.01015[/C][C]0.1251[/C][C]0.450292[/C][/ROW]
[ROW][C]29[/C][C]-0.007461[/C][C]-0.092[/C][C]0.463416[/C][/ROW]
[ROW][C]30[/C][C]-0.00434[/C][C]-0.0535[/C][C]0.478701[/C][/ROW]
[ROW][C]31[/C][C]-0.004676[/C][C]-0.0576[/C][C]0.477052[/C][/ROW]
[ROW][C]32[/C][C]-0.004816[/C][C]-0.0594[/C][C]0.476365[/C][/ROW]
[ROW][C]33[/C][C]-0.004453[/C][C]-0.0549[/C][C]0.478145[/C][/ROW]
[ROW][C]34[/C][C]0.113146[/C][C]1.395[/C][C]0.082531[/C][/ROW]
[ROW][C]35[/C][C]-0.015212[/C][C]-0.1875[/C][C]0.425744[/C][/ROW]
[ROW][C]36[/C][C]-0.005206[/C][C]-0.0642[/C][C]0.474456[/C][/ROW]
[ROW][C]37[/C][C]-0.002542[/C][C]-0.0313[/C][C]0.48752[/C][/ROW]
[ROW][C]38[/C][C]-0.003149[/C][C]-0.0388[/C][C]0.484543[/C][/ROW]
[ROW][C]39[/C][C]-0.003271[/C][C]-0.0403[/C][C]0.48394[/C][/ROW]
[ROW][C]40[/C][C]-0.002685[/C][C]-0.0331[/C][C]0.48682[/C][/ROW]
[ROW][C]41[/C][C]-0.001878[/C][C]-0.0232[/C][C]0.490777[/C][/ROW]
[ROW][C]42[/C][C]-0.017609[/C][C]-0.2171[/C][C]0.414211[/C][/ROW]
[ROW][C]43[/C][C]-0.003682[/C][C]-0.0454[/C][C]0.481928[/C][/ROW]
[ROW][C]44[/C][C]-0.003549[/C][C]-0.0438[/C][C]0.48258[/C][/ROW]
[ROW][C]45[/C][C]-0.003892[/C][C]-0.048[/C][C]0.480896[/C][/ROW]
[ROW][C]46[/C][C]-0.003593[/C][C]-0.0443[/C][C]0.482361[/C][/ROW]
[ROW][C]47[/C][C]-0.005913[/C][C]-0.0729[/C][C]0.470991[/C][/ROW]
[ROW][C]48[/C][C]-0.003051[/C][C]-0.0376[/C][C]0.485024[/C][/ROW]
[/TABLE]
Source: https://freestatistics.org/blog/index.php?pk=277970&T=2

Globally Unique Identifier (entire table): ba.freestatistics.org/blog/index.php?pk=277970&T=2

As an alternative you can also use a QR Code:  

The GUIDs for individual cells are displayed in the table below:

Partial Autocorrelation Function
Time lag kPACF(k)T-STATP-value
10.1033771.27450.102213
2-0.016153-0.19910.421206
3-0.003211-0.03960.484234
4-0.004747-0.05850.476702
5-0.004702-0.0580.476925
6-0.00483-0.05960.476295
7-0.004941-0.06090.475753
8-0.005055-0.06230.475195
9-0.005169-0.06370.474633
10-0.005285-0.06520.474066
11-0.005402-0.06660.473493
12-0.00552-0.06810.472915
130.0093680.11550.454103
14-0.008264-0.10190.459491
150.0102830.12680.449641
16-0.008581-0.10580.457945
17-0.00481-0.05930.476394
18-0.005553-0.06850.472754
19-0.005576-0.06870.472643
20-0.005704-0.07030.472013
210.1142931.40910.080424
22-0.01262-0.15560.438282
23-0.003558-0.04390.482536
24-0.004174-0.05150.479512
25-0.004209-0.05190.479343
26-0.004611-0.05680.477371
27-0.004066-0.05010.48004
280.010150.12510.450292
29-0.007461-0.0920.463416
30-0.00434-0.05350.478701
31-0.004676-0.05760.477052
32-0.004816-0.05940.476365
33-0.004453-0.05490.478145
340.1131461.3950.082531
35-0.015212-0.18750.425744
36-0.005206-0.06420.474456
37-0.002542-0.03130.48752
38-0.003149-0.03880.484543
39-0.003271-0.04030.48394
40-0.002685-0.03310.48682
41-0.001878-0.02320.490777
42-0.017609-0.21710.414211
43-0.003682-0.04540.481928
44-0.003549-0.04380.48258
45-0.003892-0.0480.480896
46-0.003593-0.04430.482361
47-0.005913-0.07290.470991
48-0.003051-0.03760.485024


Parameters (Session):
par1 = 48 ; par2 = 1 ; par3 = 0 ; par4 = 0 ; par5 = 12 ; par6 = White Noise ; par7 = 0.95 ;
Parameters (R input):
par1 = 48 ; par2 = 1 ; par3 = 1 ; par4 = 0 ; par5 = 12 ; par6 = White Noise ; par7 = 0.95 ; par8 = ;
R code (references can be found in the software module):
par8 <- ''
par7 <- '0.95'
par6 <- 'White Noise'
par5 <- '12'
par4 <- '0'
par3 <- '0'
par2 <- '1'
par1 <- '48'
if (par1 == 'Default') {
par1 = 10*log10(length(x))
} else {
par1 <- as.numeric(par1)
}
par2 <- as.numeric(par2)
par3 <- as.numeric(par3)
par4 <- as.numeric(par4)
par5 <- as.numeric(par5)
if (par6 == 'White Noise') par6 <- 'white' else par6 <- 'ma'
par7 <- as.numeric(par7)
if (par8 != '') par8 <- as.numeric(par8)
ox <- x
if (par8 == '') {
if (par2 == 0) {
x <- log(x)
} else {
x <- (x ^ par2 - 1) / par2
}
} else {
x <- log(x,base=par8)
}
if (par3 > 0) x <- diff(x,lag=1,difference=par3)
if (par4 > 0) x <- diff(x,lag=par5,difference=par4)
bitmap(file='picts.png')
op <- par(mfrow=c(2,1))
plot(ox,type='l',main='Original Time Series',xlab='time',ylab='value')
if (par8=='') {
mytitle <- paste('Working Time Series (lambda=',par2,', d=',par3,', D=',par4,')',sep='')
mysub <- paste('(lambda=',par2,', d=',par3,', D=',par4,', CI=', par7, ', CI type=',par6,')',sep='')
} else {
mytitle <- paste('Working Time Series (base=',par8,', d=',par3,', D=',par4,')',sep='')
mysub <- paste('(base=',par8,', d=',par3,', D=',par4,', CI=', par7, ', CI type=',par6,')',sep='')
}
plot(x,type='l', main=mytitle,xlab='time',ylab='value')
par(op)
dev.off()
bitmap(file='pic1.png')
racf <- acf(x, par1, main='Autocorrelation', xlab='time lag', ylab='ACF', ci.type=par6, ci=par7, sub=mysub)
dev.off()
bitmap(file='pic2.png')
rpacf <- pacf(x,par1,main='Partial Autocorrelation',xlab='lags',ylab='PACF',sub=mysub)
dev.off()
(myacf <- c(racf$acf))
(mypacf <- c(rpacf$acf))
lengthx <- length(x)
sqrtn <- sqrt(lengthx)
load(file='createtable')
a<-table.start()
a<-table.row.start(a)
a<-table.element(a,'Autocorrelation Function',4,TRUE)
a<-table.row.end(a)
a<-table.row.start(a)
a<-table.element(a,'Time lag k',header=TRUE)
a<-table.element(a,hyperlink('basics.htm','ACF(k)','click here for more information about the Autocorrelation Function'),header=TRUE)
a<-table.element(a,'T-STAT',header=TRUE)
a<-table.element(a,'P-value',header=TRUE)
a<-table.row.end(a)
for (i in 2:(par1+1)) {
a<-table.row.start(a)
a<-table.element(a,i-1,header=TRUE)
a<-table.element(a,round(myacf[i],6))
mytstat <- myacf[i]*sqrtn
a<-table.element(a,round(mytstat,4))
a<-table.element(a,round(1-pt(abs(mytstat),lengthx),6))
a<-table.row.end(a)
}
a<-table.end(a)
table.save(a,file='mytable.tab')
a<-table.start()
a<-table.row.start(a)
a<-table.element(a,'Partial Autocorrelation Function',4,TRUE)
a<-table.row.end(a)
a<-table.row.start(a)
a<-table.element(a,'Time lag k',header=TRUE)
a<-table.element(a,hyperlink('basics.htm','PACF(k)','click here for more information about the Partial Autocorrelation Function'),header=TRUE)
a<-table.element(a,'T-STAT',header=TRUE)
a<-table.element(a,'P-value',header=TRUE)
a<-table.row.end(a)
for (i in 1:par1) {
a<-table.row.start(a)
a<-table.element(a,i,header=TRUE)
a<-table.element(a,round(mypacf[i],6))
mytstat <- mypacf[i]*sqrtn
a<-table.element(a,round(mytstat,4))
a<-table.element(a,round(1-pt(abs(mytstat),lengthx),6))
a<-table.row.end(a)
}
a<-table.end(a)
table.save(a,file='mytable1.tab')