Free Statistics

of Irreproducible Research!

Author's title

Author*Unverified author*
R Software Modulerwasp_autocorrelation.wasp
Title produced by software(Partial) Autocorrelation Function
Date of computationThu, 05 Mar 2015 18:00:00 +0000
Cite this page as followsStatistical Computations at FreeStatistics.org, Office for Research Development and Education, URL https://freestatistics.org/blog/index.php?v=date/2015/Mar/05/t1425578550fk59f6d3fn5dni1.htm/, Retrieved Tue, 21 May 2024 07:26:35 +0000
Statistical Computations at FreeStatistics.org, Office for Research Development and Education, URL https://freestatistics.org/blog/index.php?pk=277980, Retrieved Tue, 21 May 2024 07:26:35 +0000
QR Codes:

Original text written by user:
IsPrivate?No (this computation is public)
User-defined keywords
Estimated Impact57
Family? (F = Feedback message, R = changed R code, M = changed R Module, P = changed Parameters, D = changed Data)
-       [(Partial) Autocorrelation Function] [] [2015-03-05 18:00:00] [57f5dbee1b697c074ab0c7d81efd3c32] [Current]
Feedback Forum

Post a new message
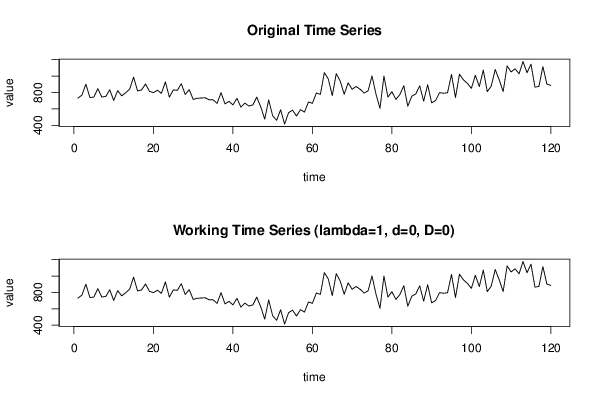
Dataseries X:
732
768
902
739
744
848
745
752
833
703
824
759
797
840
988
819
831
904
814
798
828
789
930
744
832
826
907
776
835
715
729
733
736
712
711
667
799
661
692
649
729
622
671
635
648
744
624
476
710
515
461
590
415
554
585
513
591
561
684
668
795
776
1043
964
762
1030
939
779
918
839
874
840
794
820
1003
780
607
1001
743
810
716
775
883
633
755
782
882
694
896
674
702
799
791
797
1021
738
1023
955
912
850
1011
872
1074
811
878
1081
956
812
1125
1051
1090
1028
1178
1041
1146
866
875
1116
903
887


Summary of computational transaction
Raw Inputview raw input (R code)
Raw Outputview raw output of R engine
Computing time2 seconds
R Server'Gertrude Mary Cox' @ cox.wessa.net

\begin{tabular}{lllllllll}
\hline
Summary of computational transaction \tabularnewline
Raw Input & view raw input (R code)  \tabularnewline
Raw Output & view raw output of R engine  \tabularnewline
Computing time & 2 seconds \tabularnewline
R Server & 'Gertrude Mary Cox' @ cox.wessa.net \tabularnewline
\hline
\end{tabular}
%Source: https://freestatistics.org/blog/index.php?pk=277980&T=0

[TABLE]
[ROW][C]Summary of computational transaction[/C][/ROW]
[ROW][C]Raw Input[/C][C]view raw input (R code) [/C][/ROW]
[ROW][C]Raw Output[/C][C]view raw output of R engine [/C][/ROW]
[ROW][C]Computing time[/C][C]2 seconds[/C][/ROW]
[ROW][C]R Server[/C][C]'Gertrude Mary Cox' @ cox.wessa.net[/C][/ROW]
[/TABLE]
Source: https://freestatistics.org/blog/index.php?pk=277980&T=0

Globally Unique Identifier (entire table): ba.freestatistics.org/blog/index.php?pk=277980&T=0

As an alternative you can also use a QR Code:  

The GUIDs for individual cells are displayed in the table below:

Summary of computational transaction
Raw Inputview raw input (R code)
Raw Outputview raw output of R engine
Computing time2 seconds
R Server'Gertrude Mary Cox' @ cox.wessa.net


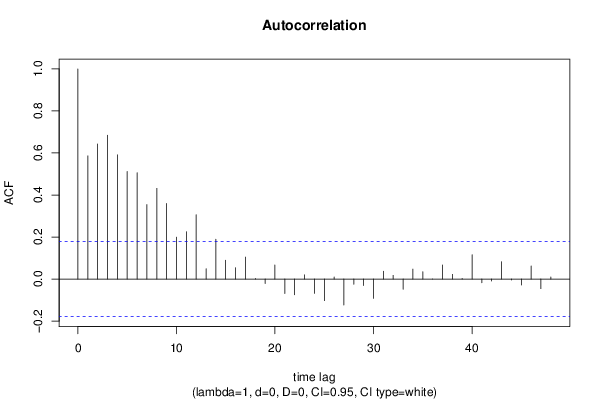
Autocorrelation Function
Time lag kACF(k)T-STATP-value
10.5862176.42170
20.6432497.04640
30.6844077.49730
40.5912626.47690
50.5120785.60950
60.5056535.53920
70.3543683.88198.5e-05
80.4315934.72793e-06
90.3600233.94396.8e-05
100.1994422.18480.015424
110.2252132.46710.007517
120.3058013.34990.000541
130.0489760.53650.296302
140.1891152.07170.02022
150.0898360.98410.163523
160.0536370.58760.278963
170.1043221.14280.127701
180.002750.03010.488008
19-0.020837-0.22830.409916
200.0670750.73480.231957
21-0.069106-0.7570.22526
22-0.074962-0.82120.20659
230.0200150.21930.413413
24-0.068289-0.74810.227941
25-0.102771-1.12580.131249
260.0098590.1080.457087
27-0.123671-1.35470.089022
28-0.025086-0.27480.391968
29-0.031051-0.34010.36717
30-0.092024-1.00810.157724
310.0372470.4080.341992
320.0174610.19130.424316
33-0.048218-0.52820.299166
340.0474170.51940.30221
350.0350980.38450.350651
360.0004130.00450.498198
370.0670710.73470.231971
380.0224260.24570.403182
390.0028160.03080.487723
400.1156871.26730.103753
41-0.017551-0.19230.423933
42-0.009367-0.10260.459223
430.0823390.9020.184437
44-0.004711-0.05160.479466
45-0.028207-0.3090.378932
460.0624190.68380.247719
47-0.045536-0.49880.309408
480.0099340.10880.456763

\begin{tabular}{lllllllll}
\hline
Autocorrelation Function \tabularnewline
Time lag k & ACF(k) & T-STAT & P-value \tabularnewline
1 & 0.586217 & 6.4217 & 0 \tabularnewline
2 & 0.643249 & 7.0464 & 0 \tabularnewline
3 & 0.684407 & 7.4973 & 0 \tabularnewline
4 & 0.591262 & 6.4769 & 0 \tabularnewline
5 & 0.512078 & 5.6095 & 0 \tabularnewline
6 & 0.505653 & 5.5392 & 0 \tabularnewline
7 & 0.354368 & 3.8819 & 8.5e-05 \tabularnewline
8 & 0.431593 & 4.7279 & 3e-06 \tabularnewline
9 & 0.360023 & 3.9439 & 6.8e-05 \tabularnewline
10 & 0.199442 & 2.1848 & 0.015424 \tabularnewline
11 & 0.225213 & 2.4671 & 0.007517 \tabularnewline
12 & 0.305801 & 3.3499 & 0.000541 \tabularnewline
13 & 0.048976 & 0.5365 & 0.296302 \tabularnewline
14 & 0.189115 & 2.0717 & 0.02022 \tabularnewline
15 & 0.089836 & 0.9841 & 0.163523 \tabularnewline
16 & 0.053637 & 0.5876 & 0.278963 \tabularnewline
17 & 0.104322 & 1.1428 & 0.127701 \tabularnewline
18 & 0.00275 & 0.0301 & 0.488008 \tabularnewline
19 & -0.020837 & -0.2283 & 0.409916 \tabularnewline
20 & 0.067075 & 0.7348 & 0.231957 \tabularnewline
21 & -0.069106 & -0.757 & 0.22526 \tabularnewline
22 & -0.074962 & -0.8212 & 0.20659 \tabularnewline
23 & 0.020015 & 0.2193 & 0.413413 \tabularnewline
24 & -0.068289 & -0.7481 & 0.227941 \tabularnewline
25 & -0.102771 & -1.1258 & 0.131249 \tabularnewline
26 & 0.009859 & 0.108 & 0.457087 \tabularnewline
27 & -0.123671 & -1.3547 & 0.089022 \tabularnewline
28 & -0.025086 & -0.2748 & 0.391968 \tabularnewline
29 & -0.031051 & -0.3401 & 0.36717 \tabularnewline
30 & -0.092024 & -1.0081 & 0.157724 \tabularnewline
31 & 0.037247 & 0.408 & 0.341992 \tabularnewline
32 & 0.017461 & 0.1913 & 0.424316 \tabularnewline
33 & -0.048218 & -0.5282 & 0.299166 \tabularnewline
34 & 0.047417 & 0.5194 & 0.30221 \tabularnewline
35 & 0.035098 & 0.3845 & 0.350651 \tabularnewline
36 & 0.000413 & 0.0045 & 0.498198 \tabularnewline
37 & 0.067071 & 0.7347 & 0.231971 \tabularnewline
38 & 0.022426 & 0.2457 & 0.403182 \tabularnewline
39 & 0.002816 & 0.0308 & 0.487723 \tabularnewline
40 & 0.115687 & 1.2673 & 0.103753 \tabularnewline
41 & -0.017551 & -0.1923 & 0.423933 \tabularnewline
42 & -0.009367 & -0.1026 & 0.459223 \tabularnewline
43 & 0.082339 & 0.902 & 0.184437 \tabularnewline
44 & -0.004711 & -0.0516 & 0.479466 \tabularnewline
45 & -0.028207 & -0.309 & 0.378932 \tabularnewline
46 & 0.062419 & 0.6838 & 0.247719 \tabularnewline
47 & -0.045536 & -0.4988 & 0.309408 \tabularnewline
48 & 0.009934 & 0.1088 & 0.456763 \tabularnewline
\hline
\end{tabular}
%Source: https://freestatistics.org/blog/index.php?pk=277980&T=1

[TABLE]
[ROW][C]Autocorrelation Function[/C][/ROW]
[ROW][C]Time lag k[/C][C]ACF(k)[/C][C]T-STAT[/C][C]P-value[/C][/ROW]
[ROW][C]1[/C][C]0.586217[/C][C]6.4217[/C][C]0[/C][/ROW]
[ROW][C]2[/C][C]0.643249[/C][C]7.0464[/C][C]0[/C][/ROW]
[ROW][C]3[/C][C]0.684407[/C][C]7.4973[/C][C]0[/C][/ROW]
[ROW][C]4[/C][C]0.591262[/C][C]6.4769[/C][C]0[/C][/ROW]
[ROW][C]5[/C][C]0.512078[/C][C]5.6095[/C][C]0[/C][/ROW]
[ROW][C]6[/C][C]0.505653[/C][C]5.5392[/C][C]0[/C][/ROW]
[ROW][C]7[/C][C]0.354368[/C][C]3.8819[/C][C]8.5e-05[/C][/ROW]
[ROW][C]8[/C][C]0.431593[/C][C]4.7279[/C][C]3e-06[/C][/ROW]
[ROW][C]9[/C][C]0.360023[/C][C]3.9439[/C][C]6.8e-05[/C][/ROW]
[ROW][C]10[/C][C]0.199442[/C][C]2.1848[/C][C]0.015424[/C][/ROW]
[ROW][C]11[/C][C]0.225213[/C][C]2.4671[/C][C]0.007517[/C][/ROW]
[ROW][C]12[/C][C]0.305801[/C][C]3.3499[/C][C]0.000541[/C][/ROW]
[ROW][C]13[/C][C]0.048976[/C][C]0.5365[/C][C]0.296302[/C][/ROW]
[ROW][C]14[/C][C]0.189115[/C][C]2.0717[/C][C]0.02022[/C][/ROW]
[ROW][C]15[/C][C]0.089836[/C][C]0.9841[/C][C]0.163523[/C][/ROW]
[ROW][C]16[/C][C]0.053637[/C][C]0.5876[/C][C]0.278963[/C][/ROW]
[ROW][C]17[/C][C]0.104322[/C][C]1.1428[/C][C]0.127701[/C][/ROW]
[ROW][C]18[/C][C]0.00275[/C][C]0.0301[/C][C]0.488008[/C][/ROW]
[ROW][C]19[/C][C]-0.020837[/C][C]-0.2283[/C][C]0.409916[/C][/ROW]
[ROW][C]20[/C][C]0.067075[/C][C]0.7348[/C][C]0.231957[/C][/ROW]
[ROW][C]21[/C][C]-0.069106[/C][C]-0.757[/C][C]0.22526[/C][/ROW]
[ROW][C]22[/C][C]-0.074962[/C][C]-0.8212[/C][C]0.20659[/C][/ROW]
[ROW][C]23[/C][C]0.020015[/C][C]0.2193[/C][C]0.413413[/C][/ROW]
[ROW][C]24[/C][C]-0.068289[/C][C]-0.7481[/C][C]0.227941[/C][/ROW]
[ROW][C]25[/C][C]-0.102771[/C][C]-1.1258[/C][C]0.131249[/C][/ROW]
[ROW][C]26[/C][C]0.009859[/C][C]0.108[/C][C]0.457087[/C][/ROW]
[ROW][C]27[/C][C]-0.123671[/C][C]-1.3547[/C][C]0.089022[/C][/ROW]
[ROW][C]28[/C][C]-0.025086[/C][C]-0.2748[/C][C]0.391968[/C][/ROW]
[ROW][C]29[/C][C]-0.031051[/C][C]-0.3401[/C][C]0.36717[/C][/ROW]
[ROW][C]30[/C][C]-0.092024[/C][C]-1.0081[/C][C]0.157724[/C][/ROW]
[ROW][C]31[/C][C]0.037247[/C][C]0.408[/C][C]0.341992[/C][/ROW]
[ROW][C]32[/C][C]0.017461[/C][C]0.1913[/C][C]0.424316[/C][/ROW]
[ROW][C]33[/C][C]-0.048218[/C][C]-0.5282[/C][C]0.299166[/C][/ROW]
[ROW][C]34[/C][C]0.047417[/C][C]0.5194[/C][C]0.30221[/C][/ROW]
[ROW][C]35[/C][C]0.035098[/C][C]0.3845[/C][C]0.350651[/C][/ROW]
[ROW][C]36[/C][C]0.000413[/C][C]0.0045[/C][C]0.498198[/C][/ROW]
[ROW][C]37[/C][C]0.067071[/C][C]0.7347[/C][C]0.231971[/C][/ROW]
[ROW][C]38[/C][C]0.022426[/C][C]0.2457[/C][C]0.403182[/C][/ROW]
[ROW][C]39[/C][C]0.002816[/C][C]0.0308[/C][C]0.487723[/C][/ROW]
[ROW][C]40[/C][C]0.115687[/C][C]1.2673[/C][C]0.103753[/C][/ROW]
[ROW][C]41[/C][C]-0.017551[/C][C]-0.1923[/C][C]0.423933[/C][/ROW]
[ROW][C]42[/C][C]-0.009367[/C][C]-0.1026[/C][C]0.459223[/C][/ROW]
[ROW][C]43[/C][C]0.082339[/C][C]0.902[/C][C]0.184437[/C][/ROW]
[ROW][C]44[/C][C]-0.004711[/C][C]-0.0516[/C][C]0.479466[/C][/ROW]
[ROW][C]45[/C][C]-0.028207[/C][C]-0.309[/C][C]0.378932[/C][/ROW]
[ROW][C]46[/C][C]0.062419[/C][C]0.6838[/C][C]0.247719[/C][/ROW]
[ROW][C]47[/C][C]-0.045536[/C][C]-0.4988[/C][C]0.309408[/C][/ROW]
[ROW][C]48[/C][C]0.009934[/C][C]0.1088[/C][C]0.456763[/C][/ROW]
[/TABLE]
Source: https://freestatistics.org/blog/index.php?pk=277980&T=1

Globally Unique Identifier (entire table): ba.freestatistics.org/blog/index.php?pk=277980&T=1

As an alternative you can also use a QR Code:  

The GUIDs for individual cells are displayed in the table below:

Autocorrelation Function
Time lag kACF(k)T-STATP-value
10.5862176.42170
20.6432497.04640
30.6844077.49730
40.5912626.47690
50.5120785.60950
60.5056535.53920
70.3543683.88198.5e-05
80.4315934.72793e-06
90.3600233.94396.8e-05
100.1994422.18480.015424
110.2252132.46710.007517
120.3058013.34990.000541
130.0489760.53650.296302
140.1891152.07170.02022
150.0898360.98410.163523
160.0536370.58760.278963
170.1043221.14280.127701
180.002750.03010.488008
19-0.020837-0.22830.409916
200.0670750.73480.231957
21-0.069106-0.7570.22526
22-0.074962-0.82120.20659
230.0200150.21930.413413
24-0.068289-0.74810.227941
25-0.102771-1.12580.131249
260.0098590.1080.457087
27-0.123671-1.35470.089022
28-0.025086-0.27480.391968
29-0.031051-0.34010.36717
30-0.092024-1.00810.157724
310.0372470.4080.341992
320.0174610.19130.424316
33-0.048218-0.52820.299166
340.0474170.51940.30221
350.0350980.38450.350651
360.0004130.00450.498198
370.0670710.73470.231971
380.0224260.24570.403182
390.0028160.03080.487723
400.1156871.26730.103753
41-0.017551-0.19230.423933
42-0.009367-0.10260.459223
430.0823390.9020.184437
44-0.004711-0.05160.479466
45-0.028207-0.3090.378932
460.0624190.68380.247719
47-0.045536-0.49880.309408
480.0099340.10880.456763


Partial Autocorrelation Function
Time lag kPACF(k)T-STATP-value
10.5862176.42170
20.4564615.00031e-06
30.4077464.46669e-06
40.1188711.30220.097677
5-0.131982-1.44580.075421
6-0.111114-1.21720.11296
7-0.29966-3.28260.000674
80.1043341.14290.127673
90.1495931.63870.051946
10-0.153236-1.67860.047915
11-0.134318-1.47140.071904
120.2438612.67140.004302
13-0.193661-2.12150.01797
140.1362961.49310.069024
15-0.054217-0.59390.276842
16-0.061396-0.67260.251262
170.0707490.7750.219926
18-0.10026-1.09830.137138
190.0540560.59220.277432
20-0.007251-0.07940.468411
21-0.128144-1.40370.081489
22-0.00125-0.01370.494547
230.1462581.60220.055873
24-0.011874-0.13010.448362
25-0.004603-0.05040.479934
260.0032190.03530.485964
27-0.063898-0.70.242651
280.07160.78430.217192
29-0.003065-0.03360.486636
300.0815720.89360.186669
310.1287511.41040.080504
32-0.064655-0.70830.240078
33-0.006298-0.0690.472556
34-0.061544-0.67420.250747
35-0.110887-1.21470.113432
360.0646910.70870.239956
370.0577880.6330.263959
38-0.056118-0.61470.269946
390.0151810.16630.434102
400.0100990.11060.456046
41-0.041408-0.45360.325468
42-0.070876-0.77640.219518
43-0.022407-0.24550.403261
440.1363521.49370.068944
45-0.112771-1.23530.109558
460.1111541.21760.112876
47-0.021276-0.23310.408054
48-0.093896-1.02860.152872

\begin{tabular}{lllllllll}
\hline
Partial Autocorrelation Function \tabularnewline
Time lag k & PACF(k) & T-STAT & P-value \tabularnewline
1 & 0.586217 & 6.4217 & 0 \tabularnewline
2 & 0.456461 & 5.0003 & 1e-06 \tabularnewline
3 & 0.407746 & 4.4666 & 9e-06 \tabularnewline
4 & 0.118871 & 1.3022 & 0.097677 \tabularnewline
5 & -0.131982 & -1.4458 & 0.075421 \tabularnewline
6 & -0.111114 & -1.2172 & 0.11296 \tabularnewline
7 & -0.29966 & -3.2826 & 0.000674 \tabularnewline
8 & 0.104334 & 1.1429 & 0.127673 \tabularnewline
9 & 0.149593 & 1.6387 & 0.051946 \tabularnewline
10 & -0.153236 & -1.6786 & 0.047915 \tabularnewline
11 & -0.134318 & -1.4714 & 0.071904 \tabularnewline
12 & 0.243861 & 2.6714 & 0.004302 \tabularnewline
13 & -0.193661 & -2.1215 & 0.01797 \tabularnewline
14 & 0.136296 & 1.4931 & 0.069024 \tabularnewline
15 & -0.054217 & -0.5939 & 0.276842 \tabularnewline
16 & -0.061396 & -0.6726 & 0.251262 \tabularnewline
17 & 0.070749 & 0.775 & 0.219926 \tabularnewline
18 & -0.10026 & -1.0983 & 0.137138 \tabularnewline
19 & 0.054056 & 0.5922 & 0.277432 \tabularnewline
20 & -0.007251 & -0.0794 & 0.468411 \tabularnewline
21 & -0.128144 & -1.4037 & 0.081489 \tabularnewline
22 & -0.00125 & -0.0137 & 0.494547 \tabularnewline
23 & 0.146258 & 1.6022 & 0.055873 \tabularnewline
24 & -0.011874 & -0.1301 & 0.448362 \tabularnewline
25 & -0.004603 & -0.0504 & 0.479934 \tabularnewline
26 & 0.003219 & 0.0353 & 0.485964 \tabularnewline
27 & -0.063898 & -0.7 & 0.242651 \tabularnewline
28 & 0.0716 & 0.7843 & 0.217192 \tabularnewline
29 & -0.003065 & -0.0336 & 0.486636 \tabularnewline
30 & 0.081572 & 0.8936 & 0.186669 \tabularnewline
31 & 0.128751 & 1.4104 & 0.080504 \tabularnewline
32 & -0.064655 & -0.7083 & 0.240078 \tabularnewline
33 & -0.006298 & -0.069 & 0.472556 \tabularnewline
34 & -0.061544 & -0.6742 & 0.250747 \tabularnewline
35 & -0.110887 & -1.2147 & 0.113432 \tabularnewline
36 & 0.064691 & 0.7087 & 0.239956 \tabularnewline
37 & 0.057788 & 0.633 & 0.263959 \tabularnewline
38 & -0.056118 & -0.6147 & 0.269946 \tabularnewline
39 & 0.015181 & 0.1663 & 0.434102 \tabularnewline
40 & 0.010099 & 0.1106 & 0.456046 \tabularnewline
41 & -0.041408 & -0.4536 & 0.325468 \tabularnewline
42 & -0.070876 & -0.7764 & 0.219518 \tabularnewline
43 & -0.022407 & -0.2455 & 0.403261 \tabularnewline
44 & 0.136352 & 1.4937 & 0.068944 \tabularnewline
45 & -0.112771 & -1.2353 & 0.109558 \tabularnewline
46 & 0.111154 & 1.2176 & 0.112876 \tabularnewline
47 & -0.021276 & -0.2331 & 0.408054 \tabularnewline
48 & -0.093896 & -1.0286 & 0.152872 \tabularnewline
\hline
\end{tabular}
%Source: https://freestatistics.org/blog/index.php?pk=277980&T=2

[TABLE]
[ROW][C]Partial Autocorrelation Function[/C][/ROW]
[ROW][C]Time lag k[/C][C]PACF(k)[/C][C]T-STAT[/C][C]P-value[/C][/ROW]
[ROW][C]1[/C][C]0.586217[/C][C]6.4217[/C][C]0[/C][/ROW]
[ROW][C]2[/C][C]0.456461[/C][C]5.0003[/C][C]1e-06[/C][/ROW]
[ROW][C]3[/C][C]0.407746[/C][C]4.4666[/C][C]9e-06[/C][/ROW]
[ROW][C]4[/C][C]0.118871[/C][C]1.3022[/C][C]0.097677[/C][/ROW]
[ROW][C]5[/C][C]-0.131982[/C][C]-1.4458[/C][C]0.075421[/C][/ROW]
[ROW][C]6[/C][C]-0.111114[/C][C]-1.2172[/C][C]0.11296[/C][/ROW]
[ROW][C]7[/C][C]-0.29966[/C][C]-3.2826[/C][C]0.000674[/C][/ROW]
[ROW][C]8[/C][C]0.104334[/C][C]1.1429[/C][C]0.127673[/C][/ROW]
[ROW][C]9[/C][C]0.149593[/C][C]1.6387[/C][C]0.051946[/C][/ROW]
[ROW][C]10[/C][C]-0.153236[/C][C]-1.6786[/C][C]0.047915[/C][/ROW]
[ROW][C]11[/C][C]-0.134318[/C][C]-1.4714[/C][C]0.071904[/C][/ROW]
[ROW][C]12[/C][C]0.243861[/C][C]2.6714[/C][C]0.004302[/C][/ROW]
[ROW][C]13[/C][C]-0.193661[/C][C]-2.1215[/C][C]0.01797[/C][/ROW]
[ROW][C]14[/C][C]0.136296[/C][C]1.4931[/C][C]0.069024[/C][/ROW]
[ROW][C]15[/C][C]-0.054217[/C][C]-0.5939[/C][C]0.276842[/C][/ROW]
[ROW][C]16[/C][C]-0.061396[/C][C]-0.6726[/C][C]0.251262[/C][/ROW]
[ROW][C]17[/C][C]0.070749[/C][C]0.775[/C][C]0.219926[/C][/ROW]
[ROW][C]18[/C][C]-0.10026[/C][C]-1.0983[/C][C]0.137138[/C][/ROW]
[ROW][C]19[/C][C]0.054056[/C][C]0.5922[/C][C]0.277432[/C][/ROW]
[ROW][C]20[/C][C]-0.007251[/C][C]-0.0794[/C][C]0.468411[/C][/ROW]
[ROW][C]21[/C][C]-0.128144[/C][C]-1.4037[/C][C]0.081489[/C][/ROW]
[ROW][C]22[/C][C]-0.00125[/C][C]-0.0137[/C][C]0.494547[/C][/ROW]
[ROW][C]23[/C][C]0.146258[/C][C]1.6022[/C][C]0.055873[/C][/ROW]
[ROW][C]24[/C][C]-0.011874[/C][C]-0.1301[/C][C]0.448362[/C][/ROW]
[ROW][C]25[/C][C]-0.004603[/C][C]-0.0504[/C][C]0.479934[/C][/ROW]
[ROW][C]26[/C][C]0.003219[/C][C]0.0353[/C][C]0.485964[/C][/ROW]
[ROW][C]27[/C][C]-0.063898[/C][C]-0.7[/C][C]0.242651[/C][/ROW]
[ROW][C]28[/C][C]0.0716[/C][C]0.7843[/C][C]0.217192[/C][/ROW]
[ROW][C]29[/C][C]-0.003065[/C][C]-0.0336[/C][C]0.486636[/C][/ROW]
[ROW][C]30[/C][C]0.081572[/C][C]0.8936[/C][C]0.186669[/C][/ROW]
[ROW][C]31[/C][C]0.128751[/C][C]1.4104[/C][C]0.080504[/C][/ROW]
[ROW][C]32[/C][C]-0.064655[/C][C]-0.7083[/C][C]0.240078[/C][/ROW]
[ROW][C]33[/C][C]-0.006298[/C][C]-0.069[/C][C]0.472556[/C][/ROW]
[ROW][C]34[/C][C]-0.061544[/C][C]-0.6742[/C][C]0.250747[/C][/ROW]
[ROW][C]35[/C][C]-0.110887[/C][C]-1.2147[/C][C]0.113432[/C][/ROW]
[ROW][C]36[/C][C]0.064691[/C][C]0.7087[/C][C]0.239956[/C][/ROW]
[ROW][C]37[/C][C]0.057788[/C][C]0.633[/C][C]0.263959[/C][/ROW]
[ROW][C]38[/C][C]-0.056118[/C][C]-0.6147[/C][C]0.269946[/C][/ROW]
[ROW][C]39[/C][C]0.015181[/C][C]0.1663[/C][C]0.434102[/C][/ROW]
[ROW][C]40[/C][C]0.010099[/C][C]0.1106[/C][C]0.456046[/C][/ROW]
[ROW][C]41[/C][C]-0.041408[/C][C]-0.4536[/C][C]0.325468[/C][/ROW]
[ROW][C]42[/C][C]-0.070876[/C][C]-0.7764[/C][C]0.219518[/C][/ROW]
[ROW][C]43[/C][C]-0.022407[/C][C]-0.2455[/C][C]0.403261[/C][/ROW]
[ROW][C]44[/C][C]0.136352[/C][C]1.4937[/C][C]0.068944[/C][/ROW]
[ROW][C]45[/C][C]-0.112771[/C][C]-1.2353[/C][C]0.109558[/C][/ROW]
[ROW][C]46[/C][C]0.111154[/C][C]1.2176[/C][C]0.112876[/C][/ROW]
[ROW][C]47[/C][C]-0.021276[/C][C]-0.2331[/C][C]0.408054[/C][/ROW]
[ROW][C]48[/C][C]-0.093896[/C][C]-1.0286[/C][C]0.152872[/C][/ROW]
[/TABLE]
Source: https://freestatistics.org/blog/index.php?pk=277980&T=2

Globally Unique Identifier (entire table): ba.freestatistics.org/blog/index.php?pk=277980&T=2

As an alternative you can also use a QR Code:  

The GUIDs for individual cells are displayed in the table below:

Partial Autocorrelation Function
Time lag kPACF(k)T-STATP-value
10.5862176.42170
20.4564615.00031e-06
30.4077464.46669e-06
40.1188711.30220.097677
5-0.131982-1.44580.075421
6-0.111114-1.21720.11296
7-0.29966-3.28260.000674
80.1043341.14290.127673
90.1495931.63870.051946
10-0.153236-1.67860.047915
11-0.134318-1.47140.071904
120.2438612.67140.004302
13-0.193661-2.12150.01797
140.1362961.49310.069024
15-0.054217-0.59390.276842
16-0.061396-0.67260.251262
170.0707490.7750.219926
18-0.10026-1.09830.137138
190.0540560.59220.277432
20-0.007251-0.07940.468411
21-0.128144-1.40370.081489
22-0.00125-0.01370.494547
230.1462581.60220.055873
24-0.011874-0.13010.448362
25-0.004603-0.05040.479934
260.0032190.03530.485964
27-0.063898-0.70.242651
280.07160.78430.217192
29-0.003065-0.03360.486636
300.0815720.89360.186669
310.1287511.41040.080504
32-0.064655-0.70830.240078
33-0.006298-0.0690.472556
34-0.061544-0.67420.250747
35-0.110887-1.21470.113432
360.0646910.70870.239956
370.0577880.6330.263959
38-0.056118-0.61470.269946
390.0151810.16630.434102
400.0100990.11060.456046
41-0.041408-0.45360.325468
42-0.070876-0.77640.219518
43-0.022407-0.24550.403261
440.1363521.49370.068944
45-0.112771-1.23530.109558
460.1111541.21760.112876
47-0.021276-0.23310.408054
48-0.093896-1.02860.152872


Parameters (Session):
par1 = 48 ; par2 = 1 ; par3 = 0 ; par4 = 0 ; par5 = 12 ; par6 = White Noise ; par7 = 0.95 ;
Parameters (R input):
par1 = 48 ; par2 = 1 ; par3 = 0 ; par4 = 0 ; par5 = 12 ; par6 = White Noise ; par7 = 0.95 ; par8 = ;
R code (references can be found in the software module):
if (par1 == 'Default') {
par1 = 10*log10(length(x))
} else {
par1 <- as.numeric(par1)
}
par2 <- as.numeric(par2)
par3 <- as.numeric(par3)
par4 <- as.numeric(par4)
par5 <- as.numeric(par5)
if (par6 == 'White Noise') par6 <- 'white' else par6 <- 'ma'
par7 <- as.numeric(par7)
if (par8 != '') par8 <- as.numeric(par8)
ox <- x
if (par8 == '') {
if (par2 == 0) {
x <- log(x)
} else {
x <- (x ^ par2 - 1) / par2
}
} else {
x <- log(x,base=par8)
}
if (par3 > 0) x <- diff(x,lag=1,difference=par3)
if (par4 > 0) x <- diff(x,lag=par5,difference=par4)
bitmap(file='picts.png')
op <- par(mfrow=c(2,1))
plot(ox,type='l',main='Original Time Series',xlab='time',ylab='value')
if (par8=='') {
mytitle <- paste('Working Time Series (lambda=',par2,', d=',par3,', D=',par4,')',sep='')
mysub <- paste('(lambda=',par2,', d=',par3,', D=',par4,', CI=', par7, ', CI type=',par6,')',sep='')
} else {
mytitle <- paste('Working Time Series (base=',par8,', d=',par3,', D=',par4,')',sep='')
mysub <- paste('(base=',par8,', d=',par3,', D=',par4,', CI=', par7, ', CI type=',par6,')',sep='')
}
plot(x,type='l', main=mytitle,xlab='time',ylab='value')
par(op)
dev.off()
bitmap(file='pic1.png')
racf <- acf(x, par1, main='Autocorrelation', xlab='time lag', ylab='ACF', ci.type=par6, ci=par7, sub=mysub)
dev.off()
bitmap(file='pic2.png')
rpacf <- pacf(x,par1,main='Partial Autocorrelation',xlab='lags',ylab='PACF',sub=mysub)
dev.off()
(myacf <- c(racf$acf))
(mypacf <- c(rpacf$acf))
lengthx <- length(x)
sqrtn <- sqrt(lengthx)
load(file='createtable')
a<-table.start()
a<-table.row.start(a)
a<-table.element(a,'Autocorrelation Function',4,TRUE)
a<-table.row.end(a)
a<-table.row.start(a)
a<-table.element(a,'Time lag k',header=TRUE)
a<-table.element(a,hyperlink('basics.htm','ACF(k)','click here for more information about the Autocorrelation Function'),header=TRUE)
a<-table.element(a,'T-STAT',header=TRUE)
a<-table.element(a,'P-value',header=TRUE)
a<-table.row.end(a)
for (i in 2:(par1+1)) {
a<-table.row.start(a)
a<-table.element(a,i-1,header=TRUE)
a<-table.element(a,round(myacf[i],6))
mytstat <- myacf[i]*sqrtn
a<-table.element(a,round(mytstat,4))
a<-table.element(a,round(1-pt(abs(mytstat),lengthx),6))
a<-table.row.end(a)
}
a<-table.end(a)
table.save(a,file='mytable.tab')
a<-table.start()
a<-table.row.start(a)
a<-table.element(a,'Partial Autocorrelation Function',4,TRUE)
a<-table.row.end(a)
a<-table.row.start(a)
a<-table.element(a,'Time lag k',header=TRUE)
a<-table.element(a,hyperlink('basics.htm','PACF(k)','click here for more information about the Partial Autocorrelation Function'),header=TRUE)
a<-table.element(a,'T-STAT',header=TRUE)
a<-table.element(a,'P-value',header=TRUE)
a<-table.row.end(a)
for (i in 1:par1) {
a<-table.row.start(a)
a<-table.element(a,i,header=TRUE)
a<-table.element(a,round(mypacf[i],6))
mytstat <- mypacf[i]*sqrtn
a<-table.element(a,round(mytstat,4))
a<-table.element(a,round(1-pt(abs(mytstat),lengthx),6))
a<-table.row.end(a)
}
a<-table.end(a)
table.save(a,file='mytable1.tab')