Free Statistics

of Irreproducible Research!

Author's title

Author*Unverified author*
R Software Modulerwasp_autocorrelation.wasp
Title produced by software(Partial) Autocorrelation Function
Date of computationThu, 05 Mar 2015 18:06:24 +0000
Cite this page as followsStatistical Computations at FreeStatistics.org, Office for Research Development and Education, URL https://freestatistics.org/blog/index.php?v=date/2015/Mar/05/t1425578848609ynl6a7z20dg1.htm/, Retrieved Fri, 17 May 2024 13:06:57 +0000
Statistical Computations at FreeStatistics.org, Office for Research Development and Education, URL https://freestatistics.org/blog/index.php?pk=277981, Retrieved Fri, 17 May 2024 13:06:57 +0000
QR Codes:

Original text written by user:
IsPrivate?No (this computation is public)
User-defined keywords
Estimated Impact94
Family? (F = Feedback message, R = changed R code, M = changed R Module, P = changed Parameters, D = changed Data)
-       [(Partial) Autocorrelation Function] [] [2015-03-05 18:06:24] [57f5dbee1b697c074ab0c7d81efd3c32] [Current]
Feedback Forum

Post a new message
Dataseries X:
732
768
902
739
744
848
745
752
833
703
824
759
797
840
988
819
831
904
814
798
828
789
930
744
832
826
907
776
835
715
729
733
736
712
711
667
799
661
692
649
729
622
671
635
648
744
624
476
710
515
461
590
415
554
585
513
591
561
684
668
795
776
1043
964
762
1030
939
779
918
839
874
840
794
820
1003
780
607
1001
743
810
716
775
883
633
755
782
882
694
896
674
702
799
791
797
1021
738
1023
955
912
850
1011
872
1074
811
878
1081
956
812
1125
1051
1090
1028
1178
1041
1146
866
875
1116
903
887


Summary of computational transaction
Raw Inputview raw input (R code)
Raw Outputview raw output of R engine
Computing time1 seconds
R Server'Gertrude Mary Cox' @ cox.wessa.net

\begin{tabular}{lllllllll}
\hline
Summary of computational transaction \tabularnewline
Raw Input & view raw input (R code)  \tabularnewline
Raw Output & view raw output of R engine  \tabularnewline
Computing time & 1 seconds \tabularnewline
R Server & 'Gertrude Mary Cox' @ cox.wessa.net \tabularnewline
\hline
\end{tabular}
%Source: https://freestatistics.org/blog/index.php?pk=277981&T=0

[TABLE]
[ROW][C]Summary of computational transaction[/C][/ROW]
[ROW][C]Raw Input[/C][C]view raw input (R code) [/C][/ROW]
[ROW][C]Raw Output[/C][C]view raw output of R engine [/C][/ROW]
[ROW][C]Computing time[/C][C]1 seconds[/C][/ROW]
[ROW][C]R Server[/C][C]'Gertrude Mary Cox' @ cox.wessa.net[/C][/ROW]
[/TABLE]
Source: https://freestatistics.org/blog/index.php?pk=277981&T=0

Globally Unique Identifier (entire table): ba.freestatistics.org/blog/index.php?pk=277981&T=0

As an alternative you can also use a QR Code:  

The GUIDs for individual cells are displayed in the table below:

Summary of computational transaction
Raw Inputview raw input (R code)
Raw Outputview raw output of R engine
Computing time1 seconds
R Server'Gertrude Mary Cox' @ cox.wessa.net


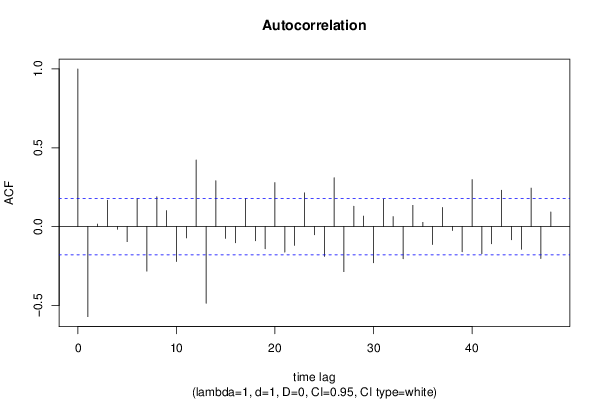
Autocorrelation Function
Time lag kACF(k)T-STATP-value
1-0.571513-6.23450
20.0157390.17170.431984
30.1665921.81730.035843
4-0.016544-0.18050.428542
5-0.095421-1.04090.150011
60.1763081.92330.028416
7-0.28266-3.08350.001272
80.1887752.05930.020824
90.1014191.10640.135403
10-0.221187-2.41290.008677
11-0.07164-0.78150.21803
120.4225954.615e-06
13-0.486234-5.30420
140.291073.17520.000953
15-0.074771-0.81570.208163
16-0.102722-1.12060.132365
170.1776421.93780.027505
18-0.090345-0.98550.163177
19-0.141203-1.54030.063065
200.2790943.04460.001435
21-0.161962-1.76680.039913
22-0.119521-1.30380.097406
230.2139642.33410.010635
24-0.052082-0.56810.285504
25-0.1894-2.06610.020494
260.3099373.3810.000489
27-0.286083-3.12080.001132
280.128651.40340.081549
290.0664570.7250.234949
30-0.229652-2.50520.006795
310.1730021.88720.030783
320.0632350.68980.245829
33-0.203763-2.22280.01406
340.1347131.46950.072162
350.0266510.29070.385882
36-0.114306-1.24690.107435
370.1214491.32480.09388
38-0.025539-0.27860.390517
39-0.160273-1.74840.04149
400.2981053.25190.000746
41-0.172957-1.88670.030816
42-0.109528-1.19480.117268
430.2303852.51320.006651
44-0.083221-0.90780.1829
45-0.14386-1.56930.059613
460.2439012.66060.004438
47-0.202642-2.21060.014489
480.0921611.00540.158381

\begin{tabular}{lllllllll}
\hline
Autocorrelation Function \tabularnewline
Time lag k & ACF(k) & T-STAT & P-value \tabularnewline
1 & -0.571513 & -6.2345 & 0 \tabularnewline
2 & 0.015739 & 0.1717 & 0.431984 \tabularnewline
3 & 0.166592 & 1.8173 & 0.035843 \tabularnewline
4 & -0.016544 & -0.1805 & 0.428542 \tabularnewline
5 & -0.095421 & -1.0409 & 0.150011 \tabularnewline
6 & 0.176308 & 1.9233 & 0.028416 \tabularnewline
7 & -0.28266 & -3.0835 & 0.001272 \tabularnewline
8 & 0.188775 & 2.0593 & 0.020824 \tabularnewline
9 & 0.101419 & 1.1064 & 0.135403 \tabularnewline
10 & -0.221187 & -2.4129 & 0.008677 \tabularnewline
11 & -0.07164 & -0.7815 & 0.21803 \tabularnewline
12 & 0.422595 & 4.61 & 5e-06 \tabularnewline
13 & -0.486234 & -5.3042 & 0 \tabularnewline
14 & 0.29107 & 3.1752 & 0.000953 \tabularnewline
15 & -0.074771 & -0.8157 & 0.208163 \tabularnewline
16 & -0.102722 & -1.1206 & 0.132365 \tabularnewline
17 & 0.177642 & 1.9378 & 0.027505 \tabularnewline
18 & -0.090345 & -0.9855 & 0.163177 \tabularnewline
19 & -0.141203 & -1.5403 & 0.063065 \tabularnewline
20 & 0.279094 & 3.0446 & 0.001435 \tabularnewline
21 & -0.161962 & -1.7668 & 0.039913 \tabularnewline
22 & -0.119521 & -1.3038 & 0.097406 \tabularnewline
23 & 0.213964 & 2.3341 & 0.010635 \tabularnewline
24 & -0.052082 & -0.5681 & 0.285504 \tabularnewline
25 & -0.1894 & -2.0661 & 0.020494 \tabularnewline
26 & 0.309937 & 3.381 & 0.000489 \tabularnewline
27 & -0.286083 & -3.1208 & 0.001132 \tabularnewline
28 & 0.12865 & 1.4034 & 0.081549 \tabularnewline
29 & 0.066457 & 0.725 & 0.234949 \tabularnewline
30 & -0.229652 & -2.5052 & 0.006795 \tabularnewline
31 & 0.173002 & 1.8872 & 0.030783 \tabularnewline
32 & 0.063235 & 0.6898 & 0.245829 \tabularnewline
33 & -0.203763 & -2.2228 & 0.01406 \tabularnewline
34 & 0.134713 & 1.4695 & 0.072162 \tabularnewline
35 & 0.026651 & 0.2907 & 0.385882 \tabularnewline
36 & -0.114306 & -1.2469 & 0.107435 \tabularnewline
37 & 0.121449 & 1.3248 & 0.09388 \tabularnewline
38 & -0.025539 & -0.2786 & 0.390517 \tabularnewline
39 & -0.160273 & -1.7484 & 0.04149 \tabularnewline
40 & 0.298105 & 3.2519 & 0.000746 \tabularnewline
41 & -0.172957 & -1.8867 & 0.030816 \tabularnewline
42 & -0.109528 & -1.1948 & 0.117268 \tabularnewline
43 & 0.230385 & 2.5132 & 0.006651 \tabularnewline
44 & -0.083221 & -0.9078 & 0.1829 \tabularnewline
45 & -0.14386 & -1.5693 & 0.059613 \tabularnewline
46 & 0.243901 & 2.6606 & 0.004438 \tabularnewline
47 & -0.202642 & -2.2106 & 0.014489 \tabularnewline
48 & 0.092161 & 1.0054 & 0.158381 \tabularnewline
\hline
\end{tabular}
%Source: https://freestatistics.org/blog/index.php?pk=277981&T=1

[TABLE]
[ROW][C]Autocorrelation Function[/C][/ROW]
[ROW][C]Time lag k[/C][C]ACF(k)[/C][C]T-STAT[/C][C]P-value[/C][/ROW]
[ROW][C]1[/C][C]-0.571513[/C][C]-6.2345[/C][C]0[/C][/ROW]
[ROW][C]2[/C][C]0.015739[/C][C]0.1717[/C][C]0.431984[/C][/ROW]
[ROW][C]3[/C][C]0.166592[/C][C]1.8173[/C][C]0.035843[/C][/ROW]
[ROW][C]4[/C][C]-0.016544[/C][C]-0.1805[/C][C]0.428542[/C][/ROW]
[ROW][C]5[/C][C]-0.095421[/C][C]-1.0409[/C][C]0.150011[/C][/ROW]
[ROW][C]6[/C][C]0.176308[/C][C]1.9233[/C][C]0.028416[/C][/ROW]
[ROW][C]7[/C][C]-0.28266[/C][C]-3.0835[/C][C]0.001272[/C][/ROW]
[ROW][C]8[/C][C]0.188775[/C][C]2.0593[/C][C]0.020824[/C][/ROW]
[ROW][C]9[/C][C]0.101419[/C][C]1.1064[/C][C]0.135403[/C][/ROW]
[ROW][C]10[/C][C]-0.221187[/C][C]-2.4129[/C][C]0.008677[/C][/ROW]
[ROW][C]11[/C][C]-0.07164[/C][C]-0.7815[/C][C]0.21803[/C][/ROW]
[ROW][C]12[/C][C]0.422595[/C][C]4.61[/C][C]5e-06[/C][/ROW]
[ROW][C]13[/C][C]-0.486234[/C][C]-5.3042[/C][C]0[/C][/ROW]
[ROW][C]14[/C][C]0.29107[/C][C]3.1752[/C][C]0.000953[/C][/ROW]
[ROW][C]15[/C][C]-0.074771[/C][C]-0.8157[/C][C]0.208163[/C][/ROW]
[ROW][C]16[/C][C]-0.102722[/C][C]-1.1206[/C][C]0.132365[/C][/ROW]
[ROW][C]17[/C][C]0.177642[/C][C]1.9378[/C][C]0.027505[/C][/ROW]
[ROW][C]18[/C][C]-0.090345[/C][C]-0.9855[/C][C]0.163177[/C][/ROW]
[ROW][C]19[/C][C]-0.141203[/C][C]-1.5403[/C][C]0.063065[/C][/ROW]
[ROW][C]20[/C][C]0.279094[/C][C]3.0446[/C][C]0.001435[/C][/ROW]
[ROW][C]21[/C][C]-0.161962[/C][C]-1.7668[/C][C]0.039913[/C][/ROW]
[ROW][C]22[/C][C]-0.119521[/C][C]-1.3038[/C][C]0.097406[/C][/ROW]
[ROW][C]23[/C][C]0.213964[/C][C]2.3341[/C][C]0.010635[/C][/ROW]
[ROW][C]24[/C][C]-0.052082[/C][C]-0.5681[/C][C]0.285504[/C][/ROW]
[ROW][C]25[/C][C]-0.1894[/C][C]-2.0661[/C][C]0.020494[/C][/ROW]
[ROW][C]26[/C][C]0.309937[/C][C]3.381[/C][C]0.000489[/C][/ROW]
[ROW][C]27[/C][C]-0.286083[/C][C]-3.1208[/C][C]0.001132[/C][/ROW]
[ROW][C]28[/C][C]0.12865[/C][C]1.4034[/C][C]0.081549[/C][/ROW]
[ROW][C]29[/C][C]0.066457[/C][C]0.725[/C][C]0.234949[/C][/ROW]
[ROW][C]30[/C][C]-0.229652[/C][C]-2.5052[/C][C]0.006795[/C][/ROW]
[ROW][C]31[/C][C]0.173002[/C][C]1.8872[/C][C]0.030783[/C][/ROW]
[ROW][C]32[/C][C]0.063235[/C][C]0.6898[/C][C]0.245829[/C][/ROW]
[ROW][C]33[/C][C]-0.203763[/C][C]-2.2228[/C][C]0.01406[/C][/ROW]
[ROW][C]34[/C][C]0.134713[/C][C]1.4695[/C][C]0.072162[/C][/ROW]
[ROW][C]35[/C][C]0.026651[/C][C]0.2907[/C][C]0.385882[/C][/ROW]
[ROW][C]36[/C][C]-0.114306[/C][C]-1.2469[/C][C]0.107435[/C][/ROW]
[ROW][C]37[/C][C]0.121449[/C][C]1.3248[/C][C]0.09388[/C][/ROW]
[ROW][C]38[/C][C]-0.025539[/C][C]-0.2786[/C][C]0.390517[/C][/ROW]
[ROW][C]39[/C][C]-0.160273[/C][C]-1.7484[/C][C]0.04149[/C][/ROW]
[ROW][C]40[/C][C]0.298105[/C][C]3.2519[/C][C]0.000746[/C][/ROW]
[ROW][C]41[/C][C]-0.172957[/C][C]-1.8867[/C][C]0.030816[/C][/ROW]
[ROW][C]42[/C][C]-0.109528[/C][C]-1.1948[/C][C]0.117268[/C][/ROW]
[ROW][C]43[/C][C]0.230385[/C][C]2.5132[/C][C]0.006651[/C][/ROW]
[ROW][C]44[/C][C]-0.083221[/C][C]-0.9078[/C][C]0.1829[/C][/ROW]
[ROW][C]45[/C][C]-0.14386[/C][C]-1.5693[/C][C]0.059613[/C][/ROW]
[ROW][C]46[/C][C]0.243901[/C][C]2.6606[/C][C]0.004438[/C][/ROW]
[ROW][C]47[/C][C]-0.202642[/C][C]-2.2106[/C][C]0.014489[/C][/ROW]
[ROW][C]48[/C][C]0.092161[/C][C]1.0054[/C][C]0.158381[/C][/ROW]
[/TABLE]
Source: https://freestatistics.org/blog/index.php?pk=277981&T=1

Globally Unique Identifier (entire table): ba.freestatistics.org/blog/index.php?pk=277981&T=1

As an alternative you can also use a QR Code:  

The GUIDs for individual cells are displayed in the table below:

Autocorrelation Function
Time lag kACF(k)T-STATP-value
1-0.571513-6.23450
20.0157390.17170.431984
30.1665921.81730.035843
4-0.016544-0.18050.428542
5-0.095421-1.04090.150011
60.1763081.92330.028416
7-0.28266-3.08350.001272
80.1887752.05930.020824
90.1014191.10640.135403
10-0.221187-2.41290.008677
11-0.07164-0.78150.21803
120.4225954.615e-06
13-0.486234-5.30420
140.291073.17520.000953
15-0.074771-0.81570.208163
16-0.102722-1.12060.132365
170.1776421.93780.027505
18-0.090345-0.98550.163177
19-0.141203-1.54030.063065
200.2790943.04460.001435
21-0.161962-1.76680.039913
22-0.119521-1.30380.097406
230.2139642.33410.010635
24-0.052082-0.56810.285504
25-0.1894-2.06610.020494
260.3099373.3810.000489
27-0.286083-3.12080.001132
280.128651.40340.081549
290.0664570.7250.234949
30-0.229652-2.50520.006795
310.1730021.88720.030783
320.0632350.68980.245829
33-0.203763-2.22280.01406
340.1347131.46950.072162
350.0266510.29070.385882
36-0.114306-1.24690.107435
370.1214491.32480.09388
38-0.025539-0.27860.390517
39-0.160273-1.74840.04149
400.2981053.25190.000746
41-0.172957-1.88670.030816
42-0.109528-1.19480.117268
430.2303852.51320.006651
44-0.083221-0.90780.1829
45-0.14386-1.56930.059613
460.2439012.66060.004438
47-0.202642-2.21060.014489
480.0921611.00540.158381


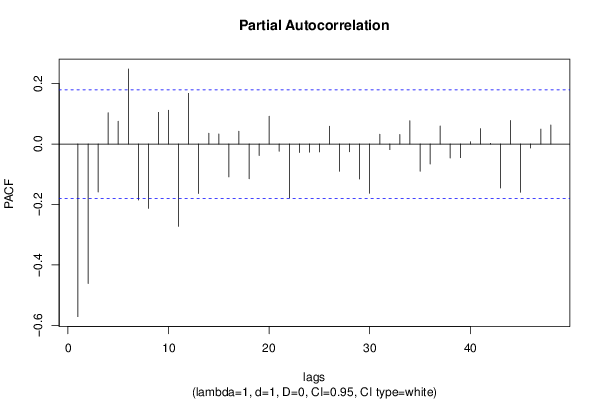
Partial Autocorrelation Function
Time lag kPACF(k)T-STATP-value
1-0.571513-6.23450
2-0.461689-5.03641e-06
3-0.158767-1.73190.042937
40.1034891.12890.1306
50.0758270.82720.204898
60.2487762.71380.00382
7-0.185297-2.02140.022744
8-0.213092-2.32460.010896
90.1049351.14470.127313
100.1122981.2250.111492
11-0.272686-2.97470.001776
120.167921.83180.034742
13-0.163656-1.78530.038382
140.035880.39140.3481
150.0333620.36390.358276
16-0.108735-1.18620.11896
170.0425960.46470.32151
18-0.115004-1.25450.106052
19-0.03805-0.41510.339415
200.0923261.00720.15795
21-0.023918-0.26090.397307
22-0.178702-1.94940.0268
23-0.028048-0.3060.380084
24-0.026798-0.29230.38527
25-0.025845-0.28190.38924
260.0589730.64330.260626
27-0.089767-0.97920.164723
28-0.025427-0.27740.390987
29-0.115456-1.25950.105161
30-0.162621-1.7740.039312
310.0327810.35760.360638
32-0.018528-0.20210.420087
330.0315290.34390.36575
340.0773770.84410.20016
35-0.089872-0.98040.164441
36-0.065921-0.71910.236739
370.0596380.65060.258289
38-0.046037-0.50220.308226
39-0.044908-0.48990.312557
400.0077790.08490.466258
410.0512790.55940.288475
420.0022710.02480.490139
43-0.145368-1.58580.057721
440.0781340.85230.197869
45-0.159814-1.74340.041926
46-0.013057-0.14240.443487
470.0496030.54110.294724
480.0633820.69140.245326

\begin{tabular}{lllllllll}
\hline
Partial Autocorrelation Function \tabularnewline
Time lag k & PACF(k) & T-STAT & P-value \tabularnewline
1 & -0.571513 & -6.2345 & 0 \tabularnewline
2 & -0.461689 & -5.0364 & 1e-06 \tabularnewline
3 & -0.158767 & -1.7319 & 0.042937 \tabularnewline
4 & 0.103489 & 1.1289 & 0.1306 \tabularnewline
5 & 0.075827 & 0.8272 & 0.204898 \tabularnewline
6 & 0.248776 & 2.7138 & 0.00382 \tabularnewline
7 & -0.185297 & -2.0214 & 0.022744 \tabularnewline
8 & -0.213092 & -2.3246 & 0.010896 \tabularnewline
9 & 0.104935 & 1.1447 & 0.127313 \tabularnewline
10 & 0.112298 & 1.225 & 0.111492 \tabularnewline
11 & -0.272686 & -2.9747 & 0.001776 \tabularnewline
12 & 0.16792 & 1.8318 & 0.034742 \tabularnewline
13 & -0.163656 & -1.7853 & 0.038382 \tabularnewline
14 & 0.03588 & 0.3914 & 0.3481 \tabularnewline
15 & 0.033362 & 0.3639 & 0.358276 \tabularnewline
16 & -0.108735 & -1.1862 & 0.11896 \tabularnewline
17 & 0.042596 & 0.4647 & 0.32151 \tabularnewline
18 & -0.115004 & -1.2545 & 0.106052 \tabularnewline
19 & -0.03805 & -0.4151 & 0.339415 \tabularnewline
20 & 0.092326 & 1.0072 & 0.15795 \tabularnewline
21 & -0.023918 & -0.2609 & 0.397307 \tabularnewline
22 & -0.178702 & -1.9494 & 0.0268 \tabularnewline
23 & -0.028048 & -0.306 & 0.380084 \tabularnewline
24 & -0.026798 & -0.2923 & 0.38527 \tabularnewline
25 & -0.025845 & -0.2819 & 0.38924 \tabularnewline
26 & 0.058973 & 0.6433 & 0.260626 \tabularnewline
27 & -0.089767 & -0.9792 & 0.164723 \tabularnewline
28 & -0.025427 & -0.2774 & 0.390987 \tabularnewline
29 & -0.115456 & -1.2595 & 0.105161 \tabularnewline
30 & -0.162621 & -1.774 & 0.039312 \tabularnewline
31 & 0.032781 & 0.3576 & 0.360638 \tabularnewline
32 & -0.018528 & -0.2021 & 0.420087 \tabularnewline
33 & 0.031529 & 0.3439 & 0.36575 \tabularnewline
34 & 0.077377 & 0.8441 & 0.20016 \tabularnewline
35 & -0.089872 & -0.9804 & 0.164441 \tabularnewline
36 & -0.065921 & -0.7191 & 0.236739 \tabularnewline
37 & 0.059638 & 0.6506 & 0.258289 \tabularnewline
38 & -0.046037 & -0.5022 & 0.308226 \tabularnewline
39 & -0.044908 & -0.4899 & 0.312557 \tabularnewline
40 & 0.007779 & 0.0849 & 0.466258 \tabularnewline
41 & 0.051279 & 0.5594 & 0.288475 \tabularnewline
42 & 0.002271 & 0.0248 & 0.490139 \tabularnewline
43 & -0.145368 & -1.5858 & 0.057721 \tabularnewline
44 & 0.078134 & 0.8523 & 0.197869 \tabularnewline
45 & -0.159814 & -1.7434 & 0.041926 \tabularnewline
46 & -0.013057 & -0.1424 & 0.443487 \tabularnewline
47 & 0.049603 & 0.5411 & 0.294724 \tabularnewline
48 & 0.063382 & 0.6914 & 0.245326 \tabularnewline
\hline
\end{tabular}
%Source: https://freestatistics.org/blog/index.php?pk=277981&T=2

[TABLE]
[ROW][C]Partial Autocorrelation Function[/C][/ROW]
[ROW][C]Time lag k[/C][C]PACF(k)[/C][C]T-STAT[/C][C]P-value[/C][/ROW]
[ROW][C]1[/C][C]-0.571513[/C][C]-6.2345[/C][C]0[/C][/ROW]
[ROW][C]2[/C][C]-0.461689[/C][C]-5.0364[/C][C]1e-06[/C][/ROW]
[ROW][C]3[/C][C]-0.158767[/C][C]-1.7319[/C][C]0.042937[/C][/ROW]
[ROW][C]4[/C][C]0.103489[/C][C]1.1289[/C][C]0.1306[/C][/ROW]
[ROW][C]5[/C][C]0.075827[/C][C]0.8272[/C][C]0.204898[/C][/ROW]
[ROW][C]6[/C][C]0.248776[/C][C]2.7138[/C][C]0.00382[/C][/ROW]
[ROW][C]7[/C][C]-0.185297[/C][C]-2.0214[/C][C]0.022744[/C][/ROW]
[ROW][C]8[/C][C]-0.213092[/C][C]-2.3246[/C][C]0.010896[/C][/ROW]
[ROW][C]9[/C][C]0.104935[/C][C]1.1447[/C][C]0.127313[/C][/ROW]
[ROW][C]10[/C][C]0.112298[/C][C]1.225[/C][C]0.111492[/C][/ROW]
[ROW][C]11[/C][C]-0.272686[/C][C]-2.9747[/C][C]0.001776[/C][/ROW]
[ROW][C]12[/C][C]0.16792[/C][C]1.8318[/C][C]0.034742[/C][/ROW]
[ROW][C]13[/C][C]-0.163656[/C][C]-1.7853[/C][C]0.038382[/C][/ROW]
[ROW][C]14[/C][C]0.03588[/C][C]0.3914[/C][C]0.3481[/C][/ROW]
[ROW][C]15[/C][C]0.033362[/C][C]0.3639[/C][C]0.358276[/C][/ROW]
[ROW][C]16[/C][C]-0.108735[/C][C]-1.1862[/C][C]0.11896[/C][/ROW]
[ROW][C]17[/C][C]0.042596[/C][C]0.4647[/C][C]0.32151[/C][/ROW]
[ROW][C]18[/C][C]-0.115004[/C][C]-1.2545[/C][C]0.106052[/C][/ROW]
[ROW][C]19[/C][C]-0.03805[/C][C]-0.4151[/C][C]0.339415[/C][/ROW]
[ROW][C]20[/C][C]0.092326[/C][C]1.0072[/C][C]0.15795[/C][/ROW]
[ROW][C]21[/C][C]-0.023918[/C][C]-0.2609[/C][C]0.397307[/C][/ROW]
[ROW][C]22[/C][C]-0.178702[/C][C]-1.9494[/C][C]0.0268[/C][/ROW]
[ROW][C]23[/C][C]-0.028048[/C][C]-0.306[/C][C]0.380084[/C][/ROW]
[ROW][C]24[/C][C]-0.026798[/C][C]-0.2923[/C][C]0.38527[/C][/ROW]
[ROW][C]25[/C][C]-0.025845[/C][C]-0.2819[/C][C]0.38924[/C][/ROW]
[ROW][C]26[/C][C]0.058973[/C][C]0.6433[/C][C]0.260626[/C][/ROW]
[ROW][C]27[/C][C]-0.089767[/C][C]-0.9792[/C][C]0.164723[/C][/ROW]
[ROW][C]28[/C][C]-0.025427[/C][C]-0.2774[/C][C]0.390987[/C][/ROW]
[ROW][C]29[/C][C]-0.115456[/C][C]-1.2595[/C][C]0.105161[/C][/ROW]
[ROW][C]30[/C][C]-0.162621[/C][C]-1.774[/C][C]0.039312[/C][/ROW]
[ROW][C]31[/C][C]0.032781[/C][C]0.3576[/C][C]0.360638[/C][/ROW]
[ROW][C]32[/C][C]-0.018528[/C][C]-0.2021[/C][C]0.420087[/C][/ROW]
[ROW][C]33[/C][C]0.031529[/C][C]0.3439[/C][C]0.36575[/C][/ROW]
[ROW][C]34[/C][C]0.077377[/C][C]0.8441[/C][C]0.20016[/C][/ROW]
[ROW][C]35[/C][C]-0.089872[/C][C]-0.9804[/C][C]0.164441[/C][/ROW]
[ROW][C]36[/C][C]-0.065921[/C][C]-0.7191[/C][C]0.236739[/C][/ROW]
[ROW][C]37[/C][C]0.059638[/C][C]0.6506[/C][C]0.258289[/C][/ROW]
[ROW][C]38[/C][C]-0.046037[/C][C]-0.5022[/C][C]0.308226[/C][/ROW]
[ROW][C]39[/C][C]-0.044908[/C][C]-0.4899[/C][C]0.312557[/C][/ROW]
[ROW][C]40[/C][C]0.007779[/C][C]0.0849[/C][C]0.466258[/C][/ROW]
[ROW][C]41[/C][C]0.051279[/C][C]0.5594[/C][C]0.288475[/C][/ROW]
[ROW][C]42[/C][C]0.002271[/C][C]0.0248[/C][C]0.490139[/C][/ROW]
[ROW][C]43[/C][C]-0.145368[/C][C]-1.5858[/C][C]0.057721[/C][/ROW]
[ROW][C]44[/C][C]0.078134[/C][C]0.8523[/C][C]0.197869[/C][/ROW]
[ROW][C]45[/C][C]-0.159814[/C][C]-1.7434[/C][C]0.041926[/C][/ROW]
[ROW][C]46[/C][C]-0.013057[/C][C]-0.1424[/C][C]0.443487[/C][/ROW]
[ROW][C]47[/C][C]0.049603[/C][C]0.5411[/C][C]0.294724[/C][/ROW]
[ROW][C]48[/C][C]0.063382[/C][C]0.6914[/C][C]0.245326[/C][/ROW]
[/TABLE]
Source: https://freestatistics.org/blog/index.php?pk=277981&T=2

Globally Unique Identifier (entire table): ba.freestatistics.org/blog/index.php?pk=277981&T=2

As an alternative you can also use a QR Code:  

The GUIDs for individual cells are displayed in the table below:

Partial Autocorrelation Function
Time lag kPACF(k)T-STATP-value
1-0.571513-6.23450
2-0.461689-5.03641e-06
3-0.158767-1.73190.042937
40.1034891.12890.1306
50.0758270.82720.204898
60.2487762.71380.00382
7-0.185297-2.02140.022744
8-0.213092-2.32460.010896
90.1049351.14470.127313
100.1122981.2250.111492
11-0.272686-2.97470.001776
120.167921.83180.034742
13-0.163656-1.78530.038382
140.035880.39140.3481
150.0333620.36390.358276
16-0.108735-1.18620.11896
170.0425960.46470.32151
18-0.115004-1.25450.106052
19-0.03805-0.41510.339415
200.0923261.00720.15795
21-0.023918-0.26090.397307
22-0.178702-1.94940.0268
23-0.028048-0.3060.380084
24-0.026798-0.29230.38527
25-0.025845-0.28190.38924
260.0589730.64330.260626
27-0.089767-0.97920.164723
28-0.025427-0.27740.390987
29-0.115456-1.25950.105161
30-0.162621-1.7740.039312
310.0327810.35760.360638
32-0.018528-0.20210.420087
330.0315290.34390.36575
340.0773770.84410.20016
35-0.089872-0.98040.164441
36-0.065921-0.71910.236739
370.0596380.65060.258289
38-0.046037-0.50220.308226
39-0.044908-0.48990.312557
400.0077790.08490.466258
410.0512790.55940.288475
420.0022710.02480.490139
43-0.145368-1.58580.057721
440.0781340.85230.197869
45-0.159814-1.74340.041926
46-0.013057-0.14240.443487
470.0496030.54110.294724
480.0633820.69140.245326


Parameters (Session):
par1 = 48 ; par2 = 1 ; par3 = 1 ; par4 = 0 ; par5 = 12 ; par6 = White Noise ; par7 = 0.95 ;
Parameters (R input):
par1 = 48 ; par2 = 1 ; par3 = 1 ; par4 = 0 ; par5 = 12 ; par6 = White Noise ; par7 = 0.95 ; par8 = ;
R code (references can be found in the software module):
par8 <- ''
par7 <- '0.95'
par6 <- 'White Noise'
par5 <- '12'
par4 <- '0'
par3 <- '0'
par2 <- '1'
par1 <- '48'
if (par1 == 'Default') {
par1 = 10*log10(length(x))
} else {
par1 <- as.numeric(par1)
}
par2 <- as.numeric(par2)
par3 <- as.numeric(par3)
par4 <- as.numeric(par4)
par5 <- as.numeric(par5)
if (par6 == 'White Noise') par6 <- 'white' else par6 <- 'ma'
par7 <- as.numeric(par7)
if (par8 != '') par8 <- as.numeric(par8)
ox <- x
if (par8 == '') {
if (par2 == 0) {
x <- log(x)
} else {
x <- (x ^ par2 - 1) / par2
}
} else {
x <- log(x,base=par8)
}
if (par3 > 0) x <- diff(x,lag=1,difference=par3)
if (par4 > 0) x <- diff(x,lag=par5,difference=par4)
bitmap(file='picts.png')
op <- par(mfrow=c(2,1))
plot(ox,type='l',main='Original Time Series',xlab='time',ylab='value')
if (par8=='') {
mytitle <- paste('Working Time Series (lambda=',par2,', d=',par3,', D=',par4,')',sep='')
mysub <- paste('(lambda=',par2,', d=',par3,', D=',par4,', CI=', par7, ', CI type=',par6,')',sep='')
} else {
mytitle <- paste('Working Time Series (base=',par8,', d=',par3,', D=',par4,')',sep='')
mysub <- paste('(base=',par8,', d=',par3,', D=',par4,', CI=', par7, ', CI type=',par6,')',sep='')
}
plot(x,type='l', main=mytitle,xlab='time',ylab='value')
par(op)
dev.off()
bitmap(file='pic1.png')
racf <- acf(x, par1, main='Autocorrelation', xlab='time lag', ylab='ACF', ci.type=par6, ci=par7, sub=mysub)
dev.off()
bitmap(file='pic2.png')
rpacf <- pacf(x,par1,main='Partial Autocorrelation',xlab='lags',ylab='PACF',sub=mysub)
dev.off()
(myacf <- c(racf$acf))
(mypacf <- c(rpacf$acf))
lengthx <- length(x)
sqrtn <- sqrt(lengthx)
load(file='createtable')
a<-table.start()
a<-table.row.start(a)
a<-table.element(a,'Autocorrelation Function',4,TRUE)
a<-table.row.end(a)
a<-table.row.start(a)
a<-table.element(a,'Time lag k',header=TRUE)
a<-table.element(a,hyperlink('basics.htm','ACF(k)','click here for more information about the Autocorrelation Function'),header=TRUE)
a<-table.element(a,'T-STAT',header=TRUE)
a<-table.element(a,'P-value',header=TRUE)
a<-table.row.end(a)
for (i in 2:(par1+1)) {
a<-table.row.start(a)
a<-table.element(a,i-1,header=TRUE)
a<-table.element(a,round(myacf[i],6))
mytstat <- myacf[i]*sqrtn
a<-table.element(a,round(mytstat,4))
a<-table.element(a,round(1-pt(abs(mytstat),lengthx),6))
a<-table.row.end(a)
}
a<-table.end(a)
table.save(a,file='mytable.tab')
a<-table.start()
a<-table.row.start(a)
a<-table.element(a,'Partial Autocorrelation Function',4,TRUE)
a<-table.row.end(a)
a<-table.row.start(a)
a<-table.element(a,'Time lag k',header=TRUE)
a<-table.element(a,hyperlink('basics.htm','PACF(k)','click here for more information about the Partial Autocorrelation Function'),header=TRUE)
a<-table.element(a,'T-STAT',header=TRUE)
a<-table.element(a,'P-value',header=TRUE)
a<-table.row.end(a)
for (i in 1:par1) {
a<-table.row.start(a)
a<-table.element(a,i,header=TRUE)
a<-table.element(a,round(mypacf[i],6))
mytstat <- mypacf[i]*sqrtn
a<-table.element(a,round(mytstat,4))
a<-table.element(a,round(1-pt(abs(mytstat),lengthx),6))
a<-table.row.end(a)
}
a<-table.end(a)
table.save(a,file='mytable1.tab')