Free Statistics

of Irreproducible Research!

Author's title

Author*Unverified author*
R Software Modulerwasp_autocorrelation.wasp
Title produced by software(Partial) Autocorrelation Function
Date of computationThu, 05 Mar 2015 19:02:30 +0000
Cite this page as followsStatistical Computations at FreeStatistics.org, Office for Research Development and Education, URL https://freestatistics.org/blog/index.php?v=date/2015/Mar/05/t1425582198st75u1fw099khrw.htm/, Retrieved Fri, 17 May 2024 01:33:12 +0000
Statistical Computations at FreeStatistics.org, Office for Research Development and Education, URL https://freestatistics.org/blog/index.php?pk=277990, Retrieved Fri, 17 May 2024 01:33:12 +0000
QR Codes:

Original text written by user:
IsPrivate?No (this computation is public)
User-defined keywords
Estimated Impact66
Family? (F = Feedback message, R = changed R code, M = changed R Module, P = changed Parameters, D = changed Data)
-       [(Partial) Autocorrelation Function] [] [2015-03-05 19:02:30] [efb69546851bccb1c0576f78d5afa44b] [Current]
Feedback Forum

Post a new message
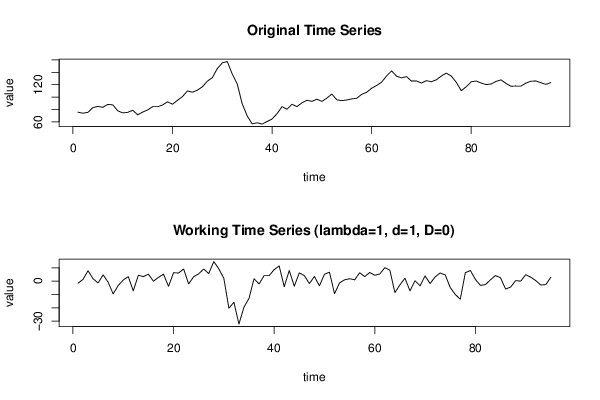
Dataseries X:
75.6
74
75.3
83.1
84.9
83.5
88.2
87.4
77.8
74.5
75.3
78.7
71.4
75.8
79.2
84.4
84.4
87.2
92.4
88.5
94.8
100.9
110
107.9
111.2
116.7
125.8
131.5
146.2
155.4
157.5
137.2
121.3
89.1
69.6
56.7
58.5
56.4
60.5
64.6
73.2
84.6
80.4
88.4
84.6
90.8
94.9
93.1
96.6
93.1
98.3
105
95.6
94.3
95.3
97.1
98.1
104.4
107.8
114.3
118.7
124.1
134.2
142.4
133.8
131
133.2
125.9
126.2
122.7
126.6
124.8
128
134.1
138.8
134
124
110.4
116.7
124.7
126
122.8
120.2
121.2
125.4
127.9
122
117.5
117.9
117.9
122.7
125.7
126.1
123.2
120.6
123.5


Summary of computational transaction
Raw Inputview raw input (R code)
Raw Outputview raw output of R engine
Computing time2 seconds
R Server'Herman Ole Andreas Wold' @ wold.wessa.net

\begin{tabular}{lllllllll}
\hline
Summary of computational transaction \tabularnewline
Raw Input & view raw input (R code)  \tabularnewline
Raw Output & view raw output of R engine  \tabularnewline
Computing time & 2 seconds \tabularnewline
R Server & 'Herman Ole Andreas Wold' @ wold.wessa.net \tabularnewline
\hline
\end{tabular}
%Source: https://freestatistics.org/blog/index.php?pk=277990&T=0

[TABLE]
[ROW][C]Summary of computational transaction[/C][/ROW]
[ROW][C]Raw Input[/C][C]view raw input (R code) [/C][/ROW]
[ROW][C]Raw Output[/C][C]view raw output of R engine [/C][/ROW]
[ROW][C]Computing time[/C][C]2 seconds[/C][/ROW]
[ROW][C]R Server[/C][C]'Herman Ole Andreas Wold' @ wold.wessa.net[/C][/ROW]
[/TABLE]
Source: https://freestatistics.org/blog/index.php?pk=277990&T=0

Globally Unique Identifier (entire table): ba.freestatistics.org/blog/index.php?pk=277990&T=0

As an alternative you can also use a QR Code:  

The GUIDs for individual cells are displayed in the table below:

Summary of computational transaction
Raw Inputview raw input (R code)
Raw Outputview raw output of R engine
Computing time2 seconds
R Server'Herman Ole Andreas Wold' @ wold.wessa.net


Autocorrelation Function
Time lag kACF(k)T-STATP-value
10.4832014.70974e-06
20.2850332.77820.003294
30.0237650.23160.408659
4-0.048681-0.47450.318123
5-0.181346-1.76750.040174
6-0.242246-2.36110.010131
7-0.217225-2.11720.018425
8-0.197722-1.92720.028474
9-0.183087-1.78450.038766
10-0.074525-0.72640.234695
110.0233270.22740.410313
122.2e-052e-040.499914
13-0.09822-0.95730.170415
14-0.109229-1.06460.14487
15-0.017227-0.16790.433507
16-0.027996-0.27290.392773
17-0.000766-0.00750.497029
18-0.013754-0.13410.44682
190.0443530.43230.333251
20-0.035799-0.34890.363957
210.0616720.60110.274601
220.0881820.85950.196116
230.0977290.95250.17162
24-0.051103-0.49810.309786
250.045510.44360.329178
26-0.112973-1.10110.136812
27-0.119114-1.1610.12428
28-0.137976-1.34480.090942
29-0.105627-1.02950.152923
30-0.06038-0.58850.278792
31-0.066599-0.64910.258911
320.0339380.33080.370766
330.1617041.57610.059165
340.1424061.3880.084191
350.059860.58340.280488
36-0.001588-0.01550.493842
370.0036190.03530.485968
38-0.019127-0.18640.426252
39-0.072761-0.70920.239974
400.0035360.03450.486288
41-0.006924-0.06750.473167
420.0738380.71970.236744
430.0790970.77090.221326
440.1687191.64450.051692
450.0650640.63420.26375
46-0.028765-0.28040.389904
47-0.076784-0.74840.228036
48-0.030993-0.30210.381626

\begin{tabular}{lllllllll}
\hline
Autocorrelation Function \tabularnewline
Time lag k & ACF(k) & T-STAT & P-value \tabularnewline
1 & 0.483201 & 4.7097 & 4e-06 \tabularnewline
2 & 0.285033 & 2.7782 & 0.003294 \tabularnewline
3 & 0.023765 & 0.2316 & 0.408659 \tabularnewline
4 & -0.048681 & -0.4745 & 0.318123 \tabularnewline
5 & -0.181346 & -1.7675 & 0.040174 \tabularnewline
6 & -0.242246 & -2.3611 & 0.010131 \tabularnewline
7 & -0.217225 & -2.1172 & 0.018425 \tabularnewline
8 & -0.197722 & -1.9272 & 0.028474 \tabularnewline
9 & -0.183087 & -1.7845 & 0.038766 \tabularnewline
10 & -0.074525 & -0.7264 & 0.234695 \tabularnewline
11 & 0.023327 & 0.2274 & 0.410313 \tabularnewline
12 & 2.2e-05 & 2e-04 & 0.499914 \tabularnewline
13 & -0.09822 & -0.9573 & 0.170415 \tabularnewline
14 & -0.109229 & -1.0646 & 0.14487 \tabularnewline
15 & -0.017227 & -0.1679 & 0.433507 \tabularnewline
16 & -0.027996 & -0.2729 & 0.392773 \tabularnewline
17 & -0.000766 & -0.0075 & 0.497029 \tabularnewline
18 & -0.013754 & -0.1341 & 0.44682 \tabularnewline
19 & 0.044353 & 0.4323 & 0.333251 \tabularnewline
20 & -0.035799 & -0.3489 & 0.363957 \tabularnewline
21 & 0.061672 & 0.6011 & 0.274601 \tabularnewline
22 & 0.088182 & 0.8595 & 0.196116 \tabularnewline
23 & 0.097729 & 0.9525 & 0.17162 \tabularnewline
24 & -0.051103 & -0.4981 & 0.309786 \tabularnewline
25 & 0.04551 & 0.4436 & 0.329178 \tabularnewline
26 & -0.112973 & -1.1011 & 0.136812 \tabularnewline
27 & -0.119114 & -1.161 & 0.12428 \tabularnewline
28 & -0.137976 & -1.3448 & 0.090942 \tabularnewline
29 & -0.105627 & -1.0295 & 0.152923 \tabularnewline
30 & -0.06038 & -0.5885 & 0.278792 \tabularnewline
31 & -0.066599 & -0.6491 & 0.258911 \tabularnewline
32 & 0.033938 & 0.3308 & 0.370766 \tabularnewline
33 & 0.161704 & 1.5761 & 0.059165 \tabularnewline
34 & 0.142406 & 1.388 & 0.084191 \tabularnewline
35 & 0.05986 & 0.5834 & 0.280488 \tabularnewline
36 & -0.001588 & -0.0155 & 0.493842 \tabularnewline
37 & 0.003619 & 0.0353 & 0.485968 \tabularnewline
38 & -0.019127 & -0.1864 & 0.426252 \tabularnewline
39 & -0.072761 & -0.7092 & 0.239974 \tabularnewline
40 & 0.003536 & 0.0345 & 0.486288 \tabularnewline
41 & -0.006924 & -0.0675 & 0.473167 \tabularnewline
42 & 0.073838 & 0.7197 & 0.236744 \tabularnewline
43 & 0.079097 & 0.7709 & 0.221326 \tabularnewline
44 & 0.168719 & 1.6445 & 0.051692 \tabularnewline
45 & 0.065064 & 0.6342 & 0.26375 \tabularnewline
46 & -0.028765 & -0.2804 & 0.389904 \tabularnewline
47 & -0.076784 & -0.7484 & 0.228036 \tabularnewline
48 & -0.030993 & -0.3021 & 0.381626 \tabularnewline
\hline
\end{tabular}
%Source: https://freestatistics.org/blog/index.php?pk=277990&T=1

[TABLE]
[ROW][C]Autocorrelation Function[/C][/ROW]
[ROW][C]Time lag k[/C][C]ACF(k)[/C][C]T-STAT[/C][C]P-value[/C][/ROW]
[ROW][C]1[/C][C]0.483201[/C][C]4.7097[/C][C]4e-06[/C][/ROW]
[ROW][C]2[/C][C]0.285033[/C][C]2.7782[/C][C]0.003294[/C][/ROW]
[ROW][C]3[/C][C]0.023765[/C][C]0.2316[/C][C]0.408659[/C][/ROW]
[ROW][C]4[/C][C]-0.048681[/C][C]-0.4745[/C][C]0.318123[/C][/ROW]
[ROW][C]5[/C][C]-0.181346[/C][C]-1.7675[/C][C]0.040174[/C][/ROW]
[ROW][C]6[/C][C]-0.242246[/C][C]-2.3611[/C][C]0.010131[/C][/ROW]
[ROW][C]7[/C][C]-0.217225[/C][C]-2.1172[/C][C]0.018425[/C][/ROW]
[ROW][C]8[/C][C]-0.197722[/C][C]-1.9272[/C][C]0.028474[/C][/ROW]
[ROW][C]9[/C][C]-0.183087[/C][C]-1.7845[/C][C]0.038766[/C][/ROW]
[ROW][C]10[/C][C]-0.074525[/C][C]-0.7264[/C][C]0.234695[/C][/ROW]
[ROW][C]11[/C][C]0.023327[/C][C]0.2274[/C][C]0.410313[/C][/ROW]
[ROW][C]12[/C][C]2.2e-05[/C][C]2e-04[/C][C]0.499914[/C][/ROW]
[ROW][C]13[/C][C]-0.09822[/C][C]-0.9573[/C][C]0.170415[/C][/ROW]
[ROW][C]14[/C][C]-0.109229[/C][C]-1.0646[/C][C]0.14487[/C][/ROW]
[ROW][C]15[/C][C]-0.017227[/C][C]-0.1679[/C][C]0.433507[/C][/ROW]
[ROW][C]16[/C][C]-0.027996[/C][C]-0.2729[/C][C]0.392773[/C][/ROW]
[ROW][C]17[/C][C]-0.000766[/C][C]-0.0075[/C][C]0.497029[/C][/ROW]
[ROW][C]18[/C][C]-0.013754[/C][C]-0.1341[/C][C]0.44682[/C][/ROW]
[ROW][C]19[/C][C]0.044353[/C][C]0.4323[/C][C]0.333251[/C][/ROW]
[ROW][C]20[/C][C]-0.035799[/C][C]-0.3489[/C][C]0.363957[/C][/ROW]
[ROW][C]21[/C][C]0.061672[/C][C]0.6011[/C][C]0.274601[/C][/ROW]
[ROW][C]22[/C][C]0.088182[/C][C]0.8595[/C][C]0.196116[/C][/ROW]
[ROW][C]23[/C][C]0.097729[/C][C]0.9525[/C][C]0.17162[/C][/ROW]
[ROW][C]24[/C][C]-0.051103[/C][C]-0.4981[/C][C]0.309786[/C][/ROW]
[ROW][C]25[/C][C]0.04551[/C][C]0.4436[/C][C]0.329178[/C][/ROW]
[ROW][C]26[/C][C]-0.112973[/C][C]-1.1011[/C][C]0.136812[/C][/ROW]
[ROW][C]27[/C][C]-0.119114[/C][C]-1.161[/C][C]0.12428[/C][/ROW]
[ROW][C]28[/C][C]-0.137976[/C][C]-1.3448[/C][C]0.090942[/C][/ROW]
[ROW][C]29[/C][C]-0.105627[/C][C]-1.0295[/C][C]0.152923[/C][/ROW]
[ROW][C]30[/C][C]-0.06038[/C][C]-0.5885[/C][C]0.278792[/C][/ROW]
[ROW][C]31[/C][C]-0.066599[/C][C]-0.6491[/C][C]0.258911[/C][/ROW]
[ROW][C]32[/C][C]0.033938[/C][C]0.3308[/C][C]0.370766[/C][/ROW]
[ROW][C]33[/C][C]0.161704[/C][C]1.5761[/C][C]0.059165[/C][/ROW]
[ROW][C]34[/C][C]0.142406[/C][C]1.388[/C][C]0.084191[/C][/ROW]
[ROW][C]35[/C][C]0.05986[/C][C]0.5834[/C][C]0.280488[/C][/ROW]
[ROW][C]36[/C][C]-0.001588[/C][C]-0.0155[/C][C]0.493842[/C][/ROW]
[ROW][C]37[/C][C]0.003619[/C][C]0.0353[/C][C]0.485968[/C][/ROW]
[ROW][C]38[/C][C]-0.019127[/C][C]-0.1864[/C][C]0.426252[/C][/ROW]
[ROW][C]39[/C][C]-0.072761[/C][C]-0.7092[/C][C]0.239974[/C][/ROW]
[ROW][C]40[/C][C]0.003536[/C][C]0.0345[/C][C]0.486288[/C][/ROW]
[ROW][C]41[/C][C]-0.006924[/C][C]-0.0675[/C][C]0.473167[/C][/ROW]
[ROW][C]42[/C][C]0.073838[/C][C]0.7197[/C][C]0.236744[/C][/ROW]
[ROW][C]43[/C][C]0.079097[/C][C]0.7709[/C][C]0.221326[/C][/ROW]
[ROW][C]44[/C][C]0.168719[/C][C]1.6445[/C][C]0.051692[/C][/ROW]
[ROW][C]45[/C][C]0.065064[/C][C]0.6342[/C][C]0.26375[/C][/ROW]
[ROW][C]46[/C][C]-0.028765[/C][C]-0.2804[/C][C]0.389904[/C][/ROW]
[ROW][C]47[/C][C]-0.076784[/C][C]-0.7484[/C][C]0.228036[/C][/ROW]
[ROW][C]48[/C][C]-0.030993[/C][C]-0.3021[/C][C]0.381626[/C][/ROW]
[/TABLE]
Source: https://freestatistics.org/blog/index.php?pk=277990&T=1

Globally Unique Identifier (entire table): ba.freestatistics.org/blog/index.php?pk=277990&T=1

As an alternative you can also use a QR Code:  

The GUIDs for individual cells are displayed in the table below:

Autocorrelation Function
Time lag kACF(k)T-STATP-value
10.4832014.70974e-06
20.2850332.77820.003294
30.0237650.23160.408659
4-0.048681-0.47450.318123
5-0.181346-1.76750.040174
6-0.242246-2.36110.010131
7-0.217225-2.11720.018425
8-0.197722-1.92720.028474
9-0.183087-1.78450.038766
10-0.074525-0.72640.234695
110.0233270.22740.410313
122.2e-052e-040.499914
13-0.09822-0.95730.170415
14-0.109229-1.06460.14487
15-0.017227-0.16790.433507
16-0.027996-0.27290.392773
17-0.000766-0.00750.497029
18-0.013754-0.13410.44682
190.0443530.43230.333251
20-0.035799-0.34890.363957
210.0616720.60110.274601
220.0881820.85950.196116
230.0977290.95250.17162
24-0.051103-0.49810.309786
250.045510.44360.329178
26-0.112973-1.10110.136812
27-0.119114-1.1610.12428
28-0.137976-1.34480.090942
29-0.105627-1.02950.152923
30-0.06038-0.58850.278792
31-0.066599-0.64910.258911
320.0339380.33080.370766
330.1617041.57610.059165
340.1424061.3880.084191
350.059860.58340.280488
36-0.001588-0.01550.493842
370.0036190.03530.485968
38-0.019127-0.18640.426252
39-0.072761-0.70920.239974
400.0035360.03450.486288
41-0.006924-0.06750.473167
420.0738380.71970.236744
430.0790970.77090.221326
440.1687191.64450.051692
450.0650640.63420.26375
46-0.028765-0.28040.389904
47-0.076784-0.74840.228036
48-0.030993-0.30210.381626


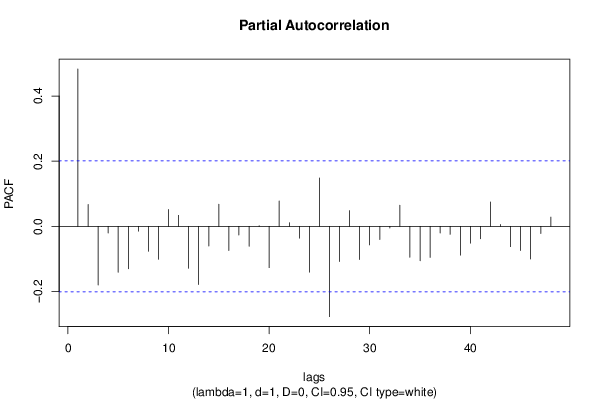
Partial Autocorrelation Function
Time lag kPACF(k)T-STATP-value
10.4832014.70974e-06
20.0672520.65550.256869
3-0.1798-1.75250.04146
4-0.020405-0.19890.421389
5-0.141144-1.37570.086075
6-0.130257-1.26960.103666
7-0.014684-0.14310.443248
8-0.076414-0.74480.229118
9-0.10095-0.98390.163823
100.0519130.5060.307018
110.0338640.33010.371037
12-0.128737-1.25480.10632
13-0.178517-1.740.042551
14-0.060157-0.58630.279518
150.0678340.66120.255053
16-0.073993-0.72120.236279
17-0.026343-0.25680.398958
18-0.06123-0.59680.27603
190.0017810.01740.493094
20-0.126618-1.23410.110102
210.0778350.75860.224972
220.0112360.10950.456514
23-0.036157-0.35240.362655
24-0.14049-1.36930.087062
250.1483251.44570.075777
26-0.277157-2.70140.004089
27-0.107962-1.05230.147669
280.0483820.47160.319158
29-0.101827-0.99250.16174
30-0.056794-0.55360.290592
31-0.040328-0.39310.347574
32-0.004984-0.04860.480678
330.0647230.63080.264829
34-0.095077-0.92670.178216
35-0.105711-1.03030.152733
36-0.095287-0.92870.177688
37-0.020618-0.2010.42058
38-0.024532-0.23910.405768
39-0.088291-0.86060.195826
40-0.051553-0.50250.308247
41-0.038178-0.37210.355319
420.074760.72870.233999
430.0057810.05630.477593
44-0.062207-0.60630.272875
45-0.074162-0.72280.235776
46-0.100152-0.97620.165733
47-0.021842-0.21290.415933
480.028380.27660.39134

\begin{tabular}{lllllllll}
\hline
Partial Autocorrelation Function \tabularnewline
Time lag k & PACF(k) & T-STAT & P-value \tabularnewline
1 & 0.483201 & 4.7097 & 4e-06 \tabularnewline
2 & 0.067252 & 0.6555 & 0.256869 \tabularnewline
3 & -0.1798 & -1.7525 & 0.04146 \tabularnewline
4 & -0.020405 & -0.1989 & 0.421389 \tabularnewline
5 & -0.141144 & -1.3757 & 0.086075 \tabularnewline
6 & -0.130257 & -1.2696 & 0.103666 \tabularnewline
7 & -0.014684 & -0.1431 & 0.443248 \tabularnewline
8 & -0.076414 & -0.7448 & 0.229118 \tabularnewline
9 & -0.10095 & -0.9839 & 0.163823 \tabularnewline
10 & 0.051913 & 0.506 & 0.307018 \tabularnewline
11 & 0.033864 & 0.3301 & 0.371037 \tabularnewline
12 & -0.128737 & -1.2548 & 0.10632 \tabularnewline
13 & -0.178517 & -1.74 & 0.042551 \tabularnewline
14 & -0.060157 & -0.5863 & 0.279518 \tabularnewline
15 & 0.067834 & 0.6612 & 0.255053 \tabularnewline
16 & -0.073993 & -0.7212 & 0.236279 \tabularnewline
17 & -0.026343 & -0.2568 & 0.398958 \tabularnewline
18 & -0.06123 & -0.5968 & 0.27603 \tabularnewline
19 & 0.001781 & 0.0174 & 0.493094 \tabularnewline
20 & -0.126618 & -1.2341 & 0.110102 \tabularnewline
21 & 0.077835 & 0.7586 & 0.224972 \tabularnewline
22 & 0.011236 & 0.1095 & 0.456514 \tabularnewline
23 & -0.036157 & -0.3524 & 0.362655 \tabularnewline
24 & -0.14049 & -1.3693 & 0.087062 \tabularnewline
25 & 0.148325 & 1.4457 & 0.075777 \tabularnewline
26 & -0.277157 & -2.7014 & 0.004089 \tabularnewline
27 & -0.107962 & -1.0523 & 0.147669 \tabularnewline
28 & 0.048382 & 0.4716 & 0.319158 \tabularnewline
29 & -0.101827 & -0.9925 & 0.16174 \tabularnewline
30 & -0.056794 & -0.5536 & 0.290592 \tabularnewline
31 & -0.040328 & -0.3931 & 0.347574 \tabularnewline
32 & -0.004984 & -0.0486 & 0.480678 \tabularnewline
33 & 0.064723 & 0.6308 & 0.264829 \tabularnewline
34 & -0.095077 & -0.9267 & 0.178216 \tabularnewline
35 & -0.105711 & -1.0303 & 0.152733 \tabularnewline
36 & -0.095287 & -0.9287 & 0.177688 \tabularnewline
37 & -0.020618 & -0.201 & 0.42058 \tabularnewline
38 & -0.024532 & -0.2391 & 0.405768 \tabularnewline
39 & -0.088291 & -0.8606 & 0.195826 \tabularnewline
40 & -0.051553 & -0.5025 & 0.308247 \tabularnewline
41 & -0.038178 & -0.3721 & 0.355319 \tabularnewline
42 & 0.07476 & 0.7287 & 0.233999 \tabularnewline
43 & 0.005781 & 0.0563 & 0.477593 \tabularnewline
44 & -0.062207 & -0.6063 & 0.272875 \tabularnewline
45 & -0.074162 & -0.7228 & 0.235776 \tabularnewline
46 & -0.100152 & -0.9762 & 0.165733 \tabularnewline
47 & -0.021842 & -0.2129 & 0.415933 \tabularnewline
48 & 0.02838 & 0.2766 & 0.39134 \tabularnewline
\hline
\end{tabular}
%Source: https://freestatistics.org/blog/index.php?pk=277990&T=2

[TABLE]
[ROW][C]Partial Autocorrelation Function[/C][/ROW]
[ROW][C]Time lag k[/C][C]PACF(k)[/C][C]T-STAT[/C][C]P-value[/C][/ROW]
[ROW][C]1[/C][C]0.483201[/C][C]4.7097[/C][C]4e-06[/C][/ROW]
[ROW][C]2[/C][C]0.067252[/C][C]0.6555[/C][C]0.256869[/C][/ROW]
[ROW][C]3[/C][C]-0.1798[/C][C]-1.7525[/C][C]0.04146[/C][/ROW]
[ROW][C]4[/C][C]-0.020405[/C][C]-0.1989[/C][C]0.421389[/C][/ROW]
[ROW][C]5[/C][C]-0.141144[/C][C]-1.3757[/C][C]0.086075[/C][/ROW]
[ROW][C]6[/C][C]-0.130257[/C][C]-1.2696[/C][C]0.103666[/C][/ROW]
[ROW][C]7[/C][C]-0.014684[/C][C]-0.1431[/C][C]0.443248[/C][/ROW]
[ROW][C]8[/C][C]-0.076414[/C][C]-0.7448[/C][C]0.229118[/C][/ROW]
[ROW][C]9[/C][C]-0.10095[/C][C]-0.9839[/C][C]0.163823[/C][/ROW]
[ROW][C]10[/C][C]0.051913[/C][C]0.506[/C][C]0.307018[/C][/ROW]
[ROW][C]11[/C][C]0.033864[/C][C]0.3301[/C][C]0.371037[/C][/ROW]
[ROW][C]12[/C][C]-0.128737[/C][C]-1.2548[/C][C]0.10632[/C][/ROW]
[ROW][C]13[/C][C]-0.178517[/C][C]-1.74[/C][C]0.042551[/C][/ROW]
[ROW][C]14[/C][C]-0.060157[/C][C]-0.5863[/C][C]0.279518[/C][/ROW]
[ROW][C]15[/C][C]0.067834[/C][C]0.6612[/C][C]0.255053[/C][/ROW]
[ROW][C]16[/C][C]-0.073993[/C][C]-0.7212[/C][C]0.236279[/C][/ROW]
[ROW][C]17[/C][C]-0.026343[/C][C]-0.2568[/C][C]0.398958[/C][/ROW]
[ROW][C]18[/C][C]-0.06123[/C][C]-0.5968[/C][C]0.27603[/C][/ROW]
[ROW][C]19[/C][C]0.001781[/C][C]0.0174[/C][C]0.493094[/C][/ROW]
[ROW][C]20[/C][C]-0.126618[/C][C]-1.2341[/C][C]0.110102[/C][/ROW]
[ROW][C]21[/C][C]0.077835[/C][C]0.7586[/C][C]0.224972[/C][/ROW]
[ROW][C]22[/C][C]0.011236[/C][C]0.1095[/C][C]0.456514[/C][/ROW]
[ROW][C]23[/C][C]-0.036157[/C][C]-0.3524[/C][C]0.362655[/C][/ROW]
[ROW][C]24[/C][C]-0.14049[/C][C]-1.3693[/C][C]0.087062[/C][/ROW]
[ROW][C]25[/C][C]0.148325[/C][C]1.4457[/C][C]0.075777[/C][/ROW]
[ROW][C]26[/C][C]-0.277157[/C][C]-2.7014[/C][C]0.004089[/C][/ROW]
[ROW][C]27[/C][C]-0.107962[/C][C]-1.0523[/C][C]0.147669[/C][/ROW]
[ROW][C]28[/C][C]0.048382[/C][C]0.4716[/C][C]0.319158[/C][/ROW]
[ROW][C]29[/C][C]-0.101827[/C][C]-0.9925[/C][C]0.16174[/C][/ROW]
[ROW][C]30[/C][C]-0.056794[/C][C]-0.5536[/C][C]0.290592[/C][/ROW]
[ROW][C]31[/C][C]-0.040328[/C][C]-0.3931[/C][C]0.347574[/C][/ROW]
[ROW][C]32[/C][C]-0.004984[/C][C]-0.0486[/C][C]0.480678[/C][/ROW]
[ROW][C]33[/C][C]0.064723[/C][C]0.6308[/C][C]0.264829[/C][/ROW]
[ROW][C]34[/C][C]-0.095077[/C][C]-0.9267[/C][C]0.178216[/C][/ROW]
[ROW][C]35[/C][C]-0.105711[/C][C]-1.0303[/C][C]0.152733[/C][/ROW]
[ROW][C]36[/C][C]-0.095287[/C][C]-0.9287[/C][C]0.177688[/C][/ROW]
[ROW][C]37[/C][C]-0.020618[/C][C]-0.201[/C][C]0.42058[/C][/ROW]
[ROW][C]38[/C][C]-0.024532[/C][C]-0.2391[/C][C]0.405768[/C][/ROW]
[ROW][C]39[/C][C]-0.088291[/C][C]-0.8606[/C][C]0.195826[/C][/ROW]
[ROW][C]40[/C][C]-0.051553[/C][C]-0.5025[/C][C]0.308247[/C][/ROW]
[ROW][C]41[/C][C]-0.038178[/C][C]-0.3721[/C][C]0.355319[/C][/ROW]
[ROW][C]42[/C][C]0.07476[/C][C]0.7287[/C][C]0.233999[/C][/ROW]
[ROW][C]43[/C][C]0.005781[/C][C]0.0563[/C][C]0.477593[/C][/ROW]
[ROW][C]44[/C][C]-0.062207[/C][C]-0.6063[/C][C]0.272875[/C][/ROW]
[ROW][C]45[/C][C]-0.074162[/C][C]-0.7228[/C][C]0.235776[/C][/ROW]
[ROW][C]46[/C][C]-0.100152[/C][C]-0.9762[/C][C]0.165733[/C][/ROW]
[ROW][C]47[/C][C]-0.021842[/C][C]-0.2129[/C][C]0.415933[/C][/ROW]
[ROW][C]48[/C][C]0.02838[/C][C]0.2766[/C][C]0.39134[/C][/ROW]
[/TABLE]
Source: https://freestatistics.org/blog/index.php?pk=277990&T=2

Globally Unique Identifier (entire table): ba.freestatistics.org/blog/index.php?pk=277990&T=2

As an alternative you can also use a QR Code:  

The GUIDs for individual cells are displayed in the table below:

Partial Autocorrelation Function
Time lag kPACF(k)T-STATP-value
10.4832014.70974e-06
20.0672520.65550.256869
3-0.1798-1.75250.04146
4-0.020405-0.19890.421389
5-0.141144-1.37570.086075
6-0.130257-1.26960.103666
7-0.014684-0.14310.443248
8-0.076414-0.74480.229118
9-0.10095-0.98390.163823
100.0519130.5060.307018
110.0338640.33010.371037
12-0.128737-1.25480.10632
13-0.178517-1.740.042551
14-0.060157-0.58630.279518
150.0678340.66120.255053
16-0.073993-0.72120.236279
17-0.026343-0.25680.398958
18-0.06123-0.59680.27603
190.0017810.01740.493094
20-0.126618-1.23410.110102
210.0778350.75860.224972
220.0112360.10950.456514
23-0.036157-0.35240.362655
24-0.14049-1.36930.087062
250.1483251.44570.075777
26-0.277157-2.70140.004089
27-0.107962-1.05230.147669
280.0483820.47160.319158
29-0.101827-0.99250.16174
30-0.056794-0.55360.290592
31-0.040328-0.39310.347574
32-0.004984-0.04860.480678
330.0647230.63080.264829
34-0.095077-0.92670.178216
35-0.105711-1.03030.152733
36-0.095287-0.92870.177688
37-0.020618-0.2010.42058
38-0.024532-0.23910.405768
39-0.088291-0.86060.195826
40-0.051553-0.50250.308247
41-0.038178-0.37210.355319
420.074760.72870.233999
430.0057810.05630.477593
44-0.062207-0.60630.272875
45-0.074162-0.72280.235776
46-0.100152-0.97620.165733
47-0.021842-0.21290.415933
480.028380.27660.39134


Parameters (Session):
par1 = 48 ; par2 = 1 ; par3 = 1 ; par4 = 0 ; par5 = 12 ; par6 = White Noise ; par7 = 0.95 ;
Parameters (R input):
par1 = 48 ; par2 = 1 ; par3 = 1 ; par4 = 0 ; par5 = 12 ; par6 = White Noise ; par7 = 0.95 ; par8 = ;
R code (references can be found in the software module):
if (par1 == 'Default') {
par1 = 10*log10(length(x))
} else {
par1 <- as.numeric(par1)
}
par2 <- as.numeric(par2)
par3 <- as.numeric(par3)
par4 <- as.numeric(par4)
par5 <- as.numeric(par5)
if (par6 == 'White Noise') par6 <- 'white' else par6 <- 'ma'
par7 <- as.numeric(par7)
if (par8 != '') par8 <- as.numeric(par8)
ox <- x
if (par8 == '') {
if (par2 == 0) {
x <- log(x)
} else {
x <- (x ^ par2 - 1) / par2
}
} else {
x <- log(x,base=par8)
}
if (par3 > 0) x <- diff(x,lag=1,difference=par3)
if (par4 > 0) x <- diff(x,lag=par5,difference=par4)
bitmap(file='picts.png')
op <- par(mfrow=c(2,1))
plot(ox,type='l',main='Original Time Series',xlab='time',ylab='value')
if (par8=='') {
mytitle <- paste('Working Time Series (lambda=',par2,', d=',par3,', D=',par4,')',sep='')
mysub <- paste('(lambda=',par2,', d=',par3,', D=',par4,', CI=', par7, ', CI type=',par6,')',sep='')
} else {
mytitle <- paste('Working Time Series (base=',par8,', d=',par3,', D=',par4,')',sep='')
mysub <- paste('(base=',par8,', d=',par3,', D=',par4,', CI=', par7, ', CI type=',par6,')',sep='')
}
plot(x,type='l', main=mytitle,xlab='time',ylab='value')
par(op)
dev.off()
bitmap(file='pic1.png')
racf <- acf(x, par1, main='Autocorrelation', xlab='time lag', ylab='ACF', ci.type=par6, ci=par7, sub=mysub)
dev.off()
bitmap(file='pic2.png')
rpacf <- pacf(x,par1,main='Partial Autocorrelation',xlab='lags',ylab='PACF',sub=mysub)
dev.off()
(myacf <- c(racf$acf))
(mypacf <- c(rpacf$acf))
lengthx <- length(x)
sqrtn <- sqrt(lengthx)
load(file='createtable')
a<-table.start()
a<-table.row.start(a)
a<-table.element(a,'Autocorrelation Function',4,TRUE)
a<-table.row.end(a)
a<-table.row.start(a)
a<-table.element(a,'Time lag k',header=TRUE)
a<-table.element(a,hyperlink('basics.htm','ACF(k)','click here for more information about the Autocorrelation Function'),header=TRUE)
a<-table.element(a,'T-STAT',header=TRUE)
a<-table.element(a,'P-value',header=TRUE)
a<-table.row.end(a)
for (i in 2:(par1+1)) {
a<-table.row.start(a)
a<-table.element(a,i-1,header=TRUE)
a<-table.element(a,round(myacf[i],6))
mytstat <- myacf[i]*sqrtn
a<-table.element(a,round(mytstat,4))
a<-table.element(a,round(1-pt(abs(mytstat),lengthx),6))
a<-table.row.end(a)
}
a<-table.end(a)
table.save(a,file='mytable.tab')
a<-table.start()
a<-table.row.start(a)
a<-table.element(a,'Partial Autocorrelation Function',4,TRUE)
a<-table.row.end(a)
a<-table.row.start(a)
a<-table.element(a,'Time lag k',header=TRUE)
a<-table.element(a,hyperlink('basics.htm','PACF(k)','click here for more information about the Partial Autocorrelation Function'),header=TRUE)
a<-table.element(a,'T-STAT',header=TRUE)
a<-table.element(a,'P-value',header=TRUE)
a<-table.row.end(a)
for (i in 1:par1) {
a<-table.row.start(a)
a<-table.element(a,i,header=TRUE)
a<-table.element(a,round(mypacf[i],6))
mytstat <- mypacf[i]*sqrtn
a<-table.element(a,round(mytstat,4))
a<-table.element(a,round(1-pt(abs(mytstat),lengthx),6))
a<-table.row.end(a)
}
a<-table.end(a)
table.save(a,file='mytable1.tab')