Free Statistics

of Irreproducible Research!

Author's title

Author*Unverified author*
R Software Modulerwasp_bootstrapplot.wasp
Title produced by softwareBlocked Bootstrap Plot - Central Tendency
Date of computationWed, 20 May 2015 19:35:54 +0100
Cite this page as followsStatistical Computations at FreeStatistics.org, Office for Research Development and Education, URL https://freestatistics.org/blog/index.php?v=date/2015/May/20/t14321469841dk8s009yw2fh83.htm/, Retrieved Sun, 28 Apr 2024 23:30:59 +0000
Statistical Computations at FreeStatistics.org, Office for Research Development and Education, URL https://freestatistics.org/blog/index.php?pk=279177, Retrieved Sun, 28 Apr 2024 23:30:59 +0000
QR Codes:

Original text written by user:
IsPrivate?No (this computation is public)
User-defined keywords
Estimated Impact124
Family? (F = Feedback message, R = changed R code, M = changed R Module, P = changed Parameters, D = changed Data)
-       [Blocked Bootstrap Plot - Central Tendency] [] [2015-05-20 18:35:54] [48df267a82852137cd18322add6deebf] [Current]
Feedback Forum

Post a new message
Dataseries X:
5119676
4737614
5425255
5195396
5779583
6298652
6175944
6217653
6086619
5060250
3950207
3096398
3287215
2970037
3436547
3339099
3661160
3675026
3917675
3942501
3848079
3993974
3977059
4406890
4827736
4507189
5249062
5009908
5195771
5079423
5531062
5109363
4773753
5347125
5379543
6114549
6346091
5900935
7265533
6115096
7062343
7027841
6644644
7359822
7192534
7065705
7788175
6934803
7492202
8478866
8748316
8382956
8414863
7501787
8031203
9198243
8500998
9260617
9494903
8791918
8568871
8570003
8066695
7800532
8136832
7713840
7986953
7479868
7917564
8055845
7490221
7648110


Summary of computational transaction
Raw Inputview raw input (R code)
Raw Outputview raw output of R engine
Computing time3 seconds
R Server'Sir Maurice George Kendall' @ kendall.wessa.net

\begin{tabular}{lllllllll}
\hline
Summary of computational transaction \tabularnewline
Raw Input & view raw input (R code)  \tabularnewline
Raw Output & view raw output of R engine  \tabularnewline
Computing time & 3 seconds \tabularnewline
R Server & 'Sir Maurice George Kendall' @ kendall.wessa.net \tabularnewline
\hline
\end{tabular}
%Source: https://freestatistics.org/blog/index.php?pk=279177&T=0

[TABLE]
[ROW][C]Summary of computational transaction[/C][/ROW]
[ROW][C]Raw Input[/C][C]view raw input (R code) [/C][/ROW]
[ROW][C]Raw Output[/C][C]view raw output of R engine [/C][/ROW]
[ROW][C]Computing time[/C][C]3 seconds[/C][/ROW]
[ROW][C]R Server[/C][C]'Sir Maurice George Kendall' @ kendall.wessa.net[/C][/ROW]
[/TABLE]
Source: https://freestatistics.org/blog/index.php?pk=279177&T=0

Globally Unique Identifier (entire table): ba.freestatistics.org/blog/index.php?pk=279177&T=0

As an alternative you can also use a QR Code:  

The GUIDs for individual cells are displayed in the table below:

Summary of computational transaction
Raw Inputview raw input (R code)
Raw Outputview raw output of R engine
Computing time3 seconds
R Server'Sir Maurice George Kendall' @ kendall.wessa.net


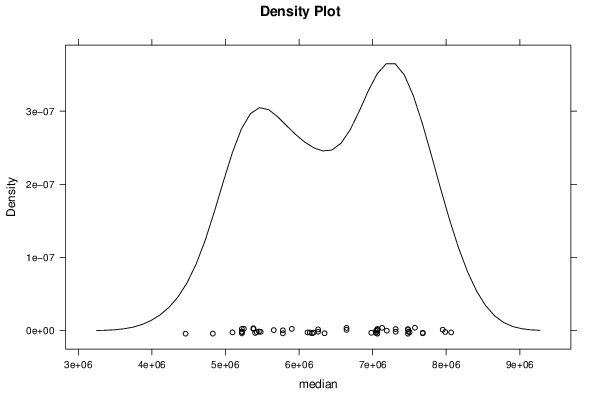
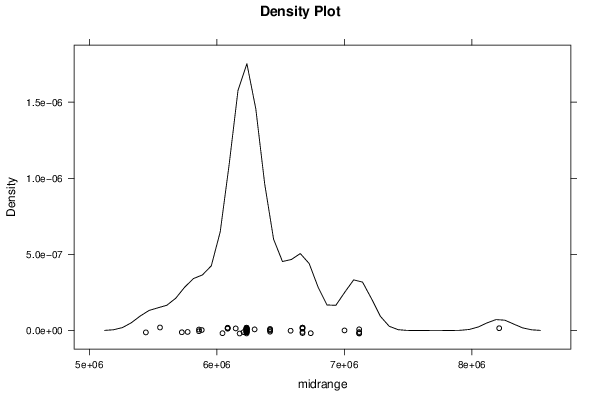
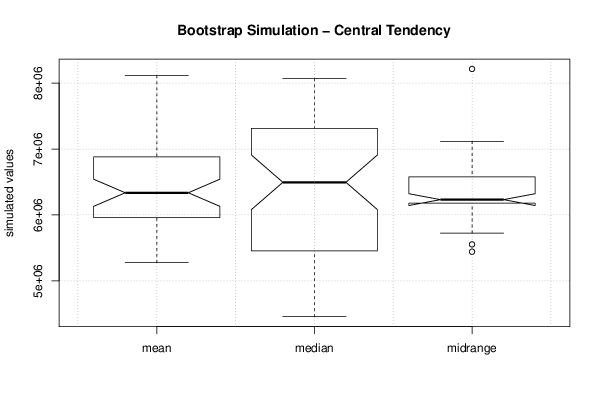
Estimation Results of Blocked Bootstrap
statisticQ1EstimateQ3S.D.IQR
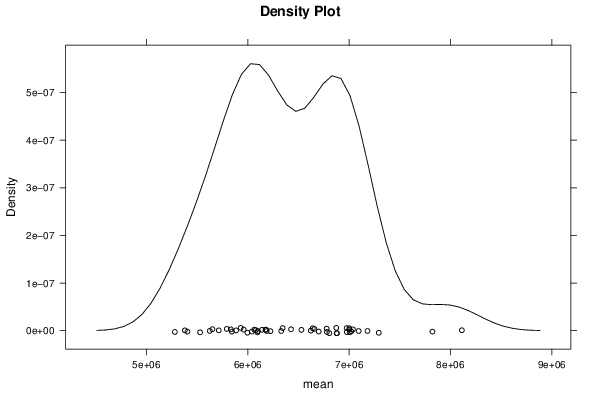
mean5968655.791666676252204.458333336878774.48263889624253.39203195910118.690972221
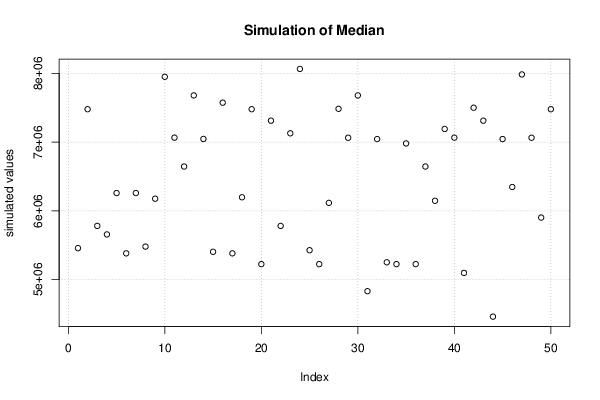
median5461016.56196798.57282641.625978032.9966818531821625.125
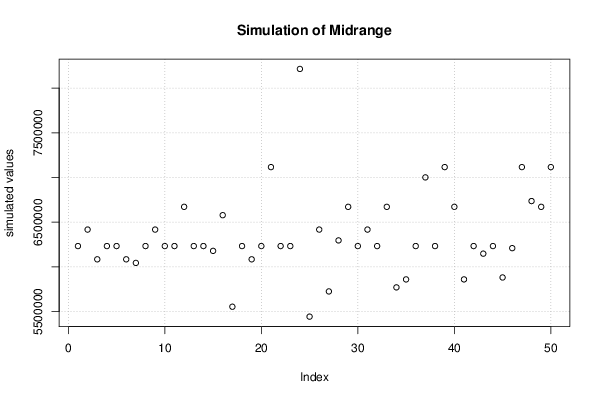
midrange6186140.87562324706537773.875463383.662972306351633

\begin{tabular}{lllllllll}
\hline
Estimation Results of Blocked Bootstrap \tabularnewline
statistic & Q1 & Estimate & Q3 & S.D. & IQR \tabularnewline
mean & 5968655.79166667 & 6252204.45833333 & 6878774.48263889 & 624253.39203195 & 910118.690972221 \tabularnewline
median & 5461016.5 & 6196798.5 & 7282641.625 & 978032.996681853 & 1821625.125 \tabularnewline
midrange & 6186140.875 & 6232470 & 6537773.875 & 463383.662972306 & 351633 \tabularnewline
\hline
\end{tabular}
%Source: https://freestatistics.org/blog/index.php?pk=279177&T=1

[TABLE]
[ROW][C]Estimation Results of Blocked Bootstrap[/C][/ROW]
[ROW][C]statistic[/C][C]Q1[/C][C]Estimate[/C][C]Q3[/C][C]S.D.[/C][C]IQR[/C][/ROW]
[ROW][C]mean[/C][C]5968655.79166667[/C][C]6252204.45833333[/C][C]6878774.48263889[/C][C]624253.39203195[/C][C]910118.690972221[/C][/ROW]
[ROW][C]median[/C][C]5461016.5[/C][C]6196798.5[/C][C]7282641.625[/C][C]978032.996681853[/C][C]1821625.125[/C][/ROW]
[ROW][C]midrange[/C][C]6186140.875[/C][C]6232470[/C][C]6537773.875[/C][C]463383.662972306[/C][C]351633[/C][/ROW]
[/TABLE]
Source: https://freestatistics.org/blog/index.php?pk=279177&T=1

Globally Unique Identifier (entire table): ba.freestatistics.org/blog/index.php?pk=279177&T=1

As an alternative you can also use a QR Code:  

The GUIDs for individual cells are displayed in the table below:

Estimation Results of Blocked Bootstrap
statisticQ1EstimateQ3S.D.IQR
mean5968655.791666676252204.458333336878774.48263889624253.39203195910118.690972221
median5461016.56196798.57282641.625978032.9966818531821625.125
midrange6186140.87562324706537773.875463383.662972306351633


Parameters (Session):
par1 = 50 ; par2 = 12 ;
Parameters (R input):
par1 = 50 ; par2 = 12 ;
R code (references can be found in the software module):
par2 <- '12'
par1 <- '50'
par1 <- as.numeric(par1)
par2 <- as.numeric(par2)
if (par1 < 10) par1 = 10
if (par1 > 5000) par1 = 5000
if (par2 < 3) par2 = 3
if (par2 > length(x)) par2 = length(x)
library(lattice)
library(boot)
boot.stat <- function(s)
{
s.mean <- mean(s)
s.median <- median(s)
s.midrange <- (max(s) + min(s)) / 2
c(s.mean, s.median, s.midrange)
}
(r <- tsboot(x, boot.stat, R=par1, l=12, sim='fixed'))
bitmap(file='plot1.png')
plot(r$t[,1],type='p',ylab='simulated values',main='Simulation of Mean')
grid()
dev.off()
bitmap(file='plot2.png')
plot(r$t[,2],type='p',ylab='simulated values',main='Simulation of Median')
grid()
dev.off()
bitmap(file='plot3.png')
plot(r$t[,3],type='p',ylab='simulated values',main='Simulation of Midrange')
grid()
dev.off()
bitmap(file='plot4.png')
densityplot(~r$t[,1],col='black',main='Density Plot',xlab='mean')
dev.off()
bitmap(file='plot5.png')
densityplot(~r$t[,2],col='black',main='Density Plot',xlab='median')
dev.off()
bitmap(file='plot6.png')
densityplot(~r$t[,3],col='black',main='Density Plot',xlab='midrange')
dev.off()
z <- data.frame(cbind(r$t[,1],r$t[,2],r$t[,3]))
colnames(z) <- list('mean','median','midrange')
bitmap(file='plot7.png')
boxplot(z,notch=TRUE,ylab='simulated values',main='Bootstrap Simulation - Central Tendency')
grid()
dev.off()
load(file='createtable')
a<-table.start()
a<-table.row.start(a)
a<-table.element(a,'Estimation Results of Blocked Bootstrap',6,TRUE)
a<-table.row.end(a)
a<-table.row.start(a)
a<-table.element(a,'statistic',header=TRUE)
a<-table.element(a,'Q1',header=TRUE)
a<-table.element(a,'Estimate',header=TRUE)
a<-table.element(a,'Q3',header=TRUE)
a<-table.element(a,'S.D.',header=TRUE)
a<-table.element(a,'IQR',header=TRUE)
a<-table.row.end(a)
a<-table.row.start(a)
a<-table.element(a,'mean',header=TRUE)
q1 <- quantile(r$t[,1],0.25)[[1]]
q3 <- quantile(r$t[,1],0.75)[[1]]
a<-table.element(a,q1)
a<-table.element(a,r$t0[1])
a<-table.element(a,q3)
a<-table.element(a,sqrt(var(r$t[,1])))
a<-table.element(a,q3-q1)
a<-table.row.end(a)
a<-table.row.start(a)
a<-table.element(a,'median',header=TRUE)
q1 <- quantile(r$t[,2],0.25)[[1]]
q3 <- quantile(r$t[,2],0.75)[[1]]
a<-table.element(a,q1)
a<-table.element(a,r$t0[2])
a<-table.element(a,q3)
a<-table.element(a,sqrt(var(r$t[,2])))
a<-table.element(a,q3-q1)
a<-table.row.end(a)
a<-table.row.start(a)
a<-table.element(a,'midrange',header=TRUE)
q1 <- quantile(r$t[,3],0.25)[[1]]
q3 <- quantile(r$t[,3],0.75)[[1]]
a<-table.element(a,q1)
a<-table.element(a,r$t0[3])
a<-table.element(a,q3)
a<-table.element(a,sqrt(var(r$t[,3])))
a<-table.element(a,q3-q1)
a<-table.row.end(a)
a<-table.end(a)
table.save(a,file='mytable.tab')