Free Statistics

of Irreproducible Research!

Author's title

Author*Unverified author*
R Software Modulerwasp_autocorrelation.wasp
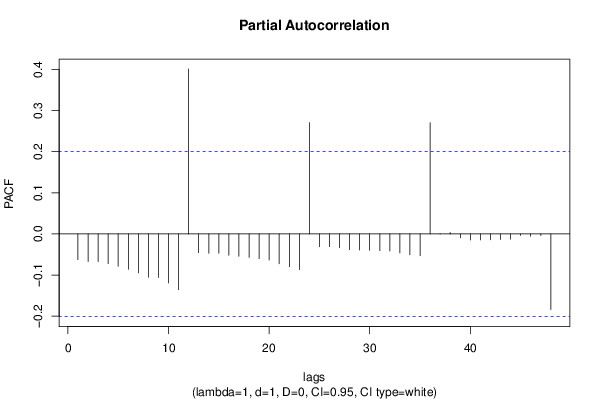
Title produced by software(Partial) Autocorrelation Function
Date of computationThu, 21 May 2015 23:14:31 +0100
Cite this page as followsStatistical Computations at FreeStatistics.org, Office for Research Development and Education, URL https://freestatistics.org/blog/index.php?v=date/2015/May/21/t1432247148yfgzrh86jkru3gz.htm/, Retrieved Sat, 04 May 2024 09:36:57 +0000
Statistical Computations at FreeStatistics.org, Office for Research Development and Education, URL https://freestatistics.org/blog/index.php?pk=279210, Retrieved Sat, 04 May 2024 09:36:57 +0000
QR Codes:

Original text written by user:
IsPrivate?No (this computation is public)
User-defined keywords
Estimated Impact136
Family? (F = Feedback message, R = changed R code, M = changed R Module, P = changed Parameters, D = changed Data)
-       [(Partial) Autocorrelation Function] [] [2015-05-21 22:14:31] [36d9fcfacb97c24df6a506fb08c7a09a] [Current]
Feedback Forum

Post a new message
Dataseries X:
599
599
599
599
599
599
599
599
599
617.06
617.06
617.06
617.06
617.06
617.06
617.06
617.06
617.06
617.06
617.06
617.06
628.18
628.18
628.18
628.18
628.18
628.18
628.18
628.18
628.18
628.18
628.18
628.18
641.08
641.08
641.08
641.08
641.08
641.08
641.08
641.08
641.08
641.08
641.08
641.08
668.21
668.21
668.21
668.21
668.21
668.21
668.21
668.21
668.21
668.21
668.21
668.21
665.27
665.27
665.27
665.27
665.27
665.27
665.27
665.27
665.27
665.27
665.27
665.27
674.3
674.3
674.3
674.3
674.3
674.3
674.3
674.3
674.3
674.3
674.3
674.3
685.34
685.34
685.34
685.34
685.34
685.34
685.34
685.34
685.34
685.34
685.34
685.34
694.3
694.3
694.3


Summary of computational transaction
Raw Inputview raw input (R code)
Raw Outputview raw output of R engine
Computing time2 seconds
R Server'George Udny Yule' @ yule.wessa.net

\begin{tabular}{lllllllll}
\hline
Summary of computational transaction \tabularnewline
Raw Input & view raw input (R code)  \tabularnewline
Raw Output & view raw output of R engine  \tabularnewline
Computing time & 2 seconds \tabularnewline
R Server & 'George Udny Yule' @ yule.wessa.net \tabularnewline
\hline
\end{tabular}
%Source: https://freestatistics.org/blog/index.php?pk=279210&T=0

[TABLE]
[ROW][C]Summary of computational transaction[/C][/ROW]
[ROW][C]Raw Input[/C][C]view raw input (R code) [/C][/ROW]
[ROW][C]Raw Output[/C][C]view raw output of R engine [/C][/ROW]
[ROW][C]Computing time[/C][C]2 seconds[/C][/ROW]
[ROW][C]R Server[/C][C]'George Udny Yule' @ yule.wessa.net[/C][/ROW]
[/TABLE]
Source: https://freestatistics.org/blog/index.php?pk=279210&T=0

Globally Unique Identifier (entire table): ba.freestatistics.org/blog/index.php?pk=279210&T=0

As an alternative you can also use a QR Code:  

The GUIDs for individual cells are displayed in the table below:

Summary of computational transaction
Raw Inputview raw input (R code)
Raw Outputview raw output of R engine
Computing time2 seconds
R Server'George Udny Yule' @ yule.wessa.net


Autocorrelation Function
Time lag kACF(k)T-STATP-value
1-0.062367-0.60790.272359
2-0.063017-0.61420.270272
3-0.057864-0.5640.287046
4-0.058513-0.57030.284904
5-0.059163-0.57670.28277
6-0.059813-0.5830.280643
7-0.060462-0.58930.278525
8-0.061112-0.59560.276414
9-0.050066-0.4880.313344
10-0.050715-0.49430.311113
11-0.051365-0.50060.308889
120.4557614.44221.2e-05
13-0.052664-0.51330.304463
14-0.053314-0.51960.302261
15-0.046814-0.45630.324612
16-0.047464-0.46260.322347
17-0.048113-0.4690.320089
18-0.048763-0.47530.317838
19-0.049413-0.48160.315593
20-0.050062-0.48790.313355
21-0.043511-0.42410.33623
22-0.04416-0.43040.333932
23-0.04481-0.43680.331641
240.4646524.52899e-06
25-0.046109-0.44940.327077
26-0.046759-0.45570.324805
27-0.041561-0.40510.343164
28-0.04221-0.41140.340847
29-0.04286-0.41770.338537
30-0.04351-0.42410.336233
31-0.044159-0.43040.333936
32-0.044809-0.43670.331644
33-0.037104-0.36160.359209
34-0.037754-0.3680.356853
35-0.038404-0.37430.354503
360.5077054.94852e-06
37-0.039703-0.3870.349819
38-0.040353-0.39330.347486
39-0.042906-0.41820.338373
40-0.043556-0.42450.336069
41-0.044206-0.43090.333772
42-0.044855-0.43720.331481
43-0.045505-0.44350.329196
44-0.046155-0.44990.326918
45-0.029235-0.28490.388154
46-0.029884-0.29130.385738
47-0.030534-0.29760.383326
480.2482322.41950.008723

\begin{tabular}{lllllllll}
\hline
Autocorrelation Function \tabularnewline
Time lag k & ACF(k) & T-STAT & P-value \tabularnewline
1 & -0.062367 & -0.6079 & 0.272359 \tabularnewline
2 & -0.063017 & -0.6142 & 0.270272 \tabularnewline
3 & -0.057864 & -0.564 & 0.287046 \tabularnewline
4 & -0.058513 & -0.5703 & 0.284904 \tabularnewline
5 & -0.059163 & -0.5767 & 0.28277 \tabularnewline
6 & -0.059813 & -0.583 & 0.280643 \tabularnewline
7 & -0.060462 & -0.5893 & 0.278525 \tabularnewline
8 & -0.061112 & -0.5956 & 0.276414 \tabularnewline
9 & -0.050066 & -0.488 & 0.313344 \tabularnewline
10 & -0.050715 & -0.4943 & 0.311113 \tabularnewline
11 & -0.051365 & -0.5006 & 0.308889 \tabularnewline
12 & 0.455761 & 4.4422 & 1.2e-05 \tabularnewline
13 & -0.052664 & -0.5133 & 0.304463 \tabularnewline
14 & -0.053314 & -0.5196 & 0.302261 \tabularnewline
15 & -0.046814 & -0.4563 & 0.324612 \tabularnewline
16 & -0.047464 & -0.4626 & 0.322347 \tabularnewline
17 & -0.048113 & -0.469 & 0.320089 \tabularnewline
18 & -0.048763 & -0.4753 & 0.317838 \tabularnewline
19 & -0.049413 & -0.4816 & 0.315593 \tabularnewline
20 & -0.050062 & -0.4879 & 0.313355 \tabularnewline
21 & -0.043511 & -0.4241 & 0.33623 \tabularnewline
22 & -0.04416 & -0.4304 & 0.333932 \tabularnewline
23 & -0.04481 & -0.4368 & 0.331641 \tabularnewline
24 & 0.464652 & 4.5289 & 9e-06 \tabularnewline
25 & -0.046109 & -0.4494 & 0.327077 \tabularnewline
26 & -0.046759 & -0.4557 & 0.324805 \tabularnewline
27 & -0.041561 & -0.4051 & 0.343164 \tabularnewline
28 & -0.04221 & -0.4114 & 0.340847 \tabularnewline
29 & -0.04286 & -0.4177 & 0.338537 \tabularnewline
30 & -0.04351 & -0.4241 & 0.336233 \tabularnewline
31 & -0.044159 & -0.4304 & 0.333936 \tabularnewline
32 & -0.044809 & -0.4367 & 0.331644 \tabularnewline
33 & -0.037104 & -0.3616 & 0.359209 \tabularnewline
34 & -0.037754 & -0.368 & 0.356853 \tabularnewline
35 & -0.038404 & -0.3743 & 0.354503 \tabularnewline
36 & 0.507705 & 4.9485 & 2e-06 \tabularnewline
37 & -0.039703 & -0.387 & 0.349819 \tabularnewline
38 & -0.040353 & -0.3933 & 0.347486 \tabularnewline
39 & -0.042906 & -0.4182 & 0.338373 \tabularnewline
40 & -0.043556 & -0.4245 & 0.336069 \tabularnewline
41 & -0.044206 & -0.4309 & 0.333772 \tabularnewline
42 & -0.044855 & -0.4372 & 0.331481 \tabularnewline
43 & -0.045505 & -0.4435 & 0.329196 \tabularnewline
44 & -0.046155 & -0.4499 & 0.326918 \tabularnewline
45 & -0.029235 & -0.2849 & 0.388154 \tabularnewline
46 & -0.029884 & -0.2913 & 0.385738 \tabularnewline
47 & -0.030534 & -0.2976 & 0.383326 \tabularnewline
48 & 0.248232 & 2.4195 & 0.008723 \tabularnewline
\hline
\end{tabular}
%Source: https://freestatistics.org/blog/index.php?pk=279210&T=1

[TABLE]
[ROW][C]Autocorrelation Function[/C][/ROW]
[ROW][C]Time lag k[/C][C]ACF(k)[/C][C]T-STAT[/C][C]P-value[/C][/ROW]
[ROW][C]1[/C][C]-0.062367[/C][C]-0.6079[/C][C]0.272359[/C][/ROW]
[ROW][C]2[/C][C]-0.063017[/C][C]-0.6142[/C][C]0.270272[/C][/ROW]
[ROW][C]3[/C][C]-0.057864[/C][C]-0.564[/C][C]0.287046[/C][/ROW]
[ROW][C]4[/C][C]-0.058513[/C][C]-0.5703[/C][C]0.284904[/C][/ROW]
[ROW][C]5[/C][C]-0.059163[/C][C]-0.5767[/C][C]0.28277[/C][/ROW]
[ROW][C]6[/C][C]-0.059813[/C][C]-0.583[/C][C]0.280643[/C][/ROW]
[ROW][C]7[/C][C]-0.060462[/C][C]-0.5893[/C][C]0.278525[/C][/ROW]
[ROW][C]8[/C][C]-0.061112[/C][C]-0.5956[/C][C]0.276414[/C][/ROW]
[ROW][C]9[/C][C]-0.050066[/C][C]-0.488[/C][C]0.313344[/C][/ROW]
[ROW][C]10[/C][C]-0.050715[/C][C]-0.4943[/C][C]0.311113[/C][/ROW]
[ROW][C]11[/C][C]-0.051365[/C][C]-0.5006[/C][C]0.308889[/C][/ROW]
[ROW][C]12[/C][C]0.455761[/C][C]4.4422[/C][C]1.2e-05[/C][/ROW]
[ROW][C]13[/C][C]-0.052664[/C][C]-0.5133[/C][C]0.304463[/C][/ROW]
[ROW][C]14[/C][C]-0.053314[/C][C]-0.5196[/C][C]0.302261[/C][/ROW]
[ROW][C]15[/C][C]-0.046814[/C][C]-0.4563[/C][C]0.324612[/C][/ROW]
[ROW][C]16[/C][C]-0.047464[/C][C]-0.4626[/C][C]0.322347[/C][/ROW]
[ROW][C]17[/C][C]-0.048113[/C][C]-0.469[/C][C]0.320089[/C][/ROW]
[ROW][C]18[/C][C]-0.048763[/C][C]-0.4753[/C][C]0.317838[/C][/ROW]
[ROW][C]19[/C][C]-0.049413[/C][C]-0.4816[/C][C]0.315593[/C][/ROW]
[ROW][C]20[/C][C]-0.050062[/C][C]-0.4879[/C][C]0.313355[/C][/ROW]
[ROW][C]21[/C][C]-0.043511[/C][C]-0.4241[/C][C]0.33623[/C][/ROW]
[ROW][C]22[/C][C]-0.04416[/C][C]-0.4304[/C][C]0.333932[/C][/ROW]
[ROW][C]23[/C][C]-0.04481[/C][C]-0.4368[/C][C]0.331641[/C][/ROW]
[ROW][C]24[/C][C]0.464652[/C][C]4.5289[/C][C]9e-06[/C][/ROW]
[ROW][C]25[/C][C]-0.046109[/C][C]-0.4494[/C][C]0.327077[/C][/ROW]
[ROW][C]26[/C][C]-0.046759[/C][C]-0.4557[/C][C]0.324805[/C][/ROW]
[ROW][C]27[/C][C]-0.041561[/C][C]-0.4051[/C][C]0.343164[/C][/ROW]
[ROW][C]28[/C][C]-0.04221[/C][C]-0.4114[/C][C]0.340847[/C][/ROW]
[ROW][C]29[/C][C]-0.04286[/C][C]-0.4177[/C][C]0.338537[/C][/ROW]
[ROW][C]30[/C][C]-0.04351[/C][C]-0.4241[/C][C]0.336233[/C][/ROW]
[ROW][C]31[/C][C]-0.044159[/C][C]-0.4304[/C][C]0.333936[/C][/ROW]
[ROW][C]32[/C][C]-0.044809[/C][C]-0.4367[/C][C]0.331644[/C][/ROW]
[ROW][C]33[/C][C]-0.037104[/C][C]-0.3616[/C][C]0.359209[/C][/ROW]
[ROW][C]34[/C][C]-0.037754[/C][C]-0.368[/C][C]0.356853[/C][/ROW]
[ROW][C]35[/C][C]-0.038404[/C][C]-0.3743[/C][C]0.354503[/C][/ROW]
[ROW][C]36[/C][C]0.507705[/C][C]4.9485[/C][C]2e-06[/C][/ROW]
[ROW][C]37[/C][C]-0.039703[/C][C]-0.387[/C][C]0.349819[/C][/ROW]
[ROW][C]38[/C][C]-0.040353[/C][C]-0.3933[/C][C]0.347486[/C][/ROW]
[ROW][C]39[/C][C]-0.042906[/C][C]-0.4182[/C][C]0.338373[/C][/ROW]
[ROW][C]40[/C][C]-0.043556[/C][C]-0.4245[/C][C]0.336069[/C][/ROW]
[ROW][C]41[/C][C]-0.044206[/C][C]-0.4309[/C][C]0.333772[/C][/ROW]
[ROW][C]42[/C][C]-0.044855[/C][C]-0.4372[/C][C]0.331481[/C][/ROW]
[ROW][C]43[/C][C]-0.045505[/C][C]-0.4435[/C][C]0.329196[/C][/ROW]
[ROW][C]44[/C][C]-0.046155[/C][C]-0.4499[/C][C]0.326918[/C][/ROW]
[ROW][C]45[/C][C]-0.029235[/C][C]-0.2849[/C][C]0.388154[/C][/ROW]
[ROW][C]46[/C][C]-0.029884[/C][C]-0.2913[/C][C]0.385738[/C][/ROW]
[ROW][C]47[/C][C]-0.030534[/C][C]-0.2976[/C][C]0.383326[/C][/ROW]
[ROW][C]48[/C][C]0.248232[/C][C]2.4195[/C][C]0.008723[/C][/ROW]
[/TABLE]
Source: https://freestatistics.org/blog/index.php?pk=279210&T=1

Globally Unique Identifier (entire table): ba.freestatistics.org/blog/index.php?pk=279210&T=1

As an alternative you can also use a QR Code:  

The GUIDs for individual cells are displayed in the table below:

Autocorrelation Function
Time lag kACF(k)T-STATP-value
1-0.062367-0.60790.272359
2-0.063017-0.61420.270272
3-0.057864-0.5640.287046
4-0.058513-0.57030.284904
5-0.059163-0.57670.28277
6-0.059813-0.5830.280643
7-0.060462-0.58930.278525
8-0.061112-0.59560.276414
9-0.050066-0.4880.313344
10-0.050715-0.49430.311113
11-0.051365-0.50060.308889
120.4557614.44221.2e-05
13-0.052664-0.51330.304463
14-0.053314-0.51960.302261
15-0.046814-0.45630.324612
16-0.047464-0.46260.322347
17-0.048113-0.4690.320089
18-0.048763-0.47530.317838
19-0.049413-0.48160.315593
20-0.050062-0.48790.313355
21-0.043511-0.42410.33623
22-0.04416-0.43040.333932
23-0.04481-0.43680.331641
240.4646524.52899e-06
25-0.046109-0.44940.327077
26-0.046759-0.45570.324805
27-0.041561-0.40510.343164
28-0.04221-0.41140.340847
29-0.04286-0.41770.338537
30-0.04351-0.42410.336233
31-0.044159-0.43040.333936
32-0.044809-0.43670.331644
33-0.037104-0.36160.359209
34-0.037754-0.3680.356853
35-0.038404-0.37430.354503
360.5077054.94852e-06
37-0.039703-0.3870.349819
38-0.040353-0.39330.347486
39-0.042906-0.41820.338373
40-0.043556-0.42450.336069
41-0.044206-0.43090.333772
42-0.044855-0.43720.331481
43-0.045505-0.44350.329196
44-0.046155-0.44990.326918
45-0.029235-0.28490.388154
46-0.029884-0.29130.385738
47-0.030534-0.29760.383326
480.2482322.41950.008723


Partial Autocorrelation Function
Time lag kPACF(k)T-STATP-value
1-0.062367-0.60790.272359
2-0.067168-0.65470.257131
3-0.066807-0.65120.258259
4-0.072229-0.7040.241577
5-0.078493-0.76510.223067
6-0.085855-0.83680.202399
7-0.094598-0.9220.179426
8-0.105164-1.0250.153979
9-0.105893-1.03210.152318
10-0.118975-1.15960.124554
11-0.135584-1.32150.094752
120.4013453.91188.6e-05
13-0.045394-0.44240.329586
14-0.047093-0.4590.323639
15-0.046789-0.4560.3247
16-0.051906-0.50590.307043
17-0.054182-0.52810.299331
18-0.056877-0.55440.290315
19-0.059964-0.58450.28015
20-0.06339-0.61780.269077
21-0.072585-0.70750.240504
22-0.079876-0.77850.219095
23-0.086706-0.84510.200088
240.270852.63990.004847
25-0.031059-0.30270.38138
26-0.030851-0.30070.382152
27-0.033398-0.32550.372752
28-0.038187-0.37220.355288
29-0.03891-0.37920.352676
30-0.03967-0.38670.349938
31-0.040468-0.39440.347073
32-0.041259-0.40210.34424
33-0.046092-0.44930.327136
34-0.050609-0.49330.311479
35-0.052852-0.51510.303828
360.2706672.63810.004871
370.0003130.00310.498784
380.0035760.03490.486135
39-0.00958-0.09340.462903
40-0.014708-0.14340.443156
41-0.014424-0.14060.444246
42-0.013988-0.13630.44592
43-0.013337-0.130.448424
44-0.012599-0.12280.451264
45-0.003449-0.03360.486626
46-0.00538-0.05240.479145
47-0.003612-0.03520.485997
48-0.183682-1.79030.038295

\begin{tabular}{lllllllll}
\hline
Partial Autocorrelation Function \tabularnewline
Time lag k & PACF(k) & T-STAT & P-value \tabularnewline
1 & -0.062367 & -0.6079 & 0.272359 \tabularnewline
2 & -0.067168 & -0.6547 & 0.257131 \tabularnewline
3 & -0.066807 & -0.6512 & 0.258259 \tabularnewline
4 & -0.072229 & -0.704 & 0.241577 \tabularnewline
5 & -0.078493 & -0.7651 & 0.223067 \tabularnewline
6 & -0.085855 & -0.8368 & 0.202399 \tabularnewline
7 & -0.094598 & -0.922 & 0.179426 \tabularnewline
8 & -0.105164 & -1.025 & 0.153979 \tabularnewline
9 & -0.105893 & -1.0321 & 0.152318 \tabularnewline
10 & -0.118975 & -1.1596 & 0.124554 \tabularnewline
11 & -0.135584 & -1.3215 & 0.094752 \tabularnewline
12 & 0.401345 & 3.9118 & 8.6e-05 \tabularnewline
13 & -0.045394 & -0.4424 & 0.329586 \tabularnewline
14 & -0.047093 & -0.459 & 0.323639 \tabularnewline
15 & -0.046789 & -0.456 & 0.3247 \tabularnewline
16 & -0.051906 & -0.5059 & 0.307043 \tabularnewline
17 & -0.054182 & -0.5281 & 0.299331 \tabularnewline
18 & -0.056877 & -0.5544 & 0.290315 \tabularnewline
19 & -0.059964 & -0.5845 & 0.28015 \tabularnewline
20 & -0.06339 & -0.6178 & 0.269077 \tabularnewline
21 & -0.072585 & -0.7075 & 0.240504 \tabularnewline
22 & -0.079876 & -0.7785 & 0.219095 \tabularnewline
23 & -0.086706 & -0.8451 & 0.200088 \tabularnewline
24 & 0.27085 & 2.6399 & 0.004847 \tabularnewline
25 & -0.031059 & -0.3027 & 0.38138 \tabularnewline
26 & -0.030851 & -0.3007 & 0.382152 \tabularnewline
27 & -0.033398 & -0.3255 & 0.372752 \tabularnewline
28 & -0.038187 & -0.3722 & 0.355288 \tabularnewline
29 & -0.03891 & -0.3792 & 0.352676 \tabularnewline
30 & -0.03967 & -0.3867 & 0.349938 \tabularnewline
31 & -0.040468 & -0.3944 & 0.347073 \tabularnewline
32 & -0.041259 & -0.4021 & 0.34424 \tabularnewline
33 & -0.046092 & -0.4493 & 0.327136 \tabularnewline
34 & -0.050609 & -0.4933 & 0.311479 \tabularnewline
35 & -0.052852 & -0.5151 & 0.303828 \tabularnewline
36 & 0.270667 & 2.6381 & 0.004871 \tabularnewline
37 & 0.000313 & 0.0031 & 0.498784 \tabularnewline
38 & 0.003576 & 0.0349 & 0.486135 \tabularnewline
39 & -0.00958 & -0.0934 & 0.462903 \tabularnewline
40 & -0.014708 & -0.1434 & 0.443156 \tabularnewline
41 & -0.014424 & -0.1406 & 0.444246 \tabularnewline
42 & -0.013988 & -0.1363 & 0.44592 \tabularnewline
43 & -0.013337 & -0.13 & 0.448424 \tabularnewline
44 & -0.012599 & -0.1228 & 0.451264 \tabularnewline
45 & -0.003449 & -0.0336 & 0.486626 \tabularnewline
46 & -0.00538 & -0.0524 & 0.479145 \tabularnewline
47 & -0.003612 & -0.0352 & 0.485997 \tabularnewline
48 & -0.183682 & -1.7903 & 0.038295 \tabularnewline
\hline
\end{tabular}
%Source: https://freestatistics.org/blog/index.php?pk=279210&T=2

[TABLE]
[ROW][C]Partial Autocorrelation Function[/C][/ROW]
[ROW][C]Time lag k[/C][C]PACF(k)[/C][C]T-STAT[/C][C]P-value[/C][/ROW]
[ROW][C]1[/C][C]-0.062367[/C][C]-0.6079[/C][C]0.272359[/C][/ROW]
[ROW][C]2[/C][C]-0.067168[/C][C]-0.6547[/C][C]0.257131[/C][/ROW]
[ROW][C]3[/C][C]-0.066807[/C][C]-0.6512[/C][C]0.258259[/C][/ROW]
[ROW][C]4[/C][C]-0.072229[/C][C]-0.704[/C][C]0.241577[/C][/ROW]
[ROW][C]5[/C][C]-0.078493[/C][C]-0.7651[/C][C]0.223067[/C][/ROW]
[ROW][C]6[/C][C]-0.085855[/C][C]-0.8368[/C][C]0.202399[/C][/ROW]
[ROW][C]7[/C][C]-0.094598[/C][C]-0.922[/C][C]0.179426[/C][/ROW]
[ROW][C]8[/C][C]-0.105164[/C][C]-1.025[/C][C]0.153979[/C][/ROW]
[ROW][C]9[/C][C]-0.105893[/C][C]-1.0321[/C][C]0.152318[/C][/ROW]
[ROW][C]10[/C][C]-0.118975[/C][C]-1.1596[/C][C]0.124554[/C][/ROW]
[ROW][C]11[/C][C]-0.135584[/C][C]-1.3215[/C][C]0.094752[/C][/ROW]
[ROW][C]12[/C][C]0.401345[/C][C]3.9118[/C][C]8.6e-05[/C][/ROW]
[ROW][C]13[/C][C]-0.045394[/C][C]-0.4424[/C][C]0.329586[/C][/ROW]
[ROW][C]14[/C][C]-0.047093[/C][C]-0.459[/C][C]0.323639[/C][/ROW]
[ROW][C]15[/C][C]-0.046789[/C][C]-0.456[/C][C]0.3247[/C][/ROW]
[ROW][C]16[/C][C]-0.051906[/C][C]-0.5059[/C][C]0.307043[/C][/ROW]
[ROW][C]17[/C][C]-0.054182[/C][C]-0.5281[/C][C]0.299331[/C][/ROW]
[ROW][C]18[/C][C]-0.056877[/C][C]-0.5544[/C][C]0.290315[/C][/ROW]
[ROW][C]19[/C][C]-0.059964[/C][C]-0.5845[/C][C]0.28015[/C][/ROW]
[ROW][C]20[/C][C]-0.06339[/C][C]-0.6178[/C][C]0.269077[/C][/ROW]
[ROW][C]21[/C][C]-0.072585[/C][C]-0.7075[/C][C]0.240504[/C][/ROW]
[ROW][C]22[/C][C]-0.079876[/C][C]-0.7785[/C][C]0.219095[/C][/ROW]
[ROW][C]23[/C][C]-0.086706[/C][C]-0.8451[/C][C]0.200088[/C][/ROW]
[ROW][C]24[/C][C]0.27085[/C][C]2.6399[/C][C]0.004847[/C][/ROW]
[ROW][C]25[/C][C]-0.031059[/C][C]-0.3027[/C][C]0.38138[/C][/ROW]
[ROW][C]26[/C][C]-0.030851[/C][C]-0.3007[/C][C]0.382152[/C][/ROW]
[ROW][C]27[/C][C]-0.033398[/C][C]-0.3255[/C][C]0.372752[/C][/ROW]
[ROW][C]28[/C][C]-0.038187[/C][C]-0.3722[/C][C]0.355288[/C][/ROW]
[ROW][C]29[/C][C]-0.03891[/C][C]-0.3792[/C][C]0.352676[/C][/ROW]
[ROW][C]30[/C][C]-0.03967[/C][C]-0.3867[/C][C]0.349938[/C][/ROW]
[ROW][C]31[/C][C]-0.040468[/C][C]-0.3944[/C][C]0.347073[/C][/ROW]
[ROW][C]32[/C][C]-0.041259[/C][C]-0.4021[/C][C]0.34424[/C][/ROW]
[ROW][C]33[/C][C]-0.046092[/C][C]-0.4493[/C][C]0.327136[/C][/ROW]
[ROW][C]34[/C][C]-0.050609[/C][C]-0.4933[/C][C]0.311479[/C][/ROW]
[ROW][C]35[/C][C]-0.052852[/C][C]-0.5151[/C][C]0.303828[/C][/ROW]
[ROW][C]36[/C][C]0.270667[/C][C]2.6381[/C][C]0.004871[/C][/ROW]
[ROW][C]37[/C][C]0.000313[/C][C]0.0031[/C][C]0.498784[/C][/ROW]
[ROW][C]38[/C][C]0.003576[/C][C]0.0349[/C][C]0.486135[/C][/ROW]
[ROW][C]39[/C][C]-0.00958[/C][C]-0.0934[/C][C]0.462903[/C][/ROW]
[ROW][C]40[/C][C]-0.014708[/C][C]-0.1434[/C][C]0.443156[/C][/ROW]
[ROW][C]41[/C][C]-0.014424[/C][C]-0.1406[/C][C]0.444246[/C][/ROW]
[ROW][C]42[/C][C]-0.013988[/C][C]-0.1363[/C][C]0.44592[/C][/ROW]
[ROW][C]43[/C][C]-0.013337[/C][C]-0.13[/C][C]0.448424[/C][/ROW]
[ROW][C]44[/C][C]-0.012599[/C][C]-0.1228[/C][C]0.451264[/C][/ROW]
[ROW][C]45[/C][C]-0.003449[/C][C]-0.0336[/C][C]0.486626[/C][/ROW]
[ROW][C]46[/C][C]-0.00538[/C][C]-0.0524[/C][C]0.479145[/C][/ROW]
[ROW][C]47[/C][C]-0.003612[/C][C]-0.0352[/C][C]0.485997[/C][/ROW]
[ROW][C]48[/C][C]-0.183682[/C][C]-1.7903[/C][C]0.038295[/C][/ROW]
[/TABLE]
Source: https://freestatistics.org/blog/index.php?pk=279210&T=2

Globally Unique Identifier (entire table): ba.freestatistics.org/blog/index.php?pk=279210&T=2

As an alternative you can also use a QR Code:  

The GUIDs for individual cells are displayed in the table below:

Partial Autocorrelation Function
Time lag kPACF(k)T-STATP-value
1-0.062367-0.60790.272359
2-0.067168-0.65470.257131
3-0.066807-0.65120.258259
4-0.072229-0.7040.241577
5-0.078493-0.76510.223067
6-0.085855-0.83680.202399
7-0.094598-0.9220.179426
8-0.105164-1.0250.153979
9-0.105893-1.03210.152318
10-0.118975-1.15960.124554
11-0.135584-1.32150.094752
120.4013453.91188.6e-05
13-0.045394-0.44240.329586
14-0.047093-0.4590.323639
15-0.046789-0.4560.3247
16-0.051906-0.50590.307043
17-0.054182-0.52810.299331
18-0.056877-0.55440.290315
19-0.059964-0.58450.28015
20-0.06339-0.61780.269077
21-0.072585-0.70750.240504
22-0.079876-0.77850.219095
23-0.086706-0.84510.200088
240.270852.63990.004847
25-0.031059-0.30270.38138
26-0.030851-0.30070.382152
27-0.033398-0.32550.372752
28-0.038187-0.37220.355288
29-0.03891-0.37920.352676
30-0.03967-0.38670.349938
31-0.040468-0.39440.347073
32-0.041259-0.40210.34424
33-0.046092-0.44930.327136
34-0.050609-0.49330.311479
35-0.052852-0.51510.303828
360.2706672.63810.004871
370.0003130.00310.498784
380.0035760.03490.486135
39-0.00958-0.09340.462903
40-0.014708-0.14340.443156
41-0.014424-0.14060.444246
42-0.013988-0.13630.44592
43-0.013337-0.130.448424
44-0.012599-0.12280.451264
45-0.003449-0.03360.486626
46-0.00538-0.05240.479145
47-0.003612-0.03520.485997
48-0.183682-1.79030.038295


Parameters (Session):
par1 = 48 ; par2 = 1 ; par3 = 1 ; par4 = 0 ; par5 = 12 ; par6 = White Noise ; par7 = 0.95 ;
Parameters (R input):
par1 = 48 ; par2 = 1 ; par3 = 1 ; par4 = 0 ; par5 = 12 ; par6 = White Noise ; par7 = 0.95 ; par8 = ;
R code (references can be found in the software module):
par8 <- ''
par7 <- '0.95'
par6 <- 'White Noise'
par5 <- '12'
par4 <- '0'
par3 <- '0'
par2 <- '1'
par1 <- '48'
if (par1 == 'Default') {
par1 = 10*log10(length(x))
} else {
par1 <- as.numeric(par1)
}
par2 <- as.numeric(par2)
par3 <- as.numeric(par3)
par4 <- as.numeric(par4)
par5 <- as.numeric(par5)
if (par6 == 'White Noise') par6 <- 'white' else par6 <- 'ma'
par7 <- as.numeric(par7)
if (par8 != '') par8 <- as.numeric(par8)
ox <- x
if (par8 == '') {
if (par2 == 0) {
x <- log(x)
} else {
x <- (x ^ par2 - 1) / par2
}
} else {
x <- log(x,base=par8)
}
if (par3 > 0) x <- diff(x,lag=1,difference=par3)
if (par4 > 0) x <- diff(x,lag=par5,difference=par4)
bitmap(file='picts.png')
op <- par(mfrow=c(2,1))
plot(ox,type='l',main='Original Time Series',xlab='time',ylab='value')
if (par8=='') {
mytitle <- paste('Working Time Series (lambda=',par2,', d=',par3,', D=',par4,')',sep='')
mysub <- paste('(lambda=',par2,', d=',par3,', D=',par4,', CI=', par7, ', CI type=',par6,')',sep='')
} else {
mytitle <- paste('Working Time Series (base=',par8,', d=',par3,', D=',par4,')',sep='')
mysub <- paste('(base=',par8,', d=',par3,', D=',par4,', CI=', par7, ', CI type=',par6,')',sep='')
}
plot(x,type='l', main=mytitle,xlab='time',ylab='value')
par(op)
dev.off()
bitmap(file='pic1.png')
racf <- acf(x, par1, main='Autocorrelation', xlab='time lag', ylab='ACF', ci.type=par6, ci=par7, sub=mysub)
dev.off()
bitmap(file='pic2.png')
rpacf <- pacf(x,par1,main='Partial Autocorrelation',xlab='lags',ylab='PACF',sub=mysub)
dev.off()
(myacf <- c(racf$acf))
(mypacf <- c(rpacf$acf))
lengthx <- length(x)
sqrtn <- sqrt(lengthx)
load(file='createtable')
a<-table.start()
a<-table.row.start(a)
a<-table.element(a,'Autocorrelation Function',4,TRUE)
a<-table.row.end(a)
a<-table.row.start(a)
a<-table.element(a,'Time lag k',header=TRUE)
a<-table.element(a,hyperlink('basics.htm','ACF(k)','click here for more information about the Autocorrelation Function'),header=TRUE)
a<-table.element(a,'T-STAT',header=TRUE)
a<-table.element(a,'P-value',header=TRUE)
a<-table.row.end(a)
for (i in 2:(par1+1)) {
a<-table.row.start(a)
a<-table.element(a,i-1,header=TRUE)
a<-table.element(a,round(myacf[i],6))
mytstat <- myacf[i]*sqrtn
a<-table.element(a,round(mytstat,4))
a<-table.element(a,round(1-pt(abs(mytstat),lengthx),6))
a<-table.row.end(a)
}
a<-table.end(a)
table.save(a,file='mytable.tab')
a<-table.start()
a<-table.row.start(a)
a<-table.element(a,'Partial Autocorrelation Function',4,TRUE)
a<-table.row.end(a)
a<-table.row.start(a)
a<-table.element(a,'Time lag k',header=TRUE)
a<-table.element(a,hyperlink('basics.htm','PACF(k)','click here for more information about the Partial Autocorrelation Function'),header=TRUE)
a<-table.element(a,'T-STAT',header=TRUE)
a<-table.element(a,'P-value',header=TRUE)
a<-table.row.end(a)
for (i in 1:par1) {
a<-table.row.start(a)
a<-table.element(a,i,header=TRUE)
a<-table.element(a,round(mypacf[i],6))
mytstat <- mypacf[i]*sqrtn
a<-table.element(a,round(mytstat,4))
a<-table.element(a,round(1-pt(abs(mytstat),lengthx),6))
a<-table.row.end(a)
}
a<-table.end(a)
table.save(a,file='mytable1.tab')