Free Statistics

of Irreproducible Research!

Author's title

Author*Unverified author*
R Software Modulerwasp_autocorrelation.wasp
Title produced by software(Partial) Autocorrelation Function
Date of computationThu, 21 May 2015 23:29:00 +0100
Cite this page as followsStatistical Computations at FreeStatistics.org, Office for Research Development and Education, URL https://freestatistics.org/blog/index.php?v=date/2015/May/21/t1432247380sfcexc6y2anfg42.htm/, Retrieved Sat, 04 May 2024 17:16:06 +0000
Statistical Computations at FreeStatistics.org, Office for Research Development and Education, URL https://freestatistics.org/blog/index.php?pk=279211, Retrieved Sat, 04 May 2024 17:16:06 +0000
QR Codes:

Original text written by user:
IsPrivate?No (this computation is public)
User-defined keywords
Estimated Impact128
Family? (F = Feedback message, R = changed R code, M = changed R Module, P = changed Parameters, D = changed Data)
-       [(Partial) Autocorrelation Function] [] [2015-05-21 22:29:00] [36d9fcfacb97c24df6a506fb08c7a09a] [Current]
Feedback Forum

Post a new message
Dataseries X:
599
599
599
599
599
599
599
599
599
617,06
617,06
617,06
617,06
617,06
617,06
617,06
617,06
617,06
617,06
617,06
617,06
628,18
628,18
628,18
628,18
628,18
628,18
628,18
628,18
628,18
628,18
628,18
628,18
641,08
641,08
641,08
641,08
641,08
641,08
641,08
641,08
641,08
641,08
641,08
641,08
668,21
668,21
668,21
668,21
668,21
668,21
668,21
668,21
668,21
668,21
668,21
668,21
665,27
665,27
665,27
665,27
665,27
665,27
665,27
665,27
665,27
665,27
665,27
665,27
674,3
674,3
674,3
674,3
674,3
674,3
674,3
674,3
674,3
674,3
674,3
674,3
685,34
685,34
685,34
685,34
685,34
685,34
685,34
685,34
685,34
685,34
685,34
685,34
694,3
694,3
694,3


Summary of computational transaction
Raw Inputview raw input (R code)
Raw Outputview raw output of R engine
Computing time1 seconds
R Server'Gertrude Mary Cox' @ cox.wessa.net

\begin{tabular}{lllllllll}
\hline
Summary of computational transaction \tabularnewline
Raw Input & view raw input (R code)  \tabularnewline
Raw Output & view raw output of R engine  \tabularnewline
Computing time & 1 seconds \tabularnewline
R Server & 'Gertrude Mary Cox' @ cox.wessa.net \tabularnewline
\hline
\end{tabular}
%Source: https://freestatistics.org/blog/index.php?pk=279211&T=0

[TABLE]
[ROW][C]Summary of computational transaction[/C][/ROW]
[ROW][C]Raw Input[/C][C]view raw input (R code) [/C][/ROW]
[ROW][C]Raw Output[/C][C]view raw output of R engine [/C][/ROW]
[ROW][C]Computing time[/C][C]1 seconds[/C][/ROW]
[ROW][C]R Server[/C][C]'Gertrude Mary Cox' @ cox.wessa.net[/C][/ROW]
[/TABLE]
Source: https://freestatistics.org/blog/index.php?pk=279211&T=0

Globally Unique Identifier (entire table): ba.freestatistics.org/blog/index.php?pk=279211&T=0

As an alternative you can also use a QR Code:  

The GUIDs for individual cells are displayed in the table below:

Summary of computational transaction
Raw Inputview raw input (R code)
Raw Outputview raw output of R engine
Computing time1 seconds
R Server'Gertrude Mary Cox' @ cox.wessa.net


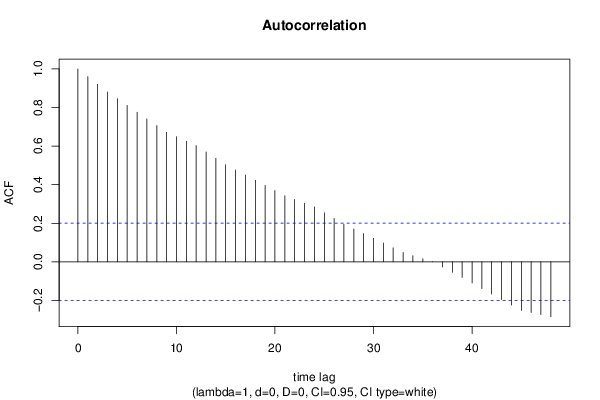
Autocorrelation Function
Time lag kACF(k)T-STATP-value
10.9600919.40690
20.9201829.01590
30.8802738.62490
40.8454318.28350
50.810597.94210
60.7757487.60070
70.7409077.25940
80.7060656.9180
90.6712236.57660
100.6482826.35180
110.6253416.12710
120.60245.90230
130.5693525.57850
140.5363045.25470
150.5032574.93092e-06
160.4764534.66835e-06
170.4496494.40561.4e-05
180.4228464.1433.7e-05
190.3960423.88049.6e-05
200.3692383.61780.000238
210.3424353.35520.000569
220.3229583.16430.001041
230.3034822.97350.001861
240.2840052.78270.003246
250.2543762.49240.007201
260.2247472.20210.015028
270.1951181.91180.029445
280.1705961.67150.048941
290.1460741.43120.077807
300.1215521.1910.118303
310.0970290.95070.172074
320.0725070.71040.239582
330.0479850.47020.319654
340.0319630.31320.377413
350.0159420.15620.438104
36-8e-05-8e-040.499687
37-0.026984-0.26440.396022
38-0.053888-0.5280.29936
39-0.080793-0.79160.215272
40-0.109359-1.07150.143316
41-0.137926-1.35140.089872
42-0.166493-1.63130.053053
43-0.19506-1.91120.029482
44-0.223627-2.19110.015433
45-0.252194-2.4710.007619
46-0.262884-2.57570.005764
47-0.273574-2.68050.004327
48-0.284264-2.78520.003223

\begin{tabular}{lllllllll}
\hline
Autocorrelation Function \tabularnewline
Time lag k & ACF(k) & T-STAT & P-value \tabularnewline
1 & 0.960091 & 9.4069 & 0 \tabularnewline
2 & 0.920182 & 9.0159 & 0 \tabularnewline
3 & 0.880273 & 8.6249 & 0 \tabularnewline
4 & 0.845431 & 8.2835 & 0 \tabularnewline
5 & 0.81059 & 7.9421 & 0 \tabularnewline
6 & 0.775748 & 7.6007 & 0 \tabularnewline
7 & 0.740907 & 7.2594 & 0 \tabularnewline
8 & 0.706065 & 6.918 & 0 \tabularnewline
9 & 0.671223 & 6.5766 & 0 \tabularnewline
10 & 0.648282 & 6.3518 & 0 \tabularnewline
11 & 0.625341 & 6.1271 & 0 \tabularnewline
12 & 0.6024 & 5.9023 & 0 \tabularnewline
13 & 0.569352 & 5.5785 & 0 \tabularnewline
14 & 0.536304 & 5.2547 & 0 \tabularnewline
15 & 0.503257 & 4.9309 & 2e-06 \tabularnewline
16 & 0.476453 & 4.6683 & 5e-06 \tabularnewline
17 & 0.449649 & 4.4056 & 1.4e-05 \tabularnewline
18 & 0.422846 & 4.143 & 3.7e-05 \tabularnewline
19 & 0.396042 & 3.8804 & 9.6e-05 \tabularnewline
20 & 0.369238 & 3.6178 & 0.000238 \tabularnewline
21 & 0.342435 & 3.3552 & 0.000569 \tabularnewline
22 & 0.322958 & 3.1643 & 0.001041 \tabularnewline
23 & 0.303482 & 2.9735 & 0.001861 \tabularnewline
24 & 0.284005 & 2.7827 & 0.003246 \tabularnewline
25 & 0.254376 & 2.4924 & 0.007201 \tabularnewline
26 & 0.224747 & 2.2021 & 0.015028 \tabularnewline
27 & 0.195118 & 1.9118 & 0.029445 \tabularnewline
28 & 0.170596 & 1.6715 & 0.048941 \tabularnewline
29 & 0.146074 & 1.4312 & 0.077807 \tabularnewline
30 & 0.121552 & 1.191 & 0.118303 \tabularnewline
31 & 0.097029 & 0.9507 & 0.172074 \tabularnewline
32 & 0.072507 & 0.7104 & 0.239582 \tabularnewline
33 & 0.047985 & 0.4702 & 0.319654 \tabularnewline
34 & 0.031963 & 0.3132 & 0.377413 \tabularnewline
35 & 0.015942 & 0.1562 & 0.438104 \tabularnewline
36 & -8e-05 & -8e-04 & 0.499687 \tabularnewline
37 & -0.026984 & -0.2644 & 0.396022 \tabularnewline
38 & -0.053888 & -0.528 & 0.29936 \tabularnewline
39 & -0.080793 & -0.7916 & 0.215272 \tabularnewline
40 & -0.109359 & -1.0715 & 0.143316 \tabularnewline
41 & -0.137926 & -1.3514 & 0.089872 \tabularnewline
42 & -0.166493 & -1.6313 & 0.053053 \tabularnewline
43 & -0.19506 & -1.9112 & 0.029482 \tabularnewline
44 & -0.223627 & -2.1911 & 0.015433 \tabularnewline
45 & -0.252194 & -2.471 & 0.007619 \tabularnewline
46 & -0.262884 & -2.5757 & 0.005764 \tabularnewline
47 & -0.273574 & -2.6805 & 0.004327 \tabularnewline
48 & -0.284264 & -2.7852 & 0.003223 \tabularnewline
\hline
\end{tabular}
%Source: https://freestatistics.org/blog/index.php?pk=279211&T=1

[TABLE]
[ROW][C]Autocorrelation Function[/C][/ROW]
[ROW][C]Time lag k[/C][C]ACF(k)[/C][C]T-STAT[/C][C]P-value[/C][/ROW]
[ROW][C]1[/C][C]0.960091[/C][C]9.4069[/C][C]0[/C][/ROW]
[ROW][C]2[/C][C]0.920182[/C][C]9.0159[/C][C]0[/C][/ROW]
[ROW][C]3[/C][C]0.880273[/C][C]8.6249[/C][C]0[/C][/ROW]
[ROW][C]4[/C][C]0.845431[/C][C]8.2835[/C][C]0[/C][/ROW]
[ROW][C]5[/C][C]0.81059[/C][C]7.9421[/C][C]0[/C][/ROW]
[ROW][C]6[/C][C]0.775748[/C][C]7.6007[/C][C]0[/C][/ROW]
[ROW][C]7[/C][C]0.740907[/C][C]7.2594[/C][C]0[/C][/ROW]
[ROW][C]8[/C][C]0.706065[/C][C]6.918[/C][C]0[/C][/ROW]
[ROW][C]9[/C][C]0.671223[/C][C]6.5766[/C][C]0[/C][/ROW]
[ROW][C]10[/C][C]0.648282[/C][C]6.3518[/C][C]0[/C][/ROW]
[ROW][C]11[/C][C]0.625341[/C][C]6.1271[/C][C]0[/C][/ROW]
[ROW][C]12[/C][C]0.6024[/C][C]5.9023[/C][C]0[/C][/ROW]
[ROW][C]13[/C][C]0.569352[/C][C]5.5785[/C][C]0[/C][/ROW]
[ROW][C]14[/C][C]0.536304[/C][C]5.2547[/C][C]0[/C][/ROW]
[ROW][C]15[/C][C]0.503257[/C][C]4.9309[/C][C]2e-06[/C][/ROW]
[ROW][C]16[/C][C]0.476453[/C][C]4.6683[/C][C]5e-06[/C][/ROW]
[ROW][C]17[/C][C]0.449649[/C][C]4.4056[/C][C]1.4e-05[/C][/ROW]
[ROW][C]18[/C][C]0.422846[/C][C]4.143[/C][C]3.7e-05[/C][/ROW]
[ROW][C]19[/C][C]0.396042[/C][C]3.8804[/C][C]9.6e-05[/C][/ROW]
[ROW][C]20[/C][C]0.369238[/C][C]3.6178[/C][C]0.000238[/C][/ROW]
[ROW][C]21[/C][C]0.342435[/C][C]3.3552[/C][C]0.000569[/C][/ROW]
[ROW][C]22[/C][C]0.322958[/C][C]3.1643[/C][C]0.001041[/C][/ROW]
[ROW][C]23[/C][C]0.303482[/C][C]2.9735[/C][C]0.001861[/C][/ROW]
[ROW][C]24[/C][C]0.284005[/C][C]2.7827[/C][C]0.003246[/C][/ROW]
[ROW][C]25[/C][C]0.254376[/C][C]2.4924[/C][C]0.007201[/C][/ROW]
[ROW][C]26[/C][C]0.224747[/C][C]2.2021[/C][C]0.015028[/C][/ROW]
[ROW][C]27[/C][C]0.195118[/C][C]1.9118[/C][C]0.029445[/C][/ROW]
[ROW][C]28[/C][C]0.170596[/C][C]1.6715[/C][C]0.048941[/C][/ROW]
[ROW][C]29[/C][C]0.146074[/C][C]1.4312[/C][C]0.077807[/C][/ROW]
[ROW][C]30[/C][C]0.121552[/C][C]1.191[/C][C]0.118303[/C][/ROW]
[ROW][C]31[/C][C]0.097029[/C][C]0.9507[/C][C]0.172074[/C][/ROW]
[ROW][C]32[/C][C]0.072507[/C][C]0.7104[/C][C]0.239582[/C][/ROW]
[ROW][C]33[/C][C]0.047985[/C][C]0.4702[/C][C]0.319654[/C][/ROW]
[ROW][C]34[/C][C]0.031963[/C][C]0.3132[/C][C]0.377413[/C][/ROW]
[ROW][C]35[/C][C]0.015942[/C][C]0.1562[/C][C]0.438104[/C][/ROW]
[ROW][C]36[/C][C]-8e-05[/C][C]-8e-04[/C][C]0.499687[/C][/ROW]
[ROW][C]37[/C][C]-0.026984[/C][C]-0.2644[/C][C]0.396022[/C][/ROW]
[ROW][C]38[/C][C]-0.053888[/C][C]-0.528[/C][C]0.29936[/C][/ROW]
[ROW][C]39[/C][C]-0.080793[/C][C]-0.7916[/C][C]0.215272[/C][/ROW]
[ROW][C]40[/C][C]-0.109359[/C][C]-1.0715[/C][C]0.143316[/C][/ROW]
[ROW][C]41[/C][C]-0.137926[/C][C]-1.3514[/C][C]0.089872[/C][/ROW]
[ROW][C]42[/C][C]-0.166493[/C][C]-1.6313[/C][C]0.053053[/C][/ROW]
[ROW][C]43[/C][C]-0.19506[/C][C]-1.9112[/C][C]0.029482[/C][/ROW]
[ROW][C]44[/C][C]-0.223627[/C][C]-2.1911[/C][C]0.015433[/C][/ROW]
[ROW][C]45[/C][C]-0.252194[/C][C]-2.471[/C][C]0.007619[/C][/ROW]
[ROW][C]46[/C][C]-0.262884[/C][C]-2.5757[/C][C]0.005764[/C][/ROW]
[ROW][C]47[/C][C]-0.273574[/C][C]-2.6805[/C][C]0.004327[/C][/ROW]
[ROW][C]48[/C][C]-0.284264[/C][C]-2.7852[/C][C]0.003223[/C][/ROW]
[/TABLE]
Source: https://freestatistics.org/blog/index.php?pk=279211&T=1

Globally Unique Identifier (entire table): ba.freestatistics.org/blog/index.php?pk=279211&T=1

As an alternative you can also use a QR Code:  

The GUIDs for individual cells are displayed in the table below:

Autocorrelation Function
Time lag kACF(k)T-STATP-value
10.9600919.40690
20.9201829.01590
30.8802738.62490
40.8454318.28350
50.810597.94210
60.7757487.60070
70.7409077.25940
80.7060656.9180
90.6712236.57660
100.6482826.35180
110.6253416.12710
120.60245.90230
130.5693525.57850
140.5363045.25470
150.5032574.93092e-06
160.4764534.66835e-06
170.4496494.40561.4e-05
180.4228464.1433.7e-05
190.3960423.88049.6e-05
200.3692383.61780.000238
210.3424353.35520.000569
220.3229583.16430.001041
230.3034822.97350.001861
240.2840052.78270.003246
250.2543762.49240.007201
260.2247472.20210.015028
270.1951181.91180.029445
280.1705961.67150.048941
290.1460741.43120.077807
300.1215521.1910.118303
310.0970290.95070.172074
320.0725070.71040.239582
330.0479850.47020.319654
340.0319630.31320.377413
350.0159420.15620.438104
36-8e-05-8e-040.499687
37-0.026984-0.26440.396022
38-0.053888-0.5280.29936
39-0.080793-0.79160.215272
40-0.109359-1.07150.143316
41-0.137926-1.35140.089872
42-0.166493-1.63130.053053
43-0.19506-1.91120.029482
44-0.223627-2.19110.015433
45-0.252194-2.4710.007619
46-0.262884-2.57570.005764
47-0.273574-2.68050.004327
48-0.284264-2.78520.003223


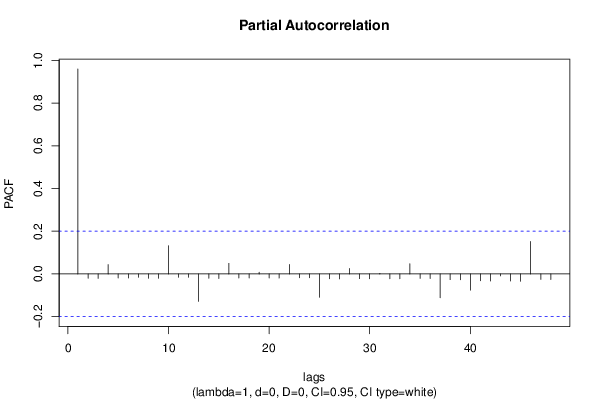
Partial Autocorrelation Function
Time lag kPACF(k)T-STATP-value
10.9600919.40690
2-0.020361-0.19950.421149
3-0.020784-0.20360.419533
40.043610.42730.335061
5-0.019047-0.18660.426176
6-0.019417-0.19020.424759
7-0.015674-0.15360.439134
8-0.020035-0.19630.422394
9-0.020445-0.20030.420828
100.1322151.29540.099138
11-0.01567-0.15350.43915
12-0.015919-0.1560.438189
13-0.128385-1.25790.105737
14-0.020609-0.20190.420201
15-0.021043-0.20620.418545
160.0496390.48640.31391
17-0.019052-0.18670.426155
18-0.019422-0.19030.424738
190.0081010.07940.468451
20-0.01911-0.18720.425933
21-0.019483-0.19090.424507
220.0446140.43710.331502
23-0.017818-0.17460.430887
24-0.018142-0.17780.429646
25-0.109495-1.07280.143019
26-0.022603-0.22150.412601
27-0.023126-0.22660.410614
280.0251990.24690.402756
29-0.021989-0.21540.414938
30-0.022483-0.22030.413056
310.0026090.02560.489831
32-0.022366-0.21910.413501
33-0.022878-0.22420.411555
340.0479560.46990.319757
35-0.020784-0.20360.419532
36-0.021225-0.2080.417848
37-0.111259-1.09010.139196
38-0.02654-0.260.397697
39-0.027263-0.26710.394973
40-0.075878-0.74340.229513
41-0.03174-0.3110.378241
42-0.032781-0.32120.374385
43-0.009275-0.09090.463892
44-0.033394-0.32720.372115
45-0.034548-0.33850.367862
460.1516081.48550.07035
47-0.025452-0.24940.401802
48-0.026116-0.25590.399293

\begin{tabular}{lllllllll}
\hline
Partial Autocorrelation Function \tabularnewline
Time lag k & PACF(k) & T-STAT & P-value \tabularnewline
1 & 0.960091 & 9.4069 & 0 \tabularnewline
2 & -0.020361 & -0.1995 & 0.421149 \tabularnewline
3 & -0.020784 & -0.2036 & 0.419533 \tabularnewline
4 & 0.04361 & 0.4273 & 0.335061 \tabularnewline
5 & -0.019047 & -0.1866 & 0.426176 \tabularnewline
6 & -0.019417 & -0.1902 & 0.424759 \tabularnewline
7 & -0.015674 & -0.1536 & 0.439134 \tabularnewline
8 & -0.020035 & -0.1963 & 0.422394 \tabularnewline
9 & -0.020445 & -0.2003 & 0.420828 \tabularnewline
10 & 0.132215 & 1.2954 & 0.099138 \tabularnewline
11 & -0.01567 & -0.1535 & 0.43915 \tabularnewline
12 & -0.015919 & -0.156 & 0.438189 \tabularnewline
13 & -0.128385 & -1.2579 & 0.105737 \tabularnewline
14 & -0.020609 & -0.2019 & 0.420201 \tabularnewline
15 & -0.021043 & -0.2062 & 0.418545 \tabularnewline
16 & 0.049639 & 0.4864 & 0.31391 \tabularnewline
17 & -0.019052 & -0.1867 & 0.426155 \tabularnewline
18 & -0.019422 & -0.1903 & 0.424738 \tabularnewline
19 & 0.008101 & 0.0794 & 0.468451 \tabularnewline
20 & -0.01911 & -0.1872 & 0.425933 \tabularnewline
21 & -0.019483 & -0.1909 & 0.424507 \tabularnewline
22 & 0.044614 & 0.4371 & 0.331502 \tabularnewline
23 & -0.017818 & -0.1746 & 0.430887 \tabularnewline
24 & -0.018142 & -0.1778 & 0.429646 \tabularnewline
25 & -0.109495 & -1.0728 & 0.143019 \tabularnewline
26 & -0.022603 & -0.2215 & 0.412601 \tabularnewline
27 & -0.023126 & -0.2266 & 0.410614 \tabularnewline
28 & 0.025199 & 0.2469 & 0.402756 \tabularnewline
29 & -0.021989 & -0.2154 & 0.414938 \tabularnewline
30 & -0.022483 & -0.2203 & 0.413056 \tabularnewline
31 & 0.002609 & 0.0256 & 0.489831 \tabularnewline
32 & -0.022366 & -0.2191 & 0.413501 \tabularnewline
33 & -0.022878 & -0.2242 & 0.411555 \tabularnewline
34 & 0.047956 & 0.4699 & 0.319757 \tabularnewline
35 & -0.020784 & -0.2036 & 0.419532 \tabularnewline
36 & -0.021225 & -0.208 & 0.417848 \tabularnewline
37 & -0.111259 & -1.0901 & 0.139196 \tabularnewline
38 & -0.02654 & -0.26 & 0.397697 \tabularnewline
39 & -0.027263 & -0.2671 & 0.394973 \tabularnewline
40 & -0.075878 & -0.7434 & 0.229513 \tabularnewline
41 & -0.03174 & -0.311 & 0.378241 \tabularnewline
42 & -0.032781 & -0.3212 & 0.374385 \tabularnewline
43 & -0.009275 & -0.0909 & 0.463892 \tabularnewline
44 & -0.033394 & -0.3272 & 0.372115 \tabularnewline
45 & -0.034548 & -0.3385 & 0.367862 \tabularnewline
46 & 0.151608 & 1.4855 & 0.07035 \tabularnewline
47 & -0.025452 & -0.2494 & 0.401802 \tabularnewline
48 & -0.026116 & -0.2559 & 0.399293 \tabularnewline
\hline
\end{tabular}
%Source: https://freestatistics.org/blog/index.php?pk=279211&T=2

[TABLE]
[ROW][C]Partial Autocorrelation Function[/C][/ROW]
[ROW][C]Time lag k[/C][C]PACF(k)[/C][C]T-STAT[/C][C]P-value[/C][/ROW]
[ROW][C]1[/C][C]0.960091[/C][C]9.4069[/C][C]0[/C][/ROW]
[ROW][C]2[/C][C]-0.020361[/C][C]-0.1995[/C][C]0.421149[/C][/ROW]
[ROW][C]3[/C][C]-0.020784[/C][C]-0.2036[/C][C]0.419533[/C][/ROW]
[ROW][C]4[/C][C]0.04361[/C][C]0.4273[/C][C]0.335061[/C][/ROW]
[ROW][C]5[/C][C]-0.019047[/C][C]-0.1866[/C][C]0.426176[/C][/ROW]
[ROW][C]6[/C][C]-0.019417[/C][C]-0.1902[/C][C]0.424759[/C][/ROW]
[ROW][C]7[/C][C]-0.015674[/C][C]-0.1536[/C][C]0.439134[/C][/ROW]
[ROW][C]8[/C][C]-0.020035[/C][C]-0.1963[/C][C]0.422394[/C][/ROW]
[ROW][C]9[/C][C]-0.020445[/C][C]-0.2003[/C][C]0.420828[/C][/ROW]
[ROW][C]10[/C][C]0.132215[/C][C]1.2954[/C][C]0.099138[/C][/ROW]
[ROW][C]11[/C][C]-0.01567[/C][C]-0.1535[/C][C]0.43915[/C][/ROW]
[ROW][C]12[/C][C]-0.015919[/C][C]-0.156[/C][C]0.438189[/C][/ROW]
[ROW][C]13[/C][C]-0.128385[/C][C]-1.2579[/C][C]0.105737[/C][/ROW]
[ROW][C]14[/C][C]-0.020609[/C][C]-0.2019[/C][C]0.420201[/C][/ROW]
[ROW][C]15[/C][C]-0.021043[/C][C]-0.2062[/C][C]0.418545[/C][/ROW]
[ROW][C]16[/C][C]0.049639[/C][C]0.4864[/C][C]0.31391[/C][/ROW]
[ROW][C]17[/C][C]-0.019052[/C][C]-0.1867[/C][C]0.426155[/C][/ROW]
[ROW][C]18[/C][C]-0.019422[/C][C]-0.1903[/C][C]0.424738[/C][/ROW]
[ROW][C]19[/C][C]0.008101[/C][C]0.0794[/C][C]0.468451[/C][/ROW]
[ROW][C]20[/C][C]-0.01911[/C][C]-0.1872[/C][C]0.425933[/C][/ROW]
[ROW][C]21[/C][C]-0.019483[/C][C]-0.1909[/C][C]0.424507[/C][/ROW]
[ROW][C]22[/C][C]0.044614[/C][C]0.4371[/C][C]0.331502[/C][/ROW]
[ROW][C]23[/C][C]-0.017818[/C][C]-0.1746[/C][C]0.430887[/C][/ROW]
[ROW][C]24[/C][C]-0.018142[/C][C]-0.1778[/C][C]0.429646[/C][/ROW]
[ROW][C]25[/C][C]-0.109495[/C][C]-1.0728[/C][C]0.143019[/C][/ROW]
[ROW][C]26[/C][C]-0.022603[/C][C]-0.2215[/C][C]0.412601[/C][/ROW]
[ROW][C]27[/C][C]-0.023126[/C][C]-0.2266[/C][C]0.410614[/C][/ROW]
[ROW][C]28[/C][C]0.025199[/C][C]0.2469[/C][C]0.402756[/C][/ROW]
[ROW][C]29[/C][C]-0.021989[/C][C]-0.2154[/C][C]0.414938[/C][/ROW]
[ROW][C]30[/C][C]-0.022483[/C][C]-0.2203[/C][C]0.413056[/C][/ROW]
[ROW][C]31[/C][C]0.002609[/C][C]0.0256[/C][C]0.489831[/C][/ROW]
[ROW][C]32[/C][C]-0.022366[/C][C]-0.2191[/C][C]0.413501[/C][/ROW]
[ROW][C]33[/C][C]-0.022878[/C][C]-0.2242[/C][C]0.411555[/C][/ROW]
[ROW][C]34[/C][C]0.047956[/C][C]0.4699[/C][C]0.319757[/C][/ROW]
[ROW][C]35[/C][C]-0.020784[/C][C]-0.2036[/C][C]0.419532[/C][/ROW]
[ROW][C]36[/C][C]-0.021225[/C][C]-0.208[/C][C]0.417848[/C][/ROW]
[ROW][C]37[/C][C]-0.111259[/C][C]-1.0901[/C][C]0.139196[/C][/ROW]
[ROW][C]38[/C][C]-0.02654[/C][C]-0.26[/C][C]0.397697[/C][/ROW]
[ROW][C]39[/C][C]-0.027263[/C][C]-0.2671[/C][C]0.394973[/C][/ROW]
[ROW][C]40[/C][C]-0.075878[/C][C]-0.7434[/C][C]0.229513[/C][/ROW]
[ROW][C]41[/C][C]-0.03174[/C][C]-0.311[/C][C]0.378241[/C][/ROW]
[ROW][C]42[/C][C]-0.032781[/C][C]-0.3212[/C][C]0.374385[/C][/ROW]
[ROW][C]43[/C][C]-0.009275[/C][C]-0.0909[/C][C]0.463892[/C][/ROW]
[ROW][C]44[/C][C]-0.033394[/C][C]-0.3272[/C][C]0.372115[/C][/ROW]
[ROW][C]45[/C][C]-0.034548[/C][C]-0.3385[/C][C]0.367862[/C][/ROW]
[ROW][C]46[/C][C]0.151608[/C][C]1.4855[/C][C]0.07035[/C][/ROW]
[ROW][C]47[/C][C]-0.025452[/C][C]-0.2494[/C][C]0.401802[/C][/ROW]
[ROW][C]48[/C][C]-0.026116[/C][C]-0.2559[/C][C]0.399293[/C][/ROW]
[/TABLE]
Source: https://freestatistics.org/blog/index.php?pk=279211&T=2

Globally Unique Identifier (entire table): ba.freestatistics.org/blog/index.php?pk=279211&T=2

As an alternative you can also use a QR Code:  

The GUIDs for individual cells are displayed in the table below:

Partial Autocorrelation Function
Time lag kPACF(k)T-STATP-value
10.9600919.40690
2-0.020361-0.19950.421149
3-0.020784-0.20360.419533
40.043610.42730.335061
5-0.019047-0.18660.426176
6-0.019417-0.19020.424759
7-0.015674-0.15360.439134
8-0.020035-0.19630.422394
9-0.020445-0.20030.420828
100.1322151.29540.099138
11-0.01567-0.15350.43915
12-0.015919-0.1560.438189
13-0.128385-1.25790.105737
14-0.020609-0.20190.420201
15-0.021043-0.20620.418545
160.0496390.48640.31391
17-0.019052-0.18670.426155
18-0.019422-0.19030.424738
190.0081010.07940.468451
20-0.01911-0.18720.425933
21-0.019483-0.19090.424507
220.0446140.43710.331502
23-0.017818-0.17460.430887
24-0.018142-0.17780.429646
25-0.109495-1.07280.143019
26-0.022603-0.22150.412601
27-0.023126-0.22660.410614
280.0251990.24690.402756
29-0.021989-0.21540.414938
30-0.022483-0.22030.413056
310.0026090.02560.489831
32-0.022366-0.21910.413501
33-0.022878-0.22420.411555
340.0479560.46990.319757
35-0.020784-0.20360.419532
36-0.021225-0.2080.417848
37-0.111259-1.09010.139196
38-0.02654-0.260.397697
39-0.027263-0.26710.394973
40-0.075878-0.74340.229513
41-0.03174-0.3110.378241
42-0.032781-0.32120.374385
43-0.009275-0.09090.463892
44-0.033394-0.32720.372115
45-0.034548-0.33850.367862
460.1516081.48550.07035
47-0.025452-0.24940.401802
48-0.026116-0.25590.399293


Parameters (Session):
par1 = 48 ; par2 = 1 ; par3 = 0 ; par4 = 0 ; par5 = 12 ; par6 = White Noise ; par7 = 0.95 ;
Parameters (R input):
par1 = 48 ; par2 = 1 ; par3 = 0 ; par4 = 0 ; par5 = 12 ; par6 = White Noise ; par7 = 0.95 ; par8 = ;
R code (references can be found in the software module):
if (par1 == 'Default') {
par1 = 10*log10(length(x))
} else {
par1 <- as.numeric(par1)
}
par2 <- as.numeric(par2)
par3 <- as.numeric(par3)
par4 <- as.numeric(par4)
par5 <- as.numeric(par5)
if (par6 == 'White Noise') par6 <- 'white' else par6 <- 'ma'
par7 <- as.numeric(par7)
if (par8 != '') par8 <- as.numeric(par8)
ox <- x
if (par8 == '') {
if (par2 == 0) {
x <- log(x)
} else {
x <- (x ^ par2 - 1) / par2
}
} else {
x <- log(x,base=par8)
}
if (par3 > 0) x <- diff(x,lag=1,difference=par3)
if (par4 > 0) x <- diff(x,lag=par5,difference=par4)
bitmap(file='picts.png')
op <- par(mfrow=c(2,1))
plot(ox,type='l',main='Original Time Series',xlab='time',ylab='value')
if (par8=='') {
mytitle <- paste('Working Time Series (lambda=',par2,', d=',par3,', D=',par4,')',sep='')
mysub <- paste('(lambda=',par2,', d=',par3,', D=',par4,', CI=', par7, ', CI type=',par6,')',sep='')
} else {
mytitle <- paste('Working Time Series (base=',par8,', d=',par3,', D=',par4,')',sep='')
mysub <- paste('(base=',par8,', d=',par3,', D=',par4,', CI=', par7, ', CI type=',par6,')',sep='')
}
plot(x,type='l', main=mytitle,xlab='time',ylab='value')
par(op)
dev.off()
bitmap(file='pic1.png')
racf <- acf(x, par1, main='Autocorrelation', xlab='time lag', ylab='ACF', ci.type=par6, ci=par7, sub=mysub)
dev.off()
bitmap(file='pic2.png')
rpacf <- pacf(x,par1,main='Partial Autocorrelation',xlab='lags',ylab='PACF',sub=mysub)
dev.off()
(myacf <- c(racf$acf))
(mypacf <- c(rpacf$acf))
lengthx <- length(x)
sqrtn <- sqrt(lengthx)
load(file='createtable')
a<-table.start()
a<-table.row.start(a)
a<-table.element(a,'Autocorrelation Function',4,TRUE)
a<-table.row.end(a)
a<-table.row.start(a)
a<-table.element(a,'Time lag k',header=TRUE)
a<-table.element(a,hyperlink('basics.htm','ACF(k)','click here for more information about the Autocorrelation Function'),header=TRUE)
a<-table.element(a,'T-STAT',header=TRUE)
a<-table.element(a,'P-value',header=TRUE)
a<-table.row.end(a)
for (i in 2:(par1+1)) {
a<-table.row.start(a)
a<-table.element(a,i-1,header=TRUE)
a<-table.element(a,round(myacf[i],6))
mytstat <- myacf[i]*sqrtn
a<-table.element(a,round(mytstat,4))
a<-table.element(a,round(1-pt(abs(mytstat),lengthx),6))
a<-table.row.end(a)
}
a<-table.end(a)
table.save(a,file='mytable.tab')
a<-table.start()
a<-table.row.start(a)
a<-table.element(a,'Partial Autocorrelation Function',4,TRUE)
a<-table.row.end(a)
a<-table.row.start(a)
a<-table.element(a,'Time lag k',header=TRUE)
a<-table.element(a,hyperlink('basics.htm','PACF(k)','click here for more information about the Partial Autocorrelation Function'),header=TRUE)
a<-table.element(a,'T-STAT',header=TRUE)
a<-table.element(a,'P-value',header=TRUE)
a<-table.row.end(a)
for (i in 1:par1) {
a<-table.row.start(a)
a<-table.element(a,i,header=TRUE)
a<-table.element(a,round(mypacf[i],6))
mytstat <- mypacf[i]*sqrtn
a<-table.element(a,round(mytstat,4))
a<-table.element(a,round(1-pt(abs(mytstat),lengthx),6))
a<-table.row.end(a)
}
a<-table.end(a)
table.save(a,file='mytable1.tab')