Free Statistics

of Irreproducible Research!

Author's title

Author*Unverified author*
R Software Modulerwasp_exponentialsmoothing.wasp
Title produced by softwareExponential Smoothing
Date of computationSun, 29 Nov 2015 16:34:28 +0000
Cite this page as followsStatistical Computations at FreeStatistics.org, Office for Research Development and Education, URL https://freestatistics.org/blog/index.php?v=date/2015/Nov/29/t14488152663wa7jlimxk04clz.htm/, Retrieved Sat, 18 May 2024 09:27:59 +0000
Statistical Computations at FreeStatistics.org, Office for Research Development and Education, URL https://freestatistics.org/blog/index.php?pk=284494, Retrieved Sat, 18 May 2024 09:27:59 +0000
QR Codes:

Original text written by user:
IsPrivate?No (this computation is public)
User-defined keywords
Estimated Impact68
Family? (F = Feedback message, R = changed R code, M = changed R Module, P = changed Parameters, D = changed Data)
-       [Exponential Smoothing] [exponential smoot...] [2015-11-29 16:34:28] [2d6a838730984919764007611a305b0c] [Current]
Feedback Forum

Post a new message
Dataseries X:
98,4
98,1
97,5
97,7
98,2
98,9
99,9
100,9
101,8
102,1
103,1
103,4
105,5
106,7
106,9
107,2
107,7
107,3
107,2
107,1
106,6
106,6
106,5
106,7
106,3
108,9
109,9
110,8
110,5
111,2
111,4
112,2
113,2
114
114,2
114,6
115,9
116,1
116,4
116,7
117,9
118,1
118,3
118,8
118,4
118
117,9
117,9
117,9
117,3
117,8
117,8
117,8
117,6
117,3
116,3
114,3
113,8
113,5
114,7


Summary of computational transaction
Raw Inputview raw input (R code)
Raw Outputview raw output of R engine
Computing time2 seconds
R Server'Sir Maurice George Kendall' @ kendall.wessa.net

\begin{tabular}{lllllllll}
\hline
Summary of computational transaction \tabularnewline
Raw Input & view raw input (R code)  \tabularnewline
Raw Output & view raw output of R engine  \tabularnewline
Computing time & 2 seconds \tabularnewline
R Server & 'Sir Maurice George Kendall' @ kendall.wessa.net \tabularnewline
\hline
\end{tabular}
%Source: https://freestatistics.org/blog/index.php?pk=284494&T=0

[TABLE]
[ROW][C]Summary of computational transaction[/C][/ROW]
[ROW][C]Raw Input[/C][C]view raw input (R code) [/C][/ROW]
[ROW][C]Raw Output[/C][C]view raw output of R engine [/C][/ROW]
[ROW][C]Computing time[/C][C]2 seconds[/C][/ROW]
[ROW][C]R Server[/C][C]'Sir Maurice George Kendall' @ kendall.wessa.net[/C][/ROW]
[/TABLE]
Source: https://freestatistics.org/blog/index.php?pk=284494&T=0

Globally Unique Identifier (entire table): ba.freestatistics.org/blog/index.php?pk=284494&T=0

As an alternative you can also use a QR Code:  

The GUIDs for individual cells are displayed in the table below:

Summary of computational transaction
Raw Inputview raw input (R code)
Raw Outputview raw output of R engine
Computing time2 seconds
R Server'Sir Maurice George Kendall' @ kendall.wessa.net


Estimated Parameters of Exponential Smoothing
ParameterValue
alpha1
beta0.0652565748608493
gamma0.0201171718294623

\begin{tabular}{lllllllll}
\hline
Estimated Parameters of Exponential Smoothing \tabularnewline
Parameter & Value \tabularnewline
alpha & 1 \tabularnewline
beta & 0.0652565748608493 \tabularnewline
gamma & 0.0201171718294623 \tabularnewline
\hline
\end{tabular}
%Source: https://freestatistics.org/blog/index.php?pk=284494&T=1

[TABLE]
[ROW][C]Estimated Parameters of Exponential Smoothing[/C][/ROW]
[ROW][C]Parameter[/C][C]Value[/C][/ROW]
[ROW][C]alpha[/C][C]1[/C][/ROW]
[ROW][C]beta[/C][C]0.0652565748608493[/C][/ROW]
[ROW][C]gamma[/C][C]0.0201171718294623[/C][/ROW]
[/TABLE]
Source: https://freestatistics.org/blog/index.php?pk=284494&T=1

Globally Unique Identifier (entire table): ba.freestatistics.org/blog/index.php?pk=284494&T=1

As an alternative you can also use a QR Code:  

The GUIDs for individual cells are displayed in the table below:

Estimated Parameters of Exponential Smoothing
ParameterValue
alpha1
beta0.0652565748608493
gamma0.0201171718294623


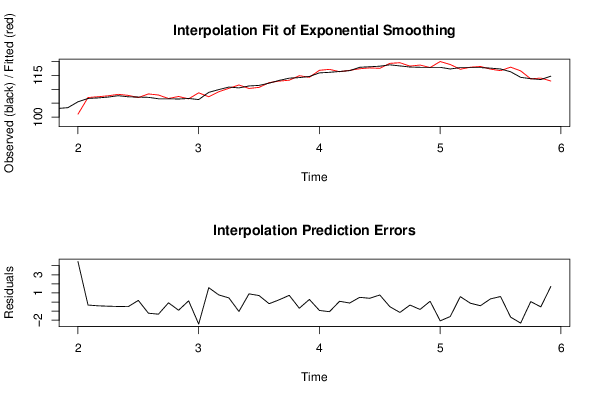
Interpolation Forecasts of Exponential Smoothing
tObservedFittedResiduals
13105.5101.0373723160034.46262768399724
14106.7107.03328630764-0.333286307639895
15106.9107.316116982616-0.416116982616344
16107.2107.660205589634-0.460205589634455
17107.7108.18988054806-0.489880548059588
18107.3107.805301384527-0.505301384527002
19107.2107.0206203111320.179379688868323
20107.1108.331661804124-1.23166180412447
21106.6107.939275611604-1.33927561160382
22106.6106.683251914292-0.0832519142922195
23106.5107.405338879654-0.905338879654295
24106.7106.5691458240550.130854175944634
25106.3108.727710279768-2.42771027976765
26108.9107.3193667029721.5806332970283
27109.9109.11785708890.782142911099527
28110.8110.3432736683280.456726331671874
29110.5111.540561513867-1.0405615138669
30111.2110.2985834432350.901416556764573
31111.4110.6880178466250.711982153375146
32112.2112.385076649589-0.185076649588865
33113.2112.953841005270.246158994729683
34114113.2622699162030.737730083796706
35114.2114.884674982686-0.684674982685792
36114.6114.3143840898510.285615910148735
37115.9116.827313474915-0.927313474914712
38116.1117.165226547269-1.06522654726889
39116.4116.3159345280180.0840654719819867
40116.7116.808038094918-0.108038094918072
41117.9117.3831190096910.516880990308593
42118.1117.6865955641990.413404435801482
43118.3117.5249996542860.77500034571365
44118.8119.316033869809-0.516033869808638
45118.4119.54903426004-1.1490342600402
46118118.33240718929-0.33240718929035
47117.9118.717584847508-0.817584847507547
48117.9117.8153535323820.0846464676176311
49117.9119.974252076691-2.07425207669138
50117.3118.901642735092-1.60164273509154
51117.8117.2032115903650.596788409634755
52117.8117.930775074464-0.130775074464054
53117.8118.206851600934-0.406851600934388
54117.6117.2511064472830.348893552716504
55117.3116.6926981185590.607301881440932
56116.3117.963340423816-1.66334042381565
57114.3116.620610904893-2.32061090489279
58113.8113.7531285856490.0468714143511022
59113.5114.033942322548-0.533942322547503
60114.7112.9796368872361.72036311276391

\begin{tabular}{lllllllll}
\hline
Interpolation Forecasts of Exponential Smoothing \tabularnewline
t & Observed & Fitted & Residuals \tabularnewline
13 & 105.5 & 101.037372316003 & 4.46262768399724 \tabularnewline
14 & 106.7 & 107.03328630764 & -0.333286307639895 \tabularnewline
15 & 106.9 & 107.316116982616 & -0.416116982616344 \tabularnewline
16 & 107.2 & 107.660205589634 & -0.460205589634455 \tabularnewline
17 & 107.7 & 108.18988054806 & -0.489880548059588 \tabularnewline
18 & 107.3 & 107.805301384527 & -0.505301384527002 \tabularnewline
19 & 107.2 & 107.020620311132 & 0.179379688868323 \tabularnewline
20 & 107.1 & 108.331661804124 & -1.23166180412447 \tabularnewline
21 & 106.6 & 107.939275611604 & -1.33927561160382 \tabularnewline
22 & 106.6 & 106.683251914292 & -0.0832519142922195 \tabularnewline
23 & 106.5 & 107.405338879654 & -0.905338879654295 \tabularnewline
24 & 106.7 & 106.569145824055 & 0.130854175944634 \tabularnewline
25 & 106.3 & 108.727710279768 & -2.42771027976765 \tabularnewline
26 & 108.9 & 107.319366702972 & 1.5806332970283 \tabularnewline
27 & 109.9 & 109.1178570889 & 0.782142911099527 \tabularnewline
28 & 110.8 & 110.343273668328 & 0.456726331671874 \tabularnewline
29 & 110.5 & 111.540561513867 & -1.0405615138669 \tabularnewline
30 & 111.2 & 110.298583443235 & 0.901416556764573 \tabularnewline
31 & 111.4 & 110.688017846625 & 0.711982153375146 \tabularnewline
32 & 112.2 & 112.385076649589 & -0.185076649588865 \tabularnewline
33 & 113.2 & 112.95384100527 & 0.246158994729683 \tabularnewline
34 & 114 & 113.262269916203 & 0.737730083796706 \tabularnewline
35 & 114.2 & 114.884674982686 & -0.684674982685792 \tabularnewline
36 & 114.6 & 114.314384089851 & 0.285615910148735 \tabularnewline
37 & 115.9 & 116.827313474915 & -0.927313474914712 \tabularnewline
38 & 116.1 & 117.165226547269 & -1.06522654726889 \tabularnewline
39 & 116.4 & 116.315934528018 & 0.0840654719819867 \tabularnewline
40 & 116.7 & 116.808038094918 & -0.108038094918072 \tabularnewline
41 & 117.9 & 117.383119009691 & 0.516880990308593 \tabularnewline
42 & 118.1 & 117.686595564199 & 0.413404435801482 \tabularnewline
43 & 118.3 & 117.524999654286 & 0.77500034571365 \tabularnewline
44 & 118.8 & 119.316033869809 & -0.516033869808638 \tabularnewline
45 & 118.4 & 119.54903426004 & -1.1490342600402 \tabularnewline
46 & 118 & 118.33240718929 & -0.33240718929035 \tabularnewline
47 & 117.9 & 118.717584847508 & -0.817584847507547 \tabularnewline
48 & 117.9 & 117.815353532382 & 0.0846464676176311 \tabularnewline
49 & 117.9 & 119.974252076691 & -2.07425207669138 \tabularnewline
50 & 117.3 & 118.901642735092 & -1.60164273509154 \tabularnewline
51 & 117.8 & 117.203211590365 & 0.596788409634755 \tabularnewline
52 & 117.8 & 117.930775074464 & -0.130775074464054 \tabularnewline
53 & 117.8 & 118.206851600934 & -0.406851600934388 \tabularnewline
54 & 117.6 & 117.251106447283 & 0.348893552716504 \tabularnewline
55 & 117.3 & 116.692698118559 & 0.607301881440932 \tabularnewline
56 & 116.3 & 117.963340423816 & -1.66334042381565 \tabularnewline
57 & 114.3 & 116.620610904893 & -2.32061090489279 \tabularnewline
58 & 113.8 & 113.753128585649 & 0.0468714143511022 \tabularnewline
59 & 113.5 & 114.033942322548 & -0.533942322547503 \tabularnewline
60 & 114.7 & 112.979636887236 & 1.72036311276391 \tabularnewline
\hline
\end{tabular}
%Source: https://freestatistics.org/blog/index.php?pk=284494&T=2

[TABLE]
[ROW][C]Interpolation Forecasts of Exponential Smoothing[/C][/ROW]
[ROW][C]t[/C][C]Observed[/C][C]Fitted[/C][C]Residuals[/C][/ROW]
[ROW][C]13[/C][C]105.5[/C][C]101.037372316003[/C][C]4.46262768399724[/C][/ROW]
[ROW][C]14[/C][C]106.7[/C][C]107.03328630764[/C][C]-0.333286307639895[/C][/ROW]
[ROW][C]15[/C][C]106.9[/C][C]107.316116982616[/C][C]-0.416116982616344[/C][/ROW]
[ROW][C]16[/C][C]107.2[/C][C]107.660205589634[/C][C]-0.460205589634455[/C][/ROW]
[ROW][C]17[/C][C]107.7[/C][C]108.18988054806[/C][C]-0.489880548059588[/C][/ROW]
[ROW][C]18[/C][C]107.3[/C][C]107.805301384527[/C][C]-0.505301384527002[/C][/ROW]
[ROW][C]19[/C][C]107.2[/C][C]107.020620311132[/C][C]0.179379688868323[/C][/ROW]
[ROW][C]20[/C][C]107.1[/C][C]108.331661804124[/C][C]-1.23166180412447[/C][/ROW]
[ROW][C]21[/C][C]106.6[/C][C]107.939275611604[/C][C]-1.33927561160382[/C][/ROW]
[ROW][C]22[/C][C]106.6[/C][C]106.683251914292[/C][C]-0.0832519142922195[/C][/ROW]
[ROW][C]23[/C][C]106.5[/C][C]107.405338879654[/C][C]-0.905338879654295[/C][/ROW]
[ROW][C]24[/C][C]106.7[/C][C]106.569145824055[/C][C]0.130854175944634[/C][/ROW]
[ROW][C]25[/C][C]106.3[/C][C]108.727710279768[/C][C]-2.42771027976765[/C][/ROW]
[ROW][C]26[/C][C]108.9[/C][C]107.319366702972[/C][C]1.5806332970283[/C][/ROW]
[ROW][C]27[/C][C]109.9[/C][C]109.1178570889[/C][C]0.782142911099527[/C][/ROW]
[ROW][C]28[/C][C]110.8[/C][C]110.343273668328[/C][C]0.456726331671874[/C][/ROW]
[ROW][C]29[/C][C]110.5[/C][C]111.540561513867[/C][C]-1.0405615138669[/C][/ROW]
[ROW][C]30[/C][C]111.2[/C][C]110.298583443235[/C][C]0.901416556764573[/C][/ROW]
[ROW][C]31[/C][C]111.4[/C][C]110.688017846625[/C][C]0.711982153375146[/C][/ROW]
[ROW][C]32[/C][C]112.2[/C][C]112.385076649589[/C][C]-0.185076649588865[/C][/ROW]
[ROW][C]33[/C][C]113.2[/C][C]112.95384100527[/C][C]0.246158994729683[/C][/ROW]
[ROW][C]34[/C][C]114[/C][C]113.262269916203[/C][C]0.737730083796706[/C][/ROW]
[ROW][C]35[/C][C]114.2[/C][C]114.884674982686[/C][C]-0.684674982685792[/C][/ROW]
[ROW][C]36[/C][C]114.6[/C][C]114.314384089851[/C][C]0.285615910148735[/C][/ROW]
[ROW][C]37[/C][C]115.9[/C][C]116.827313474915[/C][C]-0.927313474914712[/C][/ROW]
[ROW][C]38[/C][C]116.1[/C][C]117.165226547269[/C][C]-1.06522654726889[/C][/ROW]
[ROW][C]39[/C][C]116.4[/C][C]116.315934528018[/C][C]0.0840654719819867[/C][/ROW]
[ROW][C]40[/C][C]116.7[/C][C]116.808038094918[/C][C]-0.108038094918072[/C][/ROW]
[ROW][C]41[/C][C]117.9[/C][C]117.383119009691[/C][C]0.516880990308593[/C][/ROW]
[ROW][C]42[/C][C]118.1[/C][C]117.686595564199[/C][C]0.413404435801482[/C][/ROW]
[ROW][C]43[/C][C]118.3[/C][C]117.524999654286[/C][C]0.77500034571365[/C][/ROW]
[ROW][C]44[/C][C]118.8[/C][C]119.316033869809[/C][C]-0.516033869808638[/C][/ROW]
[ROW][C]45[/C][C]118.4[/C][C]119.54903426004[/C][C]-1.1490342600402[/C][/ROW]
[ROW][C]46[/C][C]118[/C][C]118.33240718929[/C][C]-0.33240718929035[/C][/ROW]
[ROW][C]47[/C][C]117.9[/C][C]118.717584847508[/C][C]-0.817584847507547[/C][/ROW]
[ROW][C]48[/C][C]117.9[/C][C]117.815353532382[/C][C]0.0846464676176311[/C][/ROW]
[ROW][C]49[/C][C]117.9[/C][C]119.974252076691[/C][C]-2.07425207669138[/C][/ROW]
[ROW][C]50[/C][C]117.3[/C][C]118.901642735092[/C][C]-1.60164273509154[/C][/ROW]
[ROW][C]51[/C][C]117.8[/C][C]117.203211590365[/C][C]0.596788409634755[/C][/ROW]
[ROW][C]52[/C][C]117.8[/C][C]117.930775074464[/C][C]-0.130775074464054[/C][/ROW]
[ROW][C]53[/C][C]117.8[/C][C]118.206851600934[/C][C]-0.406851600934388[/C][/ROW]
[ROW][C]54[/C][C]117.6[/C][C]117.251106447283[/C][C]0.348893552716504[/C][/ROW]
[ROW][C]55[/C][C]117.3[/C][C]116.692698118559[/C][C]0.607301881440932[/C][/ROW]
[ROW][C]56[/C][C]116.3[/C][C]117.963340423816[/C][C]-1.66334042381565[/C][/ROW]
[ROW][C]57[/C][C]114.3[/C][C]116.620610904893[/C][C]-2.32061090489279[/C][/ROW]
[ROW][C]58[/C][C]113.8[/C][C]113.753128585649[/C][C]0.0468714143511022[/C][/ROW]
[ROW][C]59[/C][C]113.5[/C][C]114.033942322548[/C][C]-0.533942322547503[/C][/ROW]
[ROW][C]60[/C][C]114.7[/C][C]112.979636887236[/C][C]1.72036311276391[/C][/ROW]
[/TABLE]
Source: https://freestatistics.org/blog/index.php?pk=284494&T=2

Globally Unique Identifier (entire table): ba.freestatistics.org/blog/index.php?pk=284494&T=2

As an alternative you can also use a QR Code:  

The GUIDs for individual cells are displayed in the table below:

Interpolation Forecasts of Exponential Smoothing
tObservedFittedResiduals
13105.5101.0373723160034.46262768399724
14106.7107.03328630764-0.333286307639895
15106.9107.316116982616-0.416116982616344
16107.2107.660205589634-0.460205589634455
17107.7108.18988054806-0.489880548059588
18107.3107.805301384527-0.505301384527002
19107.2107.0206203111320.179379688868323
20107.1108.331661804124-1.23166180412447
21106.6107.939275611604-1.33927561160382
22106.6106.683251914292-0.0832519142922195
23106.5107.405338879654-0.905338879654295
24106.7106.5691458240550.130854175944634
25106.3108.727710279768-2.42771027976765
26108.9107.3193667029721.5806332970283
27109.9109.11785708890.782142911099527
28110.8110.3432736683280.456726331671874
29110.5111.540561513867-1.0405615138669
30111.2110.2985834432350.901416556764573
31111.4110.6880178466250.711982153375146
32112.2112.385076649589-0.185076649588865
33113.2112.953841005270.246158994729683
34114113.2622699162030.737730083796706
35114.2114.884674982686-0.684674982685792
36114.6114.3143840898510.285615910148735
37115.9116.827313474915-0.927313474914712
38116.1117.165226547269-1.06522654726889
39116.4116.3159345280180.0840654719819867
40116.7116.808038094918-0.108038094918072
41117.9117.3831190096910.516880990308593
42118.1117.6865955641990.413404435801482
43118.3117.5249996542860.77500034571365
44118.8119.316033869809-0.516033869808638
45118.4119.54903426004-1.1490342600402
46118118.33240718929-0.33240718929035
47117.9118.717584847508-0.817584847507547
48117.9117.8153535323820.0846464676176311
49117.9119.974252076691-2.07425207669138
50117.3118.901642735092-1.60164273509154
51117.8117.2032115903650.596788409634755
52117.8117.930775074464-0.130775074464054
53117.8118.206851600934-0.406851600934388
54117.6117.2511064472830.348893552716504
55117.3116.6926981185590.607301881440932
56116.3117.963340423816-1.66334042381565
57114.3116.620610904893-2.32061090489279
58113.8113.7531285856490.0468714143511022
59113.5114.033942322548-0.533942322547503
60114.7112.9796368872361.72036311276391


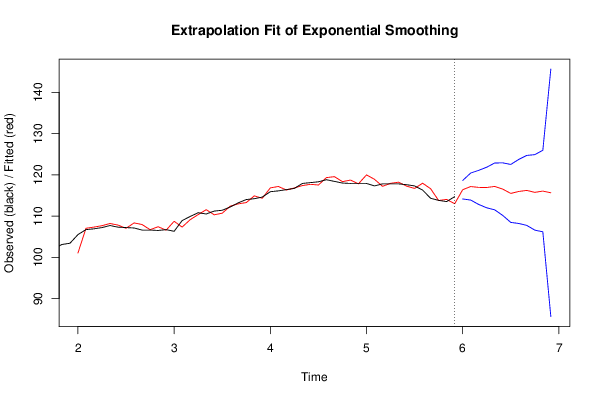
Extrapolation Forecasts of Exponential Smoothing
tForecast95% Lower Bound95% Upper Bound
61116.377008369768114.139423124587118.614593614949
62117.15096516471113.871273960924120.430656368497
63116.940748781731112.805055395807121.076442167655
64116.919650222455111.997071486363121.842228958546
65117.18083155996111.499621055182122.862042064738
66116.518845704026110.14420431937122.893487088683
67115.483436343058108.452990347013122.513882339103
68115.961796868925108.1967583062123.72683543165
69116.211662168639107.727131845727124.696192491551
70115.736495491336106.584612882538124.888378100135
71116.052319657771106.170999654379125.933639661163
72115.63329553572685.5997701329691145.666820938483

\begin{tabular}{lllllllll}
\hline
Extrapolation Forecasts of Exponential Smoothing \tabularnewline
t & Forecast & 95% Lower Bound & 95% Upper Bound \tabularnewline
61 & 116.377008369768 & 114.139423124587 & 118.614593614949 \tabularnewline
62 & 117.15096516471 & 113.871273960924 & 120.430656368497 \tabularnewline
63 & 116.940748781731 & 112.805055395807 & 121.076442167655 \tabularnewline
64 & 116.919650222455 & 111.997071486363 & 121.842228958546 \tabularnewline
65 & 117.18083155996 & 111.499621055182 & 122.862042064738 \tabularnewline
66 & 116.518845704026 & 110.14420431937 & 122.893487088683 \tabularnewline
67 & 115.483436343058 & 108.452990347013 & 122.513882339103 \tabularnewline
68 & 115.961796868925 & 108.1967583062 & 123.72683543165 \tabularnewline
69 & 116.211662168639 & 107.727131845727 & 124.696192491551 \tabularnewline
70 & 115.736495491336 & 106.584612882538 & 124.888378100135 \tabularnewline
71 & 116.052319657771 & 106.170999654379 & 125.933639661163 \tabularnewline
72 & 115.633295535726 & 85.5997701329691 & 145.666820938483 \tabularnewline
\hline
\end{tabular}
%Source: https://freestatistics.org/blog/index.php?pk=284494&T=3

[TABLE]
[ROW][C]Extrapolation Forecasts of Exponential Smoothing[/C][/ROW]
[ROW][C]t[/C][C]Forecast[/C][C]95% Lower Bound[/C][C]95% Upper Bound[/C][/ROW]
[ROW][C]61[/C][C]116.377008369768[/C][C]114.139423124587[/C][C]118.614593614949[/C][/ROW]
[ROW][C]62[/C][C]117.15096516471[/C][C]113.871273960924[/C][C]120.430656368497[/C][/ROW]
[ROW][C]63[/C][C]116.940748781731[/C][C]112.805055395807[/C][C]121.076442167655[/C][/ROW]
[ROW][C]64[/C][C]116.919650222455[/C][C]111.997071486363[/C][C]121.842228958546[/C][/ROW]
[ROW][C]65[/C][C]117.18083155996[/C][C]111.499621055182[/C][C]122.862042064738[/C][/ROW]
[ROW][C]66[/C][C]116.518845704026[/C][C]110.14420431937[/C][C]122.893487088683[/C][/ROW]
[ROW][C]67[/C][C]115.483436343058[/C][C]108.452990347013[/C][C]122.513882339103[/C][/ROW]
[ROW][C]68[/C][C]115.961796868925[/C][C]108.1967583062[/C][C]123.72683543165[/C][/ROW]
[ROW][C]69[/C][C]116.211662168639[/C][C]107.727131845727[/C][C]124.696192491551[/C][/ROW]
[ROW][C]70[/C][C]115.736495491336[/C][C]106.584612882538[/C][C]124.888378100135[/C][/ROW]
[ROW][C]71[/C][C]116.052319657771[/C][C]106.170999654379[/C][C]125.933639661163[/C][/ROW]
[ROW][C]72[/C][C]115.633295535726[/C][C]85.5997701329691[/C][C]145.666820938483[/C][/ROW]
[/TABLE]
Source: https://freestatistics.org/blog/index.php?pk=284494&T=3

Globally Unique Identifier (entire table): ba.freestatistics.org/blog/index.php?pk=284494&T=3

As an alternative you can also use a QR Code:  

The GUIDs for individual cells are displayed in the table below:

Extrapolation Forecasts of Exponential Smoothing
tForecast95% Lower Bound95% Upper Bound
61116.377008369768114.139423124587118.614593614949
62117.15096516471113.871273960924120.430656368497
63116.940748781731112.805055395807121.076442167655
64116.919650222455111.997071486363121.842228958546
65117.18083155996111.499621055182122.862042064738
66116.518845704026110.14420431937122.893487088683
67115.483436343058108.452990347013122.513882339103
68115.961796868925108.1967583062123.72683543165
69116.211662168639107.727131845727124.696192491551
70115.736495491336106.584612882538124.888378100135
71116.052319657771106.170999654379125.933639661163
72115.63329553572685.5997701329691145.666820938483


Parameters (Session):
par1 = 12 ; par2 = Triple ; par3 = multiplicative ;
Parameters (R input):
par1 = 12 ; par2 = Triple ; par3 = multiplicative ;
R code (references can be found in the software module):
par1 <- as.numeric(par1)
if (par2 == 'Single') K <- 1
if (par2 == 'Double') K <- 2
if (par2 == 'Triple') K <- par1
nx <- length(x)
nxmK <- nx - K
x <- ts(x, frequency = par1)
if (par2 == 'Single') fit <- HoltWinters(x, gamma=F, beta=F)
if (par2 == 'Double') fit <- HoltWinters(x, gamma=F)
if (par2 == 'Triple') fit <- HoltWinters(x, seasonal=par3)
fit
myresid <- x - fit$fitted[,'xhat']
bitmap(file='test1.png')
op <- par(mfrow=c(2,1))
plot(fit,ylab='Observed (black) / Fitted (red)',main='Interpolation Fit of Exponential Smoothing')
plot(myresid,ylab='Residuals',main='Interpolation Prediction Errors')
par(op)
dev.off()
bitmap(file='test2.png')
p <- predict(fit, par1, prediction.interval=TRUE)
np <- length(p[,1])
plot(fit,p,ylab='Observed (black) / Fitted (red)',main='Extrapolation Fit of Exponential Smoothing')
dev.off()
bitmap(file='test3.png')
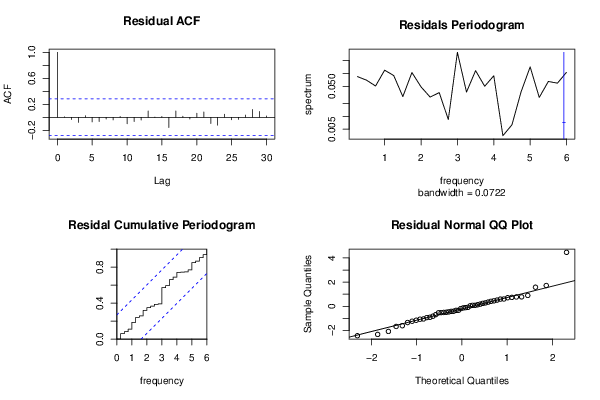
op <- par(mfrow = c(2,2))
acf(as.numeric(myresid),lag.max = nx/2,main='Residual ACF')
spectrum(myresid,main='Residals Periodogram')
cpgram(myresid,main='Residal Cumulative Periodogram')
qqnorm(myresid,main='Residual Normal QQ Plot')
qqline(myresid)
par(op)
dev.off()
load(file='createtable')
a<-table.start()
a<-table.row.start(a)
a<-table.element(a,'Estimated Parameters of Exponential Smoothing',2,TRUE)
a<-table.row.end(a)
a<-table.row.start(a)
a<-table.element(a,'Parameter',header=TRUE)
a<-table.element(a,'Value',header=TRUE)
a<-table.row.end(a)
a<-table.row.start(a)
a<-table.element(a,'alpha',header=TRUE)
a<-table.element(a,fit$alpha)
a<-table.row.end(a)
a<-table.row.start(a)
a<-table.element(a,'beta',header=TRUE)
a<-table.element(a,fit$beta)
a<-table.row.end(a)
a<-table.row.start(a)
a<-table.element(a,'gamma',header=TRUE)
a<-table.element(a,fit$gamma)
a<-table.row.end(a)
a<-table.end(a)
table.save(a,file='mytable.tab')
a<-table.start()
a<-table.row.start(a)
a<-table.element(a,'Interpolation Forecasts of Exponential Smoothing',4,TRUE)
a<-table.row.end(a)
a<-table.row.start(a)
a<-table.element(a,'t',header=TRUE)
a<-table.element(a,'Observed',header=TRUE)
a<-table.element(a,'Fitted',header=TRUE)
a<-table.element(a,'Residuals',header=TRUE)
a<-table.row.end(a)
for (i in 1:nxmK) {
a<-table.row.start(a)
a<-table.element(a,i+K,header=TRUE)
a<-table.element(a,x[i+K])
a<-table.element(a,fit$fitted[i,'xhat'])
a<-table.element(a,myresid[i])
a<-table.row.end(a)
}
a<-table.end(a)
table.save(a,file='mytable1.tab')
a<-table.start()
a<-table.row.start(a)
a<-table.element(a,'Extrapolation Forecasts of Exponential Smoothing',4,TRUE)
a<-table.row.end(a)
a<-table.row.start(a)
a<-table.element(a,'t',header=TRUE)
a<-table.element(a,'Forecast',header=TRUE)
a<-table.element(a,'95% Lower Bound',header=TRUE)
a<-table.element(a,'95% Upper Bound',header=TRUE)
a<-table.row.end(a)
for (i in 1:np) {
a<-table.row.start(a)
a<-table.element(a,nx+i,header=TRUE)
a<-table.element(a,p[i,'fit'])
a<-table.element(a,p[i,'lwr'])
a<-table.element(a,p[i,'upr'])
a<-table.row.end(a)
}
a<-table.end(a)
table.save(a,file='mytable2.tab')