Free Statistics

of Irreproducible Research!

Author's title

Author*Unverified author*
R Software Modulerwasp_grangercausality.wasp
Title produced by softwareBivariate Granger Causality
Date of computationSun, 24 Apr 2016 09:12:21 +0100
Cite this page as followsStatistical Computations at FreeStatistics.org, Office for Research Development and Education, URL https://freestatistics.org/blog/index.php?v=date/2016/Apr/24/t1461486018eayaeg2gkuerebm.htm/, Retrieved Tue, 30 Apr 2024 18:39:51 +0000
Statistical Computations at FreeStatistics.org, Office for Research Development and Education, URL https://freestatistics.org/blog/index.php?pk=294621, Retrieved Tue, 30 Apr 2024 18:39:51 +0000
QR Codes:

Original text written by user:
IsPrivate?No (this computation is public)
User-defined keywords
Estimated Impact131
Family? (F = Feedback message, R = changed R code, M = changed R Module, P = changed Parameters, D = changed Data)
-       [Bivariate Granger Causality] [] [2016-04-24 08:12:21] [d41d8cd98f00b204e9800998ecf8427e] [Current]
Feedback Forum

Post a new message
Dataseries X:
22,193
35,025
38,012
38,275
46,083
51,867
43,315
32,661
32,331
39,309
43,956
52,01
67,226
89,282
111,885
148,734
188,24
121,552
136,011
163,161
175,707
179,57
132,343
Dataseries Y:
0
0
363977000
1541936000
2262343000
2402423000
2795004000
4603478000
3779270000
3556779000
3656343000
3781676000
3638890000
3059060000
2800171000
2500501000
6725937000
13026631000
16261859000
16211596000
12794964000
7189980000
7607503000


Summary of computational transaction
Raw Inputview raw input (R code)
Raw Outputview raw output of R engine
Computing time2 seconds
R Server'Herman Ole Andreas Wold' @ wold.wessa.net

\begin{tabular}{lllllllll}
\hline
Summary of computational transaction \tabularnewline
Raw Input & view raw input (R code)  \tabularnewline
Raw Output & view raw output of R engine  \tabularnewline
Computing time & 2 seconds \tabularnewline
R Server & 'Herman Ole Andreas Wold' @ wold.wessa.net \tabularnewline
\hline
\end{tabular}
%Source: https://freestatistics.org/blog/index.php?pk=294621&T=0

[TABLE]
[ROW][C]Summary of computational transaction[/C][/ROW]
[ROW][C]Raw Input[/C][C]view raw input (R code) [/C][/ROW]
[ROW][C]Raw Output[/C][C]view raw output of R engine [/C][/ROW]
[ROW][C]Computing time[/C][C]2 seconds[/C][/ROW]
[ROW][C]R Server[/C][C]'Herman Ole Andreas Wold' @ wold.wessa.net[/C][/ROW]
[/TABLE]
Source: https://freestatistics.org/blog/index.php?pk=294621&T=0

Globally Unique Identifier (entire table): ba.freestatistics.org/blog/index.php?pk=294621&T=0

As an alternative you can also use a QR Code:  

The GUIDs for individual cells are displayed in the table below:

Summary of computational transaction
Raw Inputview raw input (R code)
Raw Outputview raw output of R engine
Computing time2 seconds
R Server'Herman Ole Andreas Wold' @ wold.wessa.net


Granger Causality Test: Y = f(X)
ModelRes.DFDiff. DFFp-value
Complete model19
Reduced model20-12.934507337151310.102976103578861

\begin{tabular}{lllllllll}
\hline
Granger Causality Test: Y = f(X) \tabularnewline
Model & Res.DF & Diff. DF & F & p-value \tabularnewline
Complete model & 19 &  &  &  \tabularnewline
Reduced model & 20 & -1 & 2.93450733715131 & 0.102976103578861 \tabularnewline
\hline
\end{tabular}
%Source: https://freestatistics.org/blog/index.php?pk=294621&T=1

[TABLE]
[ROW][C]Granger Causality Test: Y = f(X)[/C][/ROW]
[ROW][C]Model[/C][C]Res.DF[/C][C]Diff. DF[/C][C]F[/C][C]p-value[/C][/ROW]
[ROW][C]Complete model[/C][C]19[/C][C][/C][C][/C][C][/C][/ROW]
[ROW][C]Reduced model[/C][C]20[/C][C]-1[/C][C]2.93450733715131[/C][C]0.102976103578861[/C][/ROW]
[/TABLE]
Source: https://freestatistics.org/blog/index.php?pk=294621&T=1

Globally Unique Identifier (entire table): ba.freestatistics.org/blog/index.php?pk=294621&T=1

As an alternative you can also use a QR Code:  

The GUIDs for individual cells are displayed in the table below:

Granger Causality Test: Y = f(X)
ModelRes.DFDiff. DFFp-value
Complete model19
Reduced model20-12.934507337151310.102976103578861


Granger Causality Test: X = f(Y)
ModelRes.DFDiff. DFFp-value
Complete model19
Reduced model20-11.11402184919910.304446352859715

\begin{tabular}{lllllllll}
\hline
Granger Causality Test: X = f(Y) \tabularnewline
Model & Res.DF & Diff. DF & F & p-value \tabularnewline
Complete model & 19 &  &  &  \tabularnewline
Reduced model & 20 & -1 & 1.1140218491991 & 0.304446352859715 \tabularnewline
\hline
\end{tabular}
%Source: https://freestatistics.org/blog/index.php?pk=294621&T=2

[TABLE]
[ROW][C]Granger Causality Test: X = f(Y)[/C][/ROW]
[ROW][C]Model[/C][C]Res.DF[/C][C]Diff. DF[/C][C]F[/C][C]p-value[/C][/ROW]
[ROW][C]Complete model[/C][C]19[/C][C][/C][C][/C][C][/C][/ROW]
[ROW][C]Reduced model[/C][C]20[/C][C]-1[/C][C]1.1140218491991[/C][C]0.304446352859715[/C][/ROW]
[/TABLE]
Source: https://freestatistics.org/blog/index.php?pk=294621&T=2

Globally Unique Identifier (entire table): ba.freestatistics.org/blog/index.php?pk=294621&T=2

As an alternative you can also use a QR Code:  

The GUIDs for individual cells are displayed in the table below:

Granger Causality Test: X = f(Y)
ModelRes.DFDiff. DFFp-value
Complete model19
Reduced model20-11.11402184919910.304446352859715


Parameters (Session):
par1 = 1 ; par2 = 0 ; par3 = 0 ; par4 = 1 ; par5 = 1 ; par6 = 0 ; par7 = 0 ; par8 = 1 ;
Parameters (R input):
par1 = 1 ; par2 = 0 ; par3 = 0 ; par4 = 1 ; par5 = 1 ; par6 = 0 ; par7 = 0 ; par8 = 1 ;
R code (references can be found in the software module):
library(lmtest)
par1 <- as.numeric(par1)
par2 <- as.numeric(par2)
par3 <- as.numeric(par3)
par4 <- as.numeric(par4)
par5 <- as.numeric(par5)
par6 <- as.numeric(par6)
par7 <- as.numeric(par7)
par8 <- as.numeric(par8)
ox <- x
oy <- y
if (par1 == 0) {
x <- log(x)
} else {
x <- (x ^ par1 - 1) / par1
}
if (par5 == 0) {
y <- log(y)
} else {
y <- (y ^ par5 - 1) / par5
}
if (par2 > 0) x <- diff(x,lag=1,difference=par2)
if (par6 > 0) y <- diff(y,lag=1,difference=par6)
if (par3 > 0) x <- diff(x,lag=par4,difference=par3)
if (par7 > 0) y <- diff(y,lag=par4,difference=par7)
x
y
(gyx <- grangertest(y ~ x, order=par8))
(gxy <- grangertest(x ~ y, order=par8))
bitmap(file='test1.png')
op <- par(mfrow=c(2,1))
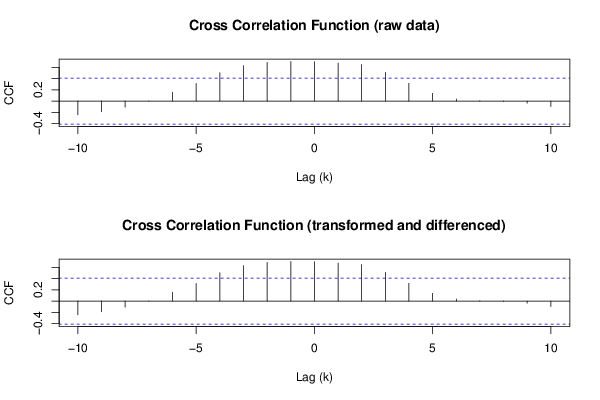
(r <- ccf(ox,oy,main='Cross Correlation Function (raw data)',ylab='CCF',xlab='Lag (k)'))
(r <- ccf(x,y,main='Cross Correlation Function (transformed and differenced)',ylab='CCF',xlab='Lag (k)'))
par(op)
dev.off()
bitmap(file='test2.png')
op <- par(mfrow=c(2,1))
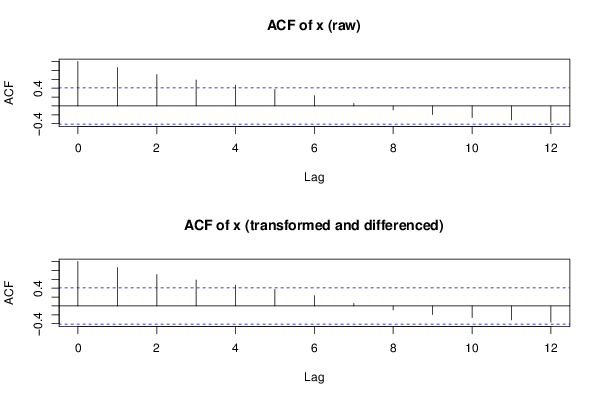
acf(ox,lag.max=round(length(x)/2),main='ACF of x (raw)')
acf(x,lag.max=round(length(x)/2),main='ACF of x (transformed and differenced)')
par(op)
dev.off()
bitmap(file='test3.png')
op <- par(mfrow=c(2,1))
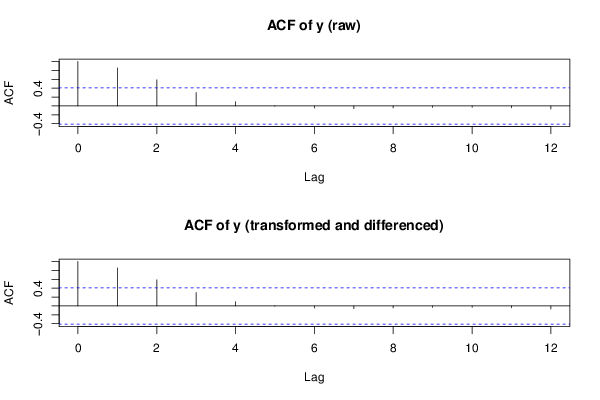
acf(oy,lag.max=round(length(y)/2),main='ACF of y (raw)')
acf(y,lag.max=round(length(y)/2),main='ACF of y (transformed and differenced)')
par(op)
dev.off()
load(file='createtable')
a<-table.start()
a<-table.row.start(a)
a<-table.element(a,'Granger Causality Test: Y = f(X)',5,TRUE)
a<-table.row.end(a)
a<-table.row.start(a)
a<-table.element(a,'Model',header=TRUE)
a<-table.element(a,'Res.DF',header=TRUE)
a<-table.element(a,'Diff. DF',header=TRUE)
a<-table.element(a,'F',header=TRUE)
a<-table.element(a,'p-value',header=TRUE)
a<-table.row.end(a)
a<-table.row.start(a)
a<-table.element(a,'Complete model',header=TRUE)
a<-table.element(a,gyx$Res.Df[1])
a<-table.element(a,'')
a<-table.row.end(a)
a<-table.row.start(a)
a<-table.element(a,'Reduced model',header=TRUE)
a<-table.element(a,gyx$Res.Df[2])
a<-table.element(a,gyx$Df[2])
a<-table.element(a,gyx$F[2])
a<-table.element(a,gyx$Pr[2])
a<-table.row.end(a)
a<-table.end(a)
table.save(a,file='mytable1.tab')
a<-table.start()
a<-table.row.start(a)
a<-table.element(a,'Granger Causality Test: X = f(Y)',5,TRUE)
a<-table.row.end(a)
a<-table.row.start(a)
a<-table.element(a,'Model',header=TRUE)
a<-table.element(a,'Res.DF',header=TRUE)
a<-table.element(a,'Diff. DF',header=TRUE)
a<-table.element(a,'F',header=TRUE)
a<-table.element(a,'p-value',header=TRUE)
a<-table.row.end(a)
a<-table.row.start(a)
a<-table.element(a,'Complete model',header=TRUE)
a<-table.element(a,gxy$Res.Df[1])
a<-table.element(a,'')
a<-table.row.end(a)
a<-table.row.start(a)
a<-table.element(a,'Reduced model',header=TRUE)
a<-table.element(a,gxy$Res.Df[2])
a<-table.element(a,gxy$Df[2])
a<-table.element(a,gxy$F[2])
a<-table.element(a,gxy$Pr[2])
a<-table.row.end(a)
a<-table.end(a)
table.save(a,file='mytable2.tab')